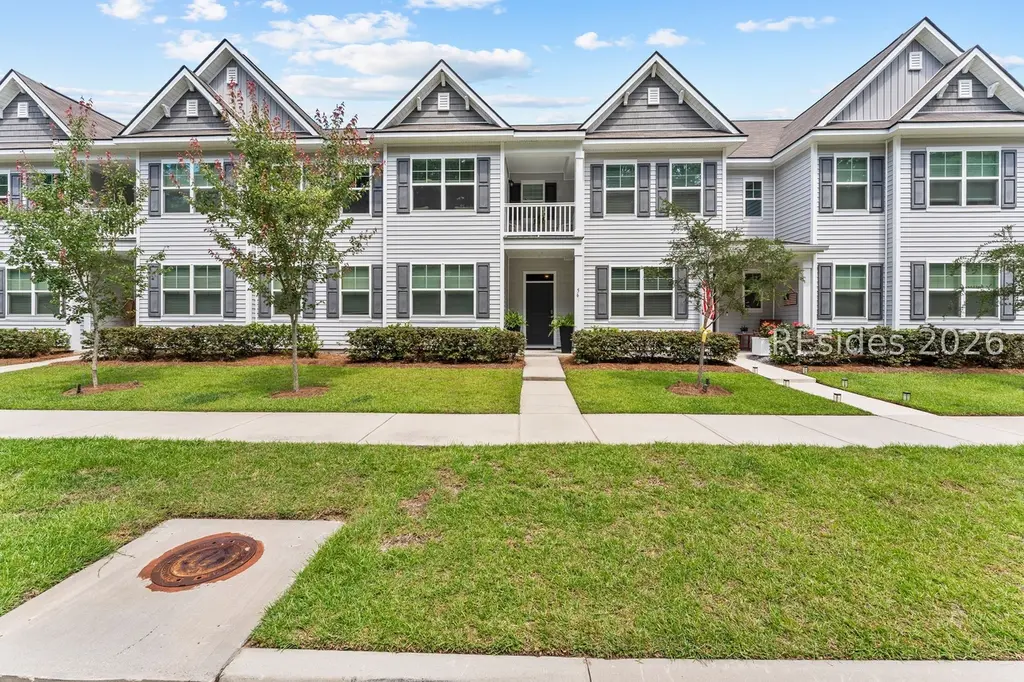
56 Slater St · Bluffton, SC
Flood risk No data
- FEMA flood zone
- —
- Chance of flooding over 30 yrs
- —
- Est. flood insurance / yr
- —
Fire risk No data
- Est. fire insurance / yr
- —
Heat risk No data
- Hot days now (above threshold)
- —
- Hot days in 30 yrs
- —
Wind risk No data
- Chance of severe wind over 30 yrs
- —
Air-quality risk No data
- Unhealthy air days now
- —
- Unhealthy air days in 30 yrs
- —
Risk factors via First Street. Map © Google.
Why this score? — see what drove the D grade
The composite is a weighted blend of 9 inputs, each scored 0–100. Each bar is that input's sub-score; the figure is the points it added to the 100-point composite (weight × sub-score).
- Cash flow +14.0/30.0
- ARV discount +6.2/15.0
- Rent growth +4.8/5.0
- DSCR +4.3/10.0
- Schools +4.1/10.0
- Livability +3.4/5.0
- 1% rule +3.0/10.0
- Condition / age +2.5/5.0
- Appreciation +0.0/10.0
$389,500
🖨 Deal sheet (PDF) 📄 Offer letter ✓ Due diligence
Listing remarks MLS
This Ralston plan has 3 bedrooms with flex space, 2.5 bath, 1 car garage provides great flexibility for your living situation. Spacious rear patio is a great location to grill & entertain. The kitchen has stainless steel appliances, pantry, ample cabinets for storage, granite island. Primary bedroom upstairs features a tray ceiling, a large WIC & balcony access. Ensuite bath features 5ft shower, dual vanities & linen closet. HOA dues includes lawn care. Pictures are of a model home in another community. * Pictures, photographs, colors, features & sizes are for illustration purposes only and will vary from the homes as built. *
Key facts
- Upgraded kitchen
- Durable lvp flooring
- Garage
Tags
Property features AI
Finance
- Other: Community pool
- HOA & community: Monthly association fee; Association maintains grounds; Community amenities include pool, fitness center, basketball court, trails, and gas service
Exterior
- Parking: Driveway; Detached one-car garage
- Security: Fire alarm; Smoke detectors
- Utilities: Public water
- Home design: 2-story home; Has a view
- Construction: Vinyl siding; Asphalt roof
- Exterior features: Rear porch; Front porch
Interior
- Kitchen: Dishwasher; Gas range; Microwave; Water purifier
- Bedrooms: Primary bedroom on upper level
- Flooring: Carpet; Luxury vinyl; Luxury vinyl plank; Tile
- Bathrooms: 2 full bathrooms; 1 half bathroom
- Heating & cooling: Central heat; Central air conditioning
- Interior features: Unfurnished; Attic with pull-down stairs; Ceiling fans; Smooth ceilings; Smart thermostat; Cable TV; Upper-level primary bedroom
- Laundry & utility: Tankless water heater
Neighborhood map
What this means for you Summary
Snapshot
- This is a 4-bed/2.5-bath townhouse listed at $390k.
Deal economics
- At list price, monthly cash flow is $53 ($641/yr) — positive.
- The deal already cash-flows at list — no discount required.
- To meet the 1% rule (rent ≥ 1% of price), the offer needs to be $313k (19.6% below list).
- Recommended offer: $313k (19.6% below list) — sets the bar for 1% rule.
- Cap rate 6.5% vs local median 3.2% in Bluffton — top-decile yield for the area; either an underpriced asset or a hidden risk that comps aren't pricing in. Stress-test before assuming the spread holds.
Location & tenants
- Location reads 68/100 on livability (#76 in SC) — a middle-class / working-renter tenant base. Strengths: crime A+, employment A+, housing A+; Watch: amenities F, commute F, cost of living D-.
- Beaufort 01 (town): math 42% / reading 51% proficiency, ranked #17 of 80 in SC (top 21%) — families likely to look elsewhere, expect single-tenant / working-renter base with shorter leases.
- Market conditions: Rents rising fast (+9.3%/yr); 650 active listings in the ZIP; 3 comparable units currently listed for rent nearby; rentals lingering (median 45d on market — plan ~5-8 weeks vacancy on turnover, expect pricing pressure); 67% of comp listings sitting > 30 days — soft ceiling on asking rent; solid renter incomes; 1,824 units permitted in Beaufort County in 2024 (618 in 5+ unit buildings).
- This rent runs 41% of the median local income ($91k/yr) — at the standard rent-burdened threshold; future hikes will face affordability resistance.
Forward outlook
- Local home prices are declining (-3.0%/yr); year-one equity from $3k of loan paydown is wiped out by about $12k of value loss. Plan a longer hold.
- Beaufort County population projected at +30% by 2050 — long-run rental-demand tailwind backs the buy-and-hold thesis.
Negotiation context
- Only 1 days on market — expect competitive offers; lowballing is unlikely to land.
- 2 sale attempts since 4y ago with the ask held roughly flat each time — persistent listings suggest the price (not the market) is what's stuck; bring a comps-based counter.
Questions for the listing agent
- Is there a deadline driving the sale (1031 exchange, divorce, estate, relocation)? That informs how much negotiation room exists.
- Schools are B-rated — typically a magnet for longer-tenancy family renters. What's the average tenant stay here, and is there a school-zone premium baked into asking?
- The area grade is low — what's the realistic commute time and amenity access for the typical tenant pool here? Any planned neighborhood developments (good or bad) we should know about?
- What's the average days-on-market for RENTAL listings here right now (not sales)? A rising rental-DOM trend means longer vacancies and softer asking-rent achievability than the comps imply.
- What's the recent tenant-quality profile in this submarket — average credit score on applications, eviction rate, late-payment / NSF rate, and stable-employment percentage? A property-management company in the area should have these aggregated.
- How much new for-sale + rental construction is in the pipeline within 1–3 miles? Heavy new supply typically softens prices + rents 12–24 months out; constrained supply supports both.
Investment metrics
- 1% rule
- 0.80% ✗
- Cap rate
- 6.46%
- Cash-on-cash
- 0.59%
- DSCR
- 1.03
- GRM
- 10.4
CMA / ARV
- ARV (on-the-fly)
- $378,672
- Comps found
- 12
Show comp detail 12 sales within ~0.75 mi
| Address | Dist | Beds/Ba | Sqft | Sold | Price | $/sf | Match |
|---|---|---|---|---|---|---|---|
| 86 Slater St | 0.07mi | 4/2.5 | 2,058 (0%) | 8mo | $365,000 | $177 | 91 |
| 2048 Blakers Blvd | 0.05mi | 4/3.5 | 2,058 (0%) | 6mo | $375,000 | $182 | 88 |
| 38 Slater St | 0.04mi | 4/2.5 | 2,002 (-3%) | 19mo | $369,000 | $184 | 78 |
| 320 Corn Mill Way | 0.26mi | 3/3.0 (-1) | 1,901 (-8%) | 1mo | $350,000 | $184 | 68 |
| 120 Slater St | 0.15mi | 3/2.5 (-1) | 1,798 (-13%) | 2mo | $309,000 | $172 | 65 |
| 204 Wooden Wheel Ln | 0.17mi | 3/3.0 (-1) | 1,806 (-12%) | 5mo | $408,000 | $226 | 60 |
| 259 Wooden Wheel Ln | 0.31mi | 3/3.0 (-1) | 1,806 (-12%) | 2mo | $389,500 | $216 | 57 |
| 215 Dillard Mill Dr | 0.11mi | 3/2.5 (-1) | 1,798 (-13%) | 15mo | $235,000 | $131 | 57 |
| 322 Corn Mill Way | 0.26mi | 3/3.0 (-1) | 1,806 (-12%) | 7mo | $340,000 | $188 | 55 |
| 227 Wooden Wheel Ln | 0.24mi | 3/3.0 (-1) | 1,806 (-12%) | 11mo | $375,000 | $208 | 52 |
| 2172 Blakers Blvd | 0.28mi | 4/3.5 | 2,256 (+10%) | 18mo | $405,000 | $180 | 52 |
| 205 Wooden Wheel Ln | 0.18mi | 3/3.0 (-1) | 1,806 (-12%) | 16mo | $395,000 | $219 | 50 |
Match score weights: distance 35% · size 25% · config 20% · recency 20%. Top-matched comps best support the ARV.
Projected returns pro-forma
-3.0% appreciation · 8.0% rent growth · sell at horizon
- IRR
- -10.4%
- Equity multiple
- 0.60×
- Total profit
- $-43,293
- Equity at exit
- $58,076
- IRR
- 4.3%
- Equity multiple
- 1.38×
- Total profit
- $41,474
- Equity at exit
- $33,677
Cash invested: $109,060 (down + closing). Projections, not guarantees.
Landlord ↔ Tenant lean methodology
- Overall (STATE)
- 90 Strongly Landlord-Friendly
- State South Carolina
- 90 Strongly Landlord-Friendly · R+6
- County
- — inherits STATE
- City
- — inherits STATE
ZIP-level market 29909
- Home prices YoY
- -12.5%
- Rents YoY
- 9.3%
- Active inventory
- 650
- Price-to-rent
- 10.4×
Monthly cashflow live
- Estimated rent
- $3,130 medium interval (Pro) →
- Mortgage (P&I)
- −$2,043
- Tax from tax record
- −$214 /mo · $2,571/yr
- Insurance
- −$162
- HOA
- −$0
- Vacancy / Maint / Mgmt
- −$657
- Net cashflow
- $53
Break-even live
Sensitivity live
| Price | -10% $274 | -5% $164 | +0% $53 | +5% $-57 | +10% $-167 |
|---|---|---|---|---|---|
| Rent | -10% $-194 | -5% $-70 | +0% $53 | +5% $177 | +10% $301 |
| Rate | -1.0pp $250 | -0.5pp $152 | base $53 | +0.5pp $-48 | +1.0pp $-150 |
UW: 25.0% down · 7.5% · 30yr · 1.5% tax · 5.0% vac · 8.0% maint · 8.0% mgmt
Financing live
Cash to close
- Down payment
- $97,375
- Closing costs
- $11,685
- Reserves months
- —
- Total cash needed
- —
Loan-product check · same deal, 3 products live
Conventional
25% down · 7.5% · 30yr
- Down + closing
- —
- Monthly P&I
- —
- Monthly cashflow
- —
- DSCR
- —
- Eligible?
- —
Personal DTI + credit; lowest rate.
DSCR
20% down · 8.5% · 30yr
- Down + closing
- —
- Monthly P&I
- —
- Monthly cashflow
- —
- DSCR
- —
- Eligible?
- —
No personal income docs; deal must DSCR.
Hard money
10% down · 12.0% · 12mo
- Down + closing
- —
- Monthly P&I
- —
- Monthly cashflow
- —
- DSCR
- —
- Eligible?
- —
Short-term bridge; refi at stabilization.
Rent comps 3 comps
| Address | Beds | Baths | Sqft | Rent | $/sqft | DOM | Units | Dist |
|---|---|---|---|---|---|---|---|---|
| 68 Slater St Okatie, SC | 3.0 | 2.5 | 1600 | $2,700 | $1.69 | 44d | 1 | 0.07mi |
| 2155 Blakers Blvd Okatie, SC | 4.0 | 3.5 | 2568 | $2,650 | $1.03 | 44d | 1 | 0.26mi |
| 17 Thomas Bee Dr Bluffton, SC | 3.0 | 2.0 | 1848 | $3,000 | $1.62 | 14d | 1 | 1.30mi |
Listing history 2 events
-
2026-06-18remarks 691-char remark
-
2026-06-18$389,500 Active 1 DOM
ⓘ Source: listings_history table (triggers on properties + properties_extension) + one-shot
backfill from property_details.listing_events for pre-trigger history.
Tax reassessment forecast SC · Resets to sale price
- Current annual tax
- $2,571 · $214/mo
- Projected year-2 tax
- $2,571 · $214/mo
- Expected delta
- $0/yr ($0/mo · 0.0%)
ⓘ Screening estimate from a state-policy table — verify with the county assessor before closing.
Nearby sold comps map
Loading sold comps map…
Walkable amenities ~0.75 mi
Loading nearby amenities…
Taxation est. · year 1
- Rental income
- $37,557
- − Mortgage interest
- −$21,818
- − Property taxes
- −$2,571
- − Insurance
- −$1,948
- − Repairs & maintenance
- −$3,005
- − Management
- −$3,005
- − Depreciation
- −$11,331
- Taxable loss
- −$6,119
- Est. tax savings @ 24.0%
- +$1,469
- After-tax cash flow
- $2,110/yr
For passive investors: Depreciation is non-cash, so a rental often shows a tax loss while cash-flowing — sheltering income. Rental losses are passive: they offset passive income freely, and up to $25,000/yr can offset ordinary (W-2) income if you actively participate and your MAGI is under $100k (phasing out to $0 by $150k); unused losses carry forward. On sale, claimed depreciation is recaptured at up to 25%, and gains may owe capital-gains tax (a 1031 exchange can defer both). Figures are a year-1 estimate at your 24.0% rate — not tax advice; consult a CPA.
Schools (NCES district)
- District
- Beaufort 01
- NCES district ID
- 4501110
- Math proficiency
- 42% ▼ -8.00%
- Reading proficiency
- 51% ▲ 2.00%
- Median HH income
- $57,430
- Composite
- 40.56/100
- National rank
- #3699
- State rank
- #17 of 80 in SC
Livability — Bluffton
- Score
- 68/100
- State rank
- #76
- US rank
- #8936
Category grades
Schools grade is shown separately in the Schools card above.
Census & demographics
- Census place
- Bluffton, SC
- County
- Beaufort County · 163,770 people
- City population
- 77,022
- Metro
- Hilton Head Island-Bluffton, SC
- Population (ZIP)
- 24,003
- Household income
- $91,294
- Rent vs Own
- Severe rent burden
- 268.0
Population outlook (Beaufort County) Hauer SSP2
- Today (2025)
- 211,915 people
- By 2030
- 227,272 · +7.2%
- By 2040
- 253,861 · +19.8%
- By 2050
- 275,126 · +29.8%
- By 2075
- 311,022 · +46.8%
- By 2100
- 321,286 · +51.6%
Race, ethnicity, and origin ACS 2023
- Neighborhood character
- Predominantly White (89%)
- Race & ethnicity
- White 89% Black 4% Hispanic / Latino 4% Two or more races 3% Asian 1%
- Common ancestry
- Romanian 5% Lithuanian 3% Slovak 2%
- Foreign-born
- 6% · Canada, Vietnam
- Languages at home
- 94% English-only · Spanish 2% Other Indo-European 1%
Political lean MEDSL · Beaufort
- 2024 margin
- R (+14.5) · D 42.1% · R 56.6% · Other 1.2%
- 2008→2024 swing
- -3.7pp toward R · 2008: -10.8pp · 2024: -14.5pp
- All cycles
- 2024: R+14.5 2020: R+10.0 2016: R+14.3 2012: R+17.5 2008: R+10.8
Not yet ingested
- Civics
- —
Market trends
- HPI YoY
- ▼ -27.99%
- Current HPI
- 196.0491
- Rent YoY
- ▲ 9.31%
- Metro
- Hilton Head Island-Bluffton, SC
- State GDP YoY
- ▲ 4.51%
- F500 in state
- 2
Industry mix (Fortune 500 HQ in SC)
| Industry | F500 HQs | Revenue |
|---|---|---|
| Packaging | 1 | $7B |
|
||
Price history
+4.4% since first listed4 events — show timeline
- 2026-06-18 Listed $389,500 RSMLS
- 2022-09-28 Sold (MLS) $373,175 RSMLS
- 2022-05-09 Delisted — RSMLS
- 2022-03-31 Listed $373,175 RSMLS
Property tax history
+67.4%/yrLatest (2025): $2,571 · -60.3% YoY. Source: county tax records.
Cash-flow waterfall
monthlySold comps — $/sqft
last 12 mo · ≤1 miLoading sold comps…