 🏷️ Likely Rental
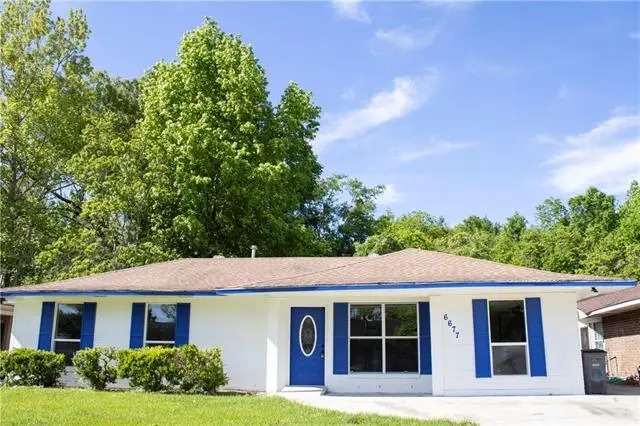
6677 E Monarch Ave · Merrydale, LA
Flood risk 1/10 · Minimal
- FEMA flood zone
- X (unshaded)
- Chance of flooding over 30 yrs
- 0.0%
- Est. flood insurance / yr
- $507 – $1,088
Fire risk 1/10 · Minimal
- Est. fire insurance / yr
- $1,269 – $2,357
Heat risk 8/10 · Major
- Hot days now (above 108°F)
- 7 days/yr
- Hot days in 30 yrs
- 20 days/yr
Wind risk 9/10 · Severe
- Chance of severe wind over 30 yrs
- 99.0%
Air-quality risk 3/10 · Minor
- Unhealthy air days now
- 3 days/yr
- Unhealthy air days in 30 yrs
- 4 days/yr
Risk factors via First Street. Map © Google.
Why this score? — see what drove the C- grade
The composite is a weighted blend of 9 inputs, each scored 0–100. Each bar is that input's sub-score; the figure is the points it added to the 100-point composite (weight × sub-score).
- Cash flow +15.0/30.0
- Appreciation +8.0/10.0
- ARV discount +7.5/15.0
- 1% rule +5.0/10.0
- DSCR +5.0/10.0
- Livability +2.9/5.0
- Rent growth +2.5/5.0
- Condition / age +2.5/5.0
- Schools +2.4/10.0
$2,000
🖨 Deal sheet 📄 Offer letter ✓ Due diligence
Listing remarks MLS
Spacious and beautifully newly renovated 5-bedroom, 3-bathroom home for lease! This property offers an abundance of space with a versatile floor plan. Enjoy modern updates throughout, including refreshed interiors, updated kitchen and baths, and plenty of natural light. Generously sized bedrooms and multiple living areas provide flexibility for families, roommates, or those needing extra space to work from home. Additional features include a two-car driveway and a bathroom cabinet to be installed prior to move-in. Small pets allowed with a $250 pet deposit. Tenant is responsible for all utilities, and earned income verification. Vacant and easy to show--schedule your appointment through ShowingTime today!
Key facts
- 7,914 sq ft lot
- Built 1980
- Listed 72 days
Neighborhood map
What this means for you Summary
Snapshot
- This is a 5-bed/3.0-bath single-family listed at $2k.
Deal economics
- At list price, monthly cash flow is $1k ($14k/yr) — positive.
- The deal already cash-flows at list — no discount required.
- Meets the 1% rule at list price ($1k rent vs $2k).
- Recommended offer: $2k (6.0% below list) — sets the bar for market timing.
- Cap rate 688.4% vs local median 7.8% in Merrydale — top-decile yield for the area; either an underpriced asset or a hidden risk that comps aren't pricing in. Stress-test before assuming the spread holds.
Location & tenants
- Location reads 58/100 on livability (#301 in LA) — a working-class tenant base; expect higher turnover. Strengths: cost of living A+, housing A; Watch: schools C-, crime F, amenities F.
- East Baton Rouge Parish (urban): math 22% / reading 34% proficiency, ranked #47 of 98 in LA (top 48%) — low school quality limits family demand, transient renter base, plan for 1-2y turnover; 77% free/reduced lunch — lower-income household profile, screen leases tightly.
- Market conditions: 39 active listings in the ZIP; 4 comparable units currently listed for rent nearby; rentals at typical pace (median 24d on market — plan ~3-4 weeks tenant-placement turnaround); 2,252 units permitted in East Baton Rouge Parish in 2024 (440 in 5+ unit buildings).
Forward outlook
- In year one you build about $133 of equity ($14 loan paydown + $119 appreciation (5.9% local appreciation)).
- East Baton Rouge County population projected at +4% by 2050 — modest demand growth; plan on rents tracking national, not racing it.
- At projected returns (5.9% appreciation + 3.0% rent growth), your $560 cash investment doubles in ~1 year — after that, you're playing with house money.
Negotiation context
- It's been on market 72 days — a 6% lower offer ($2k) is reasonable based on typical stale-listing flexibility.
- 2 sale attempts with the ask held roughly flat each time — persistent listings suggest the price (not the market) is what's stuck; bring a comps-based counter.
Risks & watch-outs
- Climate carrying-cost: severe wind risk, 99% chance of damaging wind over 30y; extreme-heat days projected 7→20/yr by 2055 (HVAC capex compounding) — expect insurance premiums to compound above CPI over the hold.
Questions for the listing agent
- It's been on market 72 days. Have you received any prior offers? Is the seller open to a 6% concession, seller financing, or rate buy-down credit?
- Why hasn't it sold? Are there any deal-killer items the seller is aware of (foundation, flood, title, zoning, code violations)?
- Is there a deadline driving the sale (1031 exchange, divorce, estate, relocation)? That informs how much negotiation room exists.
- Crime grade is F in this area — have there been break-ins, vandalism, or insurance claims at this property in the last 3 years? What carrier currently insures it and at what premium?
- What's the average days-on-market for RENTAL listings here right now (not sales)? A rising rental-DOM trend means longer vacancies and softer asking-rent achievability than the comps imply.
- What's the recent tenant-quality profile in this submarket — average credit score on applications, eviction rate, late-payment / NSF rate, and stable-employment percentage? A property-management company in the area should have these aggregated.
- How much new for-sale + rental construction is in the pipeline within 1–3 miles? Heavy new supply typically softens prices + rents 12–24 months out; constrained supply supports both.
Investment metrics
- 1% rule
- 72.83% ✓
- Cap rate
- 688.45%
- Cash-on-cash
- 2436.27%
- DSCR
- 109.40
- GRM
- 0.1
CMA / ARV
- ARV (median comp)
- $172,589
- List price
- $2,000
- Delta
- -98.84%
- Verdict
- UNDERPRICED
- Comps
- 20 within 1.0 mi
Show comp detail 5 sales within ~0.75 mi
| Address | Dist | Beds/Ba | Sqft | Sold | Price | $/sf | Match |
|---|---|---|---|---|---|---|---|
| 6778 Glen Echo Dr | 0.31mi | 5/2.0 | 1,850 (-3%) | 2mo | $121,000 | $65 | 75 |
| 6950 Modesto Ave | 0.42mi | 4/3.0 (-1) | 1,948 (+2%) | 15mo | $237,500 | $122 | 59 |
| 6069 Sumrall Drive Dr | 0.34mi | 4/2.0 (-1) | 1,859 (-2%) | 21mo | $180,000 | $97 | 54 |
| 7242 Perimeter Dr | 0.40mi | 5/2.0 | 1,680 (-12%) | 5mo | $85,000 | $51 | 54 |
| 6733 Sumrall Dr | 0.20mi | 4/2.0 (-1) | 1,696 (-11%) | 20mo | $189,500 | $112 | 47 |
Match score weights: distance 35% · size 25% · config 20% · recency 20%. Top-matched comps best support the ARV.
Projected returns pro-forma
5.93% appreciation · 3.0% rent growth · sell at horizon
- IRR
- —
- Equity multiple
- 131.36×
- Total profit
- $73,002
- Equity at exit
- $1,248
- IRR
- —
- Equity multiple
- 283.29×
- Total profit
- $158,080
- Equity at exit
- $2,256
Cash invested: $560 (down + closing). Projections, not guarantees.
Landlord ↔ Tenant lean methodology
- Overall (STATE)
- 90 Strongly Landlord-Friendly
- State Louisiana
- 90 Strongly Landlord-Friendly · R+12
- County
- — inherits STATE
- City
- — inherits STATE
ZIP-level market 70812
- Home prices YoY
- 3.5%
- Active inventory
- 39
- Price-to-rent
- 0.1×
Monthly cashflow live
- Estimated rent
- $1,457 medium interval (Pro) →
- Mortgage (P&I)
- −$10
- Tax est. 1.5%
- −$2 /mo · $30/yr
- Insurance
- −$1
- HOA
- −$0
- Vacancy / Maint / Mgmt
- −$306
- Net cashflow
- $1,137
Break-even live
UW: 25.0% down · 7.5% · 30yr · 1.5% tax · 5.0% vac · 8.0% maint · 8.0% mgmt
Financing live
Cash to close
- Down payment
- $500
- Closing costs
- $60
- Reserves months
- —
- Total cash needed
- —
Loan-product check · same deal, 3 products live
Conventional
25% down · 7.5% · 30yr
- Down + closing
- —
- Monthly P&I
- —
- Monthly cashflow
- —
- DSCR
- —
- Eligible?
- —
Personal DTI + credit; lowest rate.
DSCR
20% down · 8.5% · 30yr
- Down + closing
- —
- Monthly P&I
- —
- Monthly cashflow
- —
- DSCR
- —
- Eligible?
- —
No personal income docs; deal must DSCR.
Hard money
10% down · 12.0% · 12mo
- Down + closing
- —
- Monthly P&I
- —
- Monthly cashflow
- —
- DSCR
- —
- Eligible?
- —
Short-term bridge; refi at stabilization.
Rent comps 4 comps
| Address | Beds | Baths | Sqft | Rent | $/sqft | DOM | Units | Dist |
|---|---|---|---|---|---|---|---|---|
| 5115 Woodlawn Ave Baton Rouge, LA | 4.0 | 2.0 | 1789 | $1,550 | $0.87 | 14d | 1 | 1.29mi |
| 5553 Banyan Ct Baton Rouge, LA | 4.0 | 2.0 | 1459 | $1,350 | $0.93 | 23d | 1 | 1.41mi |
| 5423 Banyan Trace Dr Baton Rouge, LA | 4.0 | 2.0 | 1469 | $1,300 | $0.88 | 23d | 1 | 1.50mi |
| 4378 Dawson Dr Baton Rouge, LA | 4.0 | 2.0 | 1400 | $1,600 | $1.14 | 43d | 1 | 1.50mi |
Listing history 21 events
-
2026-06-18days on market $2,000 Active 72 DOM
-
2026-06-17days on market $2,000 Active 71 DOM
-
2026-06-16days on market $2,000 Active 70 DOM
-
2026-06-15days on market $2,000 Active 69 DOM
-
2026-06-14days on market $2,000 Active 67 DOM
-
2026-06-10days on market $2,000 Active 64 DOM
-
2026-06-09days on market $2,000 Active 63 DOM
-
2026-06-08days on market $2,000 Active 62 DOM
-
2026-06-07days on market $2,000 Active 61 DOM
-
2026-06-05days on market $2,000 Active 58 DOM
-
2026-06-03days on market $2,000 Active 57 DOM
-
2026-06-02days on market $2,000 Active 56 DOM
-
2026-06-01days on market $2,000 Active 55 DOM
-
2026-05-31days on market $2,000 Active 54 DOM
-
2026-05-31days on market $2,000 Active 53 DOM
-
2026-04-21historical $2,000
-
2026-04-08$2,000
-
2026-04-07$2,000 Active 714-char remark
Show marketing remark (714 chars)
Spacious and beautifully newly renovated 5-bedroom, 3-bathroom home for lease! This property offers an abundance of space with a versatile floor plan. Enjoy modern updates throughout, including refreshed interiors, updated kitchen and baths, and plenty of natural light. Generously sized bedrooms and multiple living areas provide flexibility for families, roommates, or those needing extra space to work from home. Additional features include a two-car driveway and a bathroom cabinet to be installed prior to move-in. Small pets allowed with a $250 pet deposit. Tenant is responsible for all utilities, and earned income verification. Vacant and easy to show--schedule your appointment through ShowingTime today!
-
2024-08-13soldstatus $62,000
-
2023-05-17soldstatus $50,000
-
1997-01-09soldstatus
ⓘ Source: listings_history table (triggers on properties + properties_extension) + one-shot
backfill from property_details.listing_events for pre-trigger history.
Climate risk First Street
- Flood 1/10 Low FEMA zone X (unshaded) · 0% chance over 30 yrs
- Wildfire 1/10 Low
- Heat 8/10 Severe 7 d/yr ≥108°F today · 20 d/yr by 30 yrs out
- Wind 9/10 Extreme 99% chance of damaging wind over 30 yrs
- Air quality 3/10 Moderate 3 unhealthy d/yr today · 4 by 30 yrs out
Nearby sold comps map
Loading sold comps map…
Walkable amenities ~0.75 mi
Loading nearby amenities…
Taxation est. · year 1
- Rental income
- $17,480
- − Mortgage interest
- −$112
- − Property taxes
- −$30
- − Insurance
- −$10
- − Repairs & maintenance
- −$1,398
- − Management
- −$1,398
- − Depreciation
- −$58
- Taxable income
- $14,473
- Est. tax owed @ 24.0%
- −$3,473
- After-tax cash flow
- $10,170/yr
For passive investors: Depreciation is non-cash, so a rental often shows a tax loss while cash-flowing — sheltering income. Rental losses are passive: they offset passive income freely, and up to $25,000/yr can offset ordinary (W-2) income if you actively participate and your MAGI is under $100k (phasing out to $0 by $150k); unused losses carry forward. On sale, claimed depreciation is recaptured at up to 25%, and gains may owe capital-gains tax (a 1031 exchange can defer both). Figures are a year-1 estimate at your 24.0% rate — not tax advice; consult a CPA.
Schools (NCES district)
- District
- East Baton Rouge Parish
- NCES district ID
- 2200540
- Math proficiency
- 22% ▼ -36.00%
- Reading proficiency
- 34% ▼ -31.00%
- Median HH income
- $46,263
- Composite
- 24.14/100
- National rank
- #7745
- State rank
- #47 of 98 in LA
Livability — Merrydale
- Score
- 58/100
- State rank
- #301
- US rank
- #21115
Category grades
Schools grade is shown separately in the Schools card above.
Census & demographics
- Census place
- Merrydale, LA
- City population
- 11,124
- Population (ZIP)
- 11,124
Population outlook (East Baton Rouge County) Hauer SSP2
- Today (2025)
- 464,810 people
- By 2030
- 472,137 · +1.6%
- By 2040
- 480,243 · +3.3%
- By 2050
- 484,422 · +4.2%
- By 2075
- 492,069 · +5.9%
- By 2100
- 476,347 · +2.5%
Race, ethnicity, and origin ACS 2023
- Neighborhood character
- Predominantly Black (97%)
- Race & ethnicity
- Black 97% Hispanic / Latino 2% White 1%
- Foreign-born
- 1% · Canada
- Languages at home
- 99% English-only · Spanish 1%
Political lean MEDSL · East Baton Rouge
- 2024 margin
- D (+11.1) · D 54.5% · R 43.4% · Other 2.1%
- 2008→2024 swing
- +8.9pp toward D · 2008: 2.2pp · 2024: 11.1pp
- All cycles
- 2024: D+11.1 2020: D+13.1 2016: D+9.2 2012: D+5.2 2008: D+2.2
Not yet ingested
- Civics
- —
Market trends
- HPI YoY
- ▲ 5.93%
- Current HPI
- 174.6882
- Rent YoY
- —
- Metro
- —
- State GDP YoY
- ▲ 3.29%
- F500 in state
- 10
Industry mix (Fortune 500 HQ in LA)
| Industry | F500 HQs | Revenue |
|---|---|---|
| Telecommunications | 2 | $23B |
|
||
| Utilities | 1 | $12B |
|
||
| Wholesale / Distribution | 1 | $5B |
|
||
| Advertising | 1 | $2B |
|
||
Price history
-96.0% since first listed6 events — show timeline
- 2026-04-21 Rental Removed $2,000 RAAMLS
- 2026-04-08 Listed for Rent $2,000 RAAMLS
- 2026-04-07 Listed $2,000 AcadianaMLS
- 2024-08-13 Sold (Public Records) $62,000 Public Records
- 2023-05-17 Sold (Public Records) $50,000 Public Records
- 1997-01-09 Sold (Public Records) — Public Records
Property tax history
+34.1%/yrLatest (2025): $1,078 · -0.4% YoY. Source: county tax records.
Cash-flow waterfall
monthlySold comps — $/sqft
last 12 mo · ≤1 miLoading sold comps…