 8-Plex
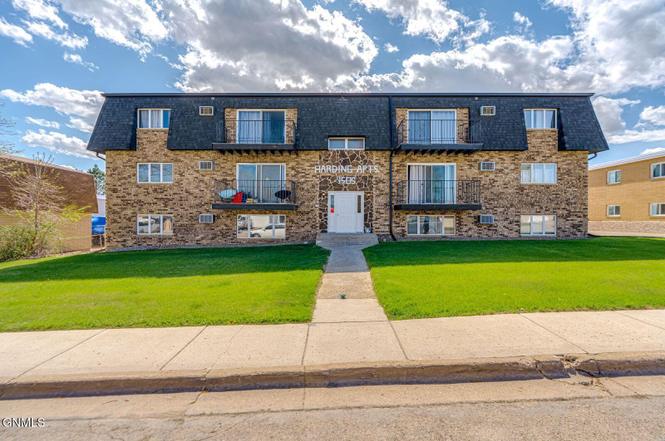
1505 9th Ave NW · Mandan, ND
Flood risk 1/10 · Minimal
- FEMA flood zone
- X (unshaded)
- Chance of flooding over 30 yrs
- 0.0%
- Est. flood insurance / yr
- $507 – $1,088
Fire risk 4/10 · Minor
- Est. fire insurance / yr
- $1,289 – $2,393
Heat risk 2/10 · Minimal
- Hot days now (above 96°F)
- 7 days/yr
- Hot days in 30 yrs
- 12 days/yr
Wind risk 2/10 · Minimal
- Chance of severe wind over 30 yrs
- —
Air-quality risk 4/10 · Minor
- Unhealthy air days now
- 4 days/yr
- Unhealthy air days in 30 yrs
- 4 days/yr
Risk factors via First Street. Map © Google.
Why this score? — see what drove the D- grade
The composite is a weighted blend of 9 inputs, each scored 0–100. Each bar is that input's sub-score; the figure is the points it added to the 100-point composite (weight × sub-score).
- Cash flow +11.5/30.0
- ARV discount +7.5/15.0
- Rent growth +5.0/5.0
- Livability +3.5/5.0
- DSCR +3.4/10.0
- 1% rule +3.3/10.0
- Schools +3.3/10.0
- Condition / age +2.5/5.0
- Appreciation +0.0/10.0
$1,100,000
🖨 Deal sheet 📄 Offer letter ✓ Due diligence
Multi-family units
County records classify this as Multi-Family (5+ Unit). Listing-text estimate: 8 units. confirmed
5+ unit building — per-unit beds/baths from public records are typically unavailable; the breakdown below (if shown) is an estimate from the listing text.
Key facts
- Units have balconies
- Single car garages
- All brick exterior
Tags
Property features AI
Exterior
- Parking: Detached garage; 12 garage spaces; Shared driveway; Off-street parking; Additional assigned parking
- Utilities: Public water; Public sewer; Sewer connected; Water connected; Electricity connected; Cable available
- Home design: Residential income property (multi-family); Three or more levels
- Construction: Brick construction; Concrete perimeter foundation
- Exterior features: Deck; Level lot; City street frontage; Asphalt road (public maintained)
Interior
- Kitchen: Dishwasher, Microwave, Oven, Refrigerator
- Flooring: Vinyl flooring; Carpet flooring
- Bathrooms: 12 full bathrooms
- Heating & cooling: Baseboard heating (electric); Wall/window cooling units
- Interior features: Finished full basement; Dishwasher, Microwave, Oven, Refrigerator
Neighborhood map
What this means for you Summary
Snapshot
- This is a 8 × 3-bed/1.5-bath units multifamily listed at $1.10M.
Deal economics
- At list price, monthly cash flow is $-365 ($-4k/yr) — negative. Per door: $-46/mo.
- To cash-flow at today's rent, offer at most $1.05M (4.8% below list).
- To meet the 1% rule (rent ≥ 1% of price), the offer needs to be $916k (16.7% below list).
- Recommended offer: $916k (16.7% below list) — sets the bar for 1% rule.
- Cap rate 5.9% vs local median 2.7% in Mandan — top-decile yield for the area; either an underpriced asset or a hidden risk that comps aren't pricing in. Stress-test before assuming the spread holds.
Location & tenants
- Location reads 70/100 on livability (#76 in ND) — a middle-class / working-renter tenant base. Strengths: cost of living A+, housing A+, employment A; Watch: crime C-, amenities F, commute F.
- Mandan 1 (suburban): math 35% / reading 38% proficiency, ranked #32 of 53 in ND (top 60%) — families likely to look elsewhere, expect single-tenant / working-renter base with shorter leases.
- Zoned schools: Mandan Middle School (math 36% / reading 40%, grade F, #21 of 35 statewide, top 59%, 928 students, 30% FRL); Mandan High School (math 18% / reading 42%, grade F, #90 of 144 statewide, top 66%, 1,138 students, 25% FRL) — zoned schools at 28% FRL track the district average.
- Market conditions: Rents rising fast (+14.0%/yr); 304 active listings in the ZIP; solid renter incomes; 94 units permitted in Morton County in 2024 (5 in 5+ unit buildings).
- At $9,161/mo this rent would consume 137% of the median local household income ($80k/yr) (locally 915% of renters already pay >50% of income on rent) — very limited rent-growth headroom before tenants either downsize or default.
Forward outlook
- Local home prices are declining (-3.0%/yr); year-one equity from $8k of loan paydown is wiped out by about $33k of value loss. Plan a longer hold.
- Morton County population projected at +48% by 2050 — long-run rental-demand tailwind backs the buy-and-hold thesis.
Negotiation context
- It's been on market 109 days — a 9% lower offer ($1.00M) is reasonable based on typical stale-listing flexibility.
- 4 sale attempts since 3y ago with the ask held roughly flat each time — persistent listings suggest the price (not the market) is what's stuck; bring a comps-based counter.
Questions for the listing agent
- What do current leases actually rent for vs. the listed asking? Can we see a recent rent roll and the last 12 months of T-12 income?
- It's been on market 109 days. Have you received any prior offers? Is the seller open to a 17% concession, seller financing, or rate buy-down credit?
- Can we see the unit-by-unit rent roll, current vacancy, and any below-market leases? What's the average tenancy length?
- What capital expenditures (roof, boiler, parking lot, exteriors) have been made in the last 5 years, and what's planned in the next 2?
- Built in 1977 — when were the roof, HVAC, electrical panel, plumbing, and water heater last replaced?
- Why hasn't it sold? Are there any deal-killer items the seller is aware of (foundation, flood, title, zoning, code violations)?
- Is there a deadline driving the sale (1031 exchange, divorce, estate, relocation)? That informs how much negotiation room exists.
- The area grade is low — what's the realistic commute time and amenity access for the typical tenant pool here? Any planned neighborhood developments (good or bad) we should know about?
- What's the average days-on-market for RENTAL listings here right now (not sales)? A rising rental-DOM trend means longer vacancies and softer asking-rent achievability than the comps imply.
- What's the recent tenant-quality profile in this submarket — average credit score on applications, eviction rate, late-payment / NSF rate, and stable-employment percentage? A property-management company in the area should have these aggregated.
- How much new apartment / multifamily construction is in the pipeline within 1–3 miles? Heavy new supply (>2% of stock underway) typically softens rents 12–24 months out; light construction supports rent growth.
Investment metrics
- 1% rule
- 0.83% ✗
- Cap rate
- 5.90%
- Cash-on-cash
- -1.42%
- DSCR
- 0.94
- GRM
- 10.0
CMA / ARV
No comps found within radius.
Projected returns pro-forma
-3.0% appreciation · 8.0% rent growth · sell at horizon
- IRR
- -13.2%
- Equity multiple
- 0.50×
- Total profit
- $-152,921
- Equity at exit
- $164,014
- IRR
- 2.2%
- Equity multiple
- 1.19×
- Total profit
- $57,845
- Equity at exit
- $95,108
Cash invested: $308,000 (down + closing). Projections, not guarantees.
Landlord ↔ Tenant lean methodology
- Overall (STATE)
- 82 Strongly Landlord-Friendly
- State North Dakota
- 82 Strongly Landlord-Friendly · R+20
- County
- — inherits STATE
- City
- — inherits STATE
ZIP-level market 58554
- Rents YoY
- 14.0%
- Active inventory
- 304
- Price-to-rent
- 80.1×
Monthly cashflow live
- Estimated rent
- $9,161 high interval (Pro) →
- Mortgage (P&I)
- −$5,769
- Tax est. 1.5%
- −$1,375 /mo · $16,500/yr
- Insurance
- −$458
- HOA
- −$0
- Vacancy / Maint / Mgmt
- −$1,924
- Net cashflow
- $-365
Break-even live
8-unit breakdown (identical units grouped — click to expand)
| Units | Beds | Baths | Est. rent |
|---|---|---|---|
| 8× units | 3 | 1.5 | $9,160 |
| #1 | 3 | 1.5 | $1,145 |
| #2 | 3 | 1.5 | $1,145 |
| #3 | 3 | 1.5 | $1,145 |
| #4 | 3 | 1.5 | $1,145 |
| #5 | 3 | 1.5 | $1,145 |
| #6 | 3 | 1.5 | $1,145 |
| #7 | 3 | 1.5 | $1,145 |
| #8 | 3 | 1.5 | $1,145 |
| Total (8 units) | $9,161 | ||
UW: 25.0% down · 7.5% · 30yr · 1.5% tax · 5.0% vac · 8.0% maint · 8.0% mgmt
Financing live
Cash to close
- Down payment
- $275,000
- Closing costs
- $33,000
- Reserves months
- —
- Total cash needed
- —
Loan-product check · same deal, 3 products live
Conventional
25% down · 7.5% · 30yr
- Down + closing
- —
- Monthly P&I
- —
- Monthly cashflow
- —
- DSCR
- —
- Eligible?
- —
Personal DTI + credit; lowest rate.
DSCR
20% down · 8.5% · 30yr
- Down + closing
- —
- Monthly P&I
- —
- Monthly cashflow
- —
- DSCR
- —
- Eligible?
- —
No personal income docs; deal must DSCR.
Hard money
10% down · 12.0% · 12mo
- Down + closing
- —
- Monthly P&I
- —
- Monthly cashflow
- —
- DSCR
- —
- Eligible?
- —
Short-term bridge; refi at stabilization.
Listing history 25 events
-
2026-06-19days on market $1,100,000 Active 109 DOM
-
2026-06-18days on market $1,100,000 Active 108 DOM
-
2026-06-17days on market $1,100,000 Active 107 DOM
-
2026-06-16days on market $1,100,000 Active 106 DOM
-
2026-06-15days on market $1,100,000 Active 105 DOM
-
2026-06-14days on market $1,100,000 Active 103 DOM
-
2026-06-13days on market $1,100,000 Active 102 DOM
-
2026-06-10days on market $1,100,000 Active 100 DOM
-
2026-06-09days on market $1,100,000 Active 99 DOM
-
2026-06-08days on market $1,100,000 Active 98 DOM
-
2026-06-07days on market $1,100,000 Active 97 DOM
-
2026-06-05days on market $1,100,000 Active 94 DOM
-
2026-06-03days on market $1,100,000 Active 93 DOM
-
2026-06-02days on market $1,100,000 Active 92 DOM
-
2026-06-01days on market $1,100,000 Active 91 DOM
-
2026-05-31days on market $1,100,000 Active 90 DOM
-
2026-05-30days on market $1,100,000 Active 89 DOM
-
2026-03-02$1,100,000 Active
-
2024-04-14historical $800
-
2024-04-12$800
-
2024-04-10historical $800
-
2024-03-28$800
-
2024-01-20historical $850
-
2023-12-15$850
-
2022-03-11price $750
ⓘ Source: listings_history table (triggers on properties + properties_extension) + one-shot
backfill from property_details.listing_events for pre-trigger history.
Climate risk First Street
- Flood 1/10 Low FEMA zone X (unshaded) · 0% chance over 30 yrs
- Wildfire 4/10 Moderate
- Heat 2/10 Low 7 d/yr ≥96°F today · 12 d/yr by 30 yrs out
- Wind 2/10 Low
- Air quality 4/10 Moderate 4 unhealthy d/yr today · 4 by 30 yrs out
Nearby sold comps map
Loading sold comps map…
Walkable amenities ~0.75 mi
Loading nearby amenities…
Taxation est. · year 1
- Rental income
- $109,932
- − Mortgage interest
- −$61,617
- − Property taxes
- −$16,500
- − Insurance
- −$5,500
- − Repairs & maintenance
- −$8,795
- − Management
- −$8,795
- − Depreciation
- −$32,000
- Taxable loss
- −$23,274
- Est. tax savings @ 24.0%
- +$5,586
- After-tax cash flow
- $1,210/yr
For passive investors: Depreciation is non-cash, so a rental often shows a tax loss while cash-flowing — sheltering income. Rental losses are passive: they offset passive income freely, and up to $25,000/yr can offset ordinary (W-2) income if you actively participate and your MAGI is under $100k (phasing out to $0 by $150k); unused losses carry forward. On sale, claimed depreciation is recaptured at up to 25%, and gains may owe capital-gains tax (a 1031 exchange can defer both). Figures are a year-1 estimate at your 24.0% rate — not tax advice; consult a CPA.
Schools (NCES district)
- District
- Mandan 1
- NCES district ID
- 3811820
- Math proficiency
- 35% ▼ -11.00%
- Reading proficiency
- 38% ▼ -5.00%
- Median HH income
- $60,131
- Composite
- 32.55/100
- National rank
- #5692
- State rank
- #32 of 53 in ND
Livability — Mandan
- Score
- 70/100
- State rank
- #76
- US rank
- #7567
Category grades
Schools grade is shown separately in the Schools card above.
Census & demographics
- Census place
- Mandan, ND
- County
- Morton County · 29,479 people
- City population
- 29,479
- Metro
- Bismarck, ND
- Population (ZIP)
- 29,479
- Household income
- $80,120
- Rent vs Own
- Severe rent burden
- 915.0
Population outlook (Morton County) Hauer SSP2
- Today (2025)
- 36,682 people
- By 2030
- 39,967 · +9.0%
- By 2040
- 46,921 · +27.9%
- By 2050
- 54,157 · +47.6%
- By 2075
- 73,661 · +100.8%
- By 2100
- 89,885 · +145.0%
Race, ethnicity, and origin ACS 2023
- Neighborhood character
- Predominantly White (87%)
- Race & ethnicity
- White 87% Hispanic / Latino 5% Native American 4% Two or more races 4% Black 2%
- Common ancestry
- Portuguese 14% Scotch-Irish 4% Iranian 2%
- Foreign-born
- 1% · Canada
- Languages at home
- 95% English-only · Spanish 3% German/W. Germanic 1%
Political lean MEDSL · Morton
- 2024 margin
- Solid R (+53.8) · D 22.2% · R 75.9% · Other 1.9%
- 2008→2024 swing
- -32.7pp toward R · 2008: -21.0pp · 2024: -53.8pp
- All cycles
- 2024: R+53.8 2020: R+50.4 2016: R+53.0 2012: R+31.1 2008: R+21.0
Not yet ingested
- Civics
- —
Market trends
- HPI YoY
- ▼ -161.81%
- Current HPI
- 137.8984
- Rent YoY
- ▲ 14.00%
- Metro
- Bismarck, ND
- State GDP YoY
- ▲ 2.09%
- F500 in state
- 2
Industry mix (Fortune 500 HQ in ND)
| Industry | F500 HQs | Revenue |
|---|---|---|
| Utilities / Construction | 1 | $6B |
|
||
Price history
8 events — show timeline
- 2026-03-02 Listed $1,100,000 GNMLS
- 2024-04-14 Rental Removed $800 APPFOLIO
- 2024-04-12 Listed for Rent $800 APPFOLIO
- 2024-04-10 Rental Removed $800 APPFOLIO
- 2024-03-28 Listed for Rent $800 APPFOLIO
- 2024-01-20 Rental Removed $850 APPFOLIO
- 2023-12-15 Listed for Rent $850 APPFOLIO
- 2022-03-11 Price Changed $750 APPFOLIO
Cash-flow waterfall
monthlySold comps — $/sqft
last 12 mo · ≤1 miLoading sold comps…