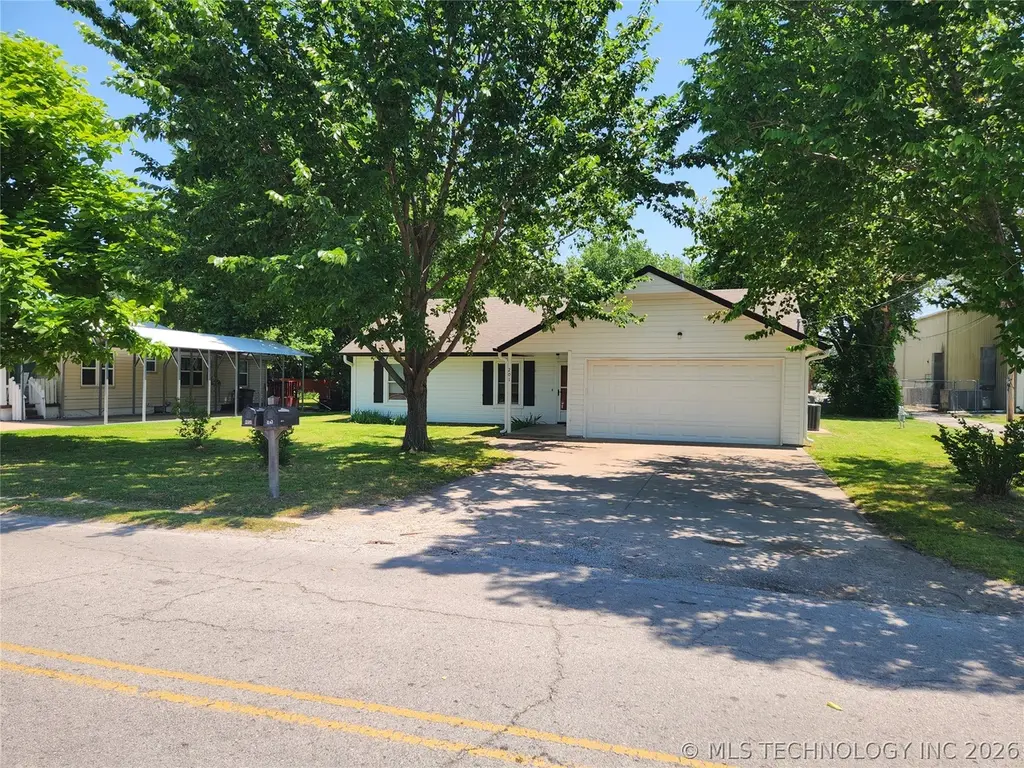
201 N 4th St · Sperry, OK
Flood risk 1/10 · Minimal
- FEMA flood zone
- X (unshaded)
- Chance of flooding over 30 yrs
- 0.0%
- Est. flood insurance / yr
- $507 – $1,088
Fire risk 7/10 · Major
- Est. fire insurance / yr
- $2,463 – $4,575
Heat risk 7/10 · Major
- Hot days now (above 110°F)
- 7 days/yr
- Hot days in 30 yrs
- 20 days/yr
Wind risk 3/10 · Minor
- Chance of severe wind over 30 yrs
- 4.0%
Air-quality risk 2/10 · Minimal
- Unhealthy air days now
- 1 days/yr
- Unhealthy air days in 30 yrs
- 2 days/yr
Risk factors via First Street. Map © Google.
Why this score? — see what drove the D grade
The composite is a weighted blend of 9 inputs, each scored 0–100. Each bar is that input's sub-score; the figure is the points it added to the 100-point composite (weight × sub-score).
- Cash flow +16.8/30.0
- Appreciation +9.0/10.0
- DSCR +5.2/10.0
- 1% rule +3.7/10.0
- Livability +2.7/5.0
- Rent growth +2.5/5.0
- Condition / age +2.5/5.0
- Schools +2.1/10.0
- ARV discount +0.0/15.0
$187,000
🖨 Deal sheet (PDF) 📄 Offer letter ✓ Due diligence
Listing remarks MLS
Very cute home with double pane windows, ceramic tile in kitchen, full bath in master, large walk-in closets. Walk to school, easy access to Tulsa.
Key facts
- Walkin closets
- Granite countertops
- 0.23 acre lot
Tags
Property features AI
Finance
- HOA & community: Sidewalks; Gutters in community
Exterior
- Parking: Attached garage with 2 parking spaces
- Security: No safety shelter
- Utilities: Public water; Public sewer; Electricity available; Natural gas available; Cable available; Phone available
- Home design: Single-story home; Faces west; Handicap access
- Construction: Masonite and wood frame construction; Asphalt/fiberglass roof; Slab foundation; Built per public records
- Exterior features: Covered patio and porch; Porch; Rain gutters
Interior
- Kitchen: Dishwasher; Disposal; Microwave; Oven; Range; Refrigerator; Granite counters
- Bedrooms: Multiple bedrooms with walk-in closets; Master bedroom with private bath and walk-in closet
- Flooring: Carpet; Tile; Vinyl
- Bathrooms: Two full bathrooms; Hall bath with bathtub; Master bath with bathtub
- Heating & cooling: Central heating (gas); Central air conditioning
- Interior features: Granite counters; Ceiling fan(s); Insulated windows; Vinyl windows; Insulated doors; Storm door(s); Electric oven and range connections; Gas oven and range connections
- Laundry & utility: Washer hookup; Electric dryer hookup; Gas dryer hookup; Gas water heater
Neighborhood map
What this means for you Summary
Snapshot
- This is a 3-bed/1.5-bath single-family listed at $187k.
Deal economics
- At list price, monthly cash flow is $119 ($1k/yr) — positive.
- The deal already cash-flows at list — no discount required.
- To meet the 1% rule (rent ≥ 1% of price), the offer needs to be $162k (13.4% below list).
- Recommended offer: $162k (13.4% below list) — sets the bar for 1% rule.
Location & tenants
- Location reads 54/100 on livability (#571 in OK) — a working-class tenant base; expect higher turnover. Strengths: cost of living A+, housing A+; Watch: crime F, amenities F, commute F.
- Sperry (rural): math 21% / reading 26% proficiency, ranked #114 of 270 in OK (top 42%) — low school quality limits family demand, transient renter base, plan for 1-2y turnover.
- Zoned schools: Sperry Es (math 30% / reading 31%, grade F, #247 of 845 statewide, top 30%, 520 students, 0% FRL); Sperry Ms (math 13% / reading 21%, grade F, #193 of 345 statewide, top 60%, 232 students, 0% FRL); Sperry Hs (math 15% / reading 24%, grade F, #274 of 447 statewide, top 66%, 329 students, 0% FRL) — zoned schools average 0% FRL vs 52% district-wide (52 pts lower); this property's tenant base skews higher-income than the district average.
- Market conditions: 62 active listings in the ZIP; 2,818 units permitted in Tulsa County in 2024 (518 in 5+ unit buildings).
Forward outlook
- In year one you build about $16k of equity ($1k loan paydown + $15k appreciation (7.9% local appreciation)).
- Tulsa County population projected at +30% by 2050 — long-run rental-demand tailwind backs the buy-and-hold thesis.
- At projected returns (7.9% appreciation + 3.0% rent growth), your $52k cash investment doubles in ~3 years — after that, you're playing with house money.
- By year 3, paydown + projected appreciation supports a ~$40k cash-out refi (75% LTV) — recoverable capital for the next deal without selling this one.
Negotiation context
- Only 4 days on market — expect competitive offers; lowballing is unlikely to land.
- 2 sale attempts since 25y ago with the ask held roughly flat each time — persistent listings suggest the price (not the market) is what's stuck; bring a comps-based counter.
- Current owner paid $100k; list at $187k implies a 87% gain — meaningful room to come down on a strong offer.
Risks & watch-outs
- Climate carrying-cost: major wildfire risk; extreme-heat days projected 7→20/yr by 2055 (HVAC capex compounding) — expect insurance premiums to compound above CPI over the hold.
Questions for the listing agent
- Is there a deadline driving the sale (1031 exchange, divorce, estate, relocation)? That informs how much negotiation room exists.
- Schools are D-rated, which usually means shorter tenancies and higher turnover. Who's the typical renter profile here, and what's been the actual vacancy rate?
- Crime grade is F in this area — have there been break-ins, vandalism, or insurance claims at this property in the last 3 years? What carrier currently insures it and at what premium?
- The area grade is low — what's the realistic commute time and amenity access for the typical tenant pool here? Any planned neighborhood developments (good or bad) we should know about?
- What's the average days-on-market for RENTAL listings here right now (not sales)? A rising rental-DOM trend means longer vacancies and softer asking-rent achievability than the comps imply.
- What's the recent tenant-quality profile in this submarket — average credit score on applications, eviction rate, late-payment / NSF rate, and stable-employment percentage? A property-management company in the area should have these aggregated.
- How much new for-sale + rental construction is in the pipeline within 1–3 miles? Heavy new supply typically softens prices + rents 12–24 months out; constrained supply supports both.
Investment metrics
- 1% rule
- 0.87% ✗
- Cap rate
- 7.06%
- Cash-on-cash
- 2.73%
- DSCR
- 1.12
- GRM
- 9.6
CMA / ARV
- ARV (on-the-fly)
- $144,039
- Comps found
- 8
Show comp detail 8 sales within ~0.75 mi
| Address | Dist | Beds/Ba | Sqft | Sold | Price | $/sf | Match |
|---|---|---|---|---|---|---|---|
| 202 W Carter St | 0.18mi | 2/2.0 (-1) | 1,069 (-1%) | 18mo | $170,000 | $159 | 67 |
| 108 N 1st St | 0.18mi | 2/1.0 (-1) | 1,128 (+4%) | 17mo | $124,900 | $111 | 64 |
| 207 N Elgin Ave | 0.58mi | 3/1.0 | 1,040 (-4%) | 1mo | $138,000 | $133 | 63 |
| 107 W Carter St | 0.24mi | 3/1.0 | 1,226 (+13%) | 2mo | $157,900 | $129 | 63 |
| 110 W Carter St | 0.21mi | 2/2.0 (-1) | 1,216 (+12%) | 1mo | $146,500 | $120 | 62 |
| 118 W Birch Pl | 0.35mi | 3/2.0 | 1,144 (+6%) | 18mo | $175,000 | $153 | 58 |
| 309 W Cherry St | 0.31mi | 2/1.0 (-1) | 1,224 (+13%) | 9mo | $125,000 | $102 | 50 |
| 410 S 1st St | 0.37mi | 3/2.0 | 1,238 (+14%) | 21mo | $180,900 | $146 | 39 |
Match score weights: distance 35% · size 25% · config 20% · recency 20%. Top-matched comps best support the ARV.
Projected returns pro-forma
7.92% appreciation · 3.0% rent growth · sell at horizon
- IRR
- 21.9%
- Equity multiple
- 2.60×
- Total profit
- $83,641
- Equity at exit
- $141,101
- IRR
- 20.1%
- Equity multiple
- 5.52×
- Total profit
- $236,900
- Equity at exit
- $279,164
Cash invested: $52,360 (down + closing). Projections, not guarantees.
Landlord ↔ Tenant lean methodology
- Overall (STATE)
- 83 Strongly Landlord-Friendly
- State Oklahoma
- 83 Strongly Landlord-Friendly · R+20
- County
- — inherits STATE
- City
- — inherits STATE
ZIP-level market 74073
- Home prices YoY
- 3.0%
- Active inventory
- 62
- Price-to-rent
- 9.6×
Monthly cashflow live
- Estimated rent
- $1,620 medium interval (Pro) →
- Mortgage (P&I)
- −$981
- Tax from tax record
- −$102 /mo · $1,227/yr
- Insurance
- −$78
- HOA
- −$0
- Vacancy / Maint / Mgmt
- −$340
- Net cashflow
- $119
Break-even live
Sensitivity live
| Price | -10% $225 | -5% $172 | +0% $119 | +5% $66 | +10% $13 |
|---|---|---|---|---|---|
| Rent | -10% $-9 | -5% $55 | +0% $119 | +5% $183 | +10% $247 |
| Rate | -1.0pp $213 | -0.5pp $166 | base $119 | +0.5pp $70 | +1.0pp $21 |
UW: 25.0% down · 7.5% · 30yr · 1.5% tax · 5.0% vac · 8.0% maint · 8.0% mgmt
Financing live
Cash to close
- Down payment
- $46,750
- Closing costs
- $5,610
- Reserves months
- —
- Total cash needed
- —
Loan-product check · same deal, 3 products live
Conventional
25% down · 7.5% · 30yr
- Down + closing
- —
- Monthly P&I
- —
- Monthly cashflow
- —
- DSCR
- —
- Eligible?
- —
Personal DTI + credit; lowest rate.
DSCR
20% down · 8.5% · 30yr
- Down + closing
- —
- Monthly P&I
- —
- Monthly cashflow
- —
- DSCR
- —
- Eligible?
- —
No personal income docs; deal must DSCR.
Hard money
10% down · 12.0% · 12mo
- Down + closing
- —
- Monthly P&I
- —
- Monthly cashflow
- —
- DSCR
- —
- Eligible?
- —
Short-term bridge; refi at stabilization.
Listing history 3 events
-
2026-06-08status $187,000 Pending 4 DOM
-
2026-06-07remarks 310-char remark
-
2026-06-07$187,000 Active 4 DOM
ⓘ Source: listings_history table (triggers on properties + properties_extension) + one-shot
backfill from property_details.listing_events for pre-trigger history.
Tax reassessment forecast OK · Resets to sale price
- Current annual tax
- $1,227 · $102/mo
- Projected year-2 tax
- $1,683 · $140/mo
- Expected delta
- +$456/yr (+$38/mo · 37.2%)
ⓘ Screening estimate from a state-policy table — verify with the county assessor before closing.
Climate risk First Street
- Flood 1/10 Low FEMA zone X (unshaded) · 0% chance over 30 yrs
- Wildfire 7/10 Severe
- Heat 7/10 Severe 7 d/yr ≥110°F today · 20 d/yr by 30 yrs out
- Wind 3/10 Moderate 4% chance of damaging wind over 30 yrs
- Air quality 2/10 Low 1 unhealthy d/yr today · 2 by 30 yrs out
Nearby sold comps map
Loading sold comps map…
Walkable amenities ~0.75 mi
Loading nearby amenities…
Taxation est. · year 1
- Rental income
- $19,439
- − Mortgage interest
- −$10,475
- − Property taxes
- −$1,227
- − Insurance
- −$935
- − Repairs & maintenance
- −$1,555
- − Management
- −$1,555
- − Depreciation
- −$5,440
- Taxable loss
- −$1,748
- Est. tax savings @ 24.0%
- +$420
- After-tax cash flow
- $1,847/yr
For passive investors: Depreciation is non-cash, so a rental often shows a tax loss while cash-flowing — sheltering income. Rental losses are passive: they offset passive income freely, and up to $25,000/yr can offset ordinary (W-2) income if you actively participate and your MAGI is under $100k (phasing out to $0 by $150k); unused losses carry forward. On sale, claimed depreciation is recaptured at up to 25%, and gains may owe capital-gains tax (a 1031 exchange can defer both). Figures are a year-1 estimate at your 24.0% rate — not tax advice; consult a CPA.
Schools (NCES district)
- District
- Sperry
- NCES district ID
- 4028170
- Math proficiency
- 21% ▼ -9.00%
- Reading proficiency
- 26% ▼ -10.00%
- Median HH income
- $52,187
- Composite
- 21.01/100
- National rank
- #8455
- State rank
- #114 of 270 in OK
Livability — Sperry
- Score
- 54/100
- State rank
- #571
- US rank
- #23756
Category grades
Schools grade is shown separately in the Schools card above.
Census & demographics
- Census place
- Sperry, OK
- Population (ZIP)
- 5,610
Population outlook (Tulsa County) Hauer SSP2
- Today (2025)
- 723,846 people
- By 2030
- 766,033 · +5.8%
- By 2040
- 851,386 · +17.6%
- By 2050
- 938,389 · +29.6%
- By 2075
- 1,166,011 · +61.1%
- By 2100
- 1,350,277 · +86.5%
Race, ethnicity, and origin ACS 2023
- Neighborhood character
- Predominantly White (67%)
- Race & ethnicity
- White 67% Two or more races 16% Native American 7% Hispanic / Latino 6% Asian 3% Black 2%
- Hispanic origin (detail)
- Mexican 5%
- Common ancestry
- Lithuanian 2% Slovak 2% Iranian 2%
- Foreign-born
- 2% · Canada
- Languages at home
- 93% English-only · Spanish 4% Other Asian/Pacific 2% Russian/Polish/Slavic 1%
Political lean MEDSL · Tulsa
- 2024 margin
- R (+15.2) · D 41.3% · R 56.5% · Other 2.2%
- 2008→2024 swing
- +9.2pp toward D · 2008: -24.5pp · 2024: -15.2pp
- All cycles
- 2024: R+15.2 2020: R+15.6 2016: R+22.9 2012: R+27.4 2008: R+24.5
Not yet ingested
- Civics
- —
Market trends
- HPI YoY
- ▲ 7.92%
- Current HPI
- 268.133
- Rent YoY
- —
- Metro
- —
- State GDP YoY
- ▲ 1.55%
- F500 in state
- 6
Industry mix (Fortune 500 HQ in OK)
| Industry | F500 HQs | Revenue |
|---|---|---|
| Energy | 3 | $48B |
|
||
Price history
+173.0% since first listed7 events — show timeline
- 2026-06-07 Pending — MLS Technology, Inc.
- 2026-06-03 Listed $187,000 MLS Technology, Inc.
- 2024-09-23 Sold (Public Records) $100,000 Public Records
- 2001-09-24 Sold (Public Records) $68,000 Public Records
- 2001-09-17 Sold (MLS) $67,800 MLS Technology, Inc.
- 2001-09-07 Listing Removed — MLS Technology, Inc.
- 2001-06-11 Listed $68,500 MLS Technology, Inc.
Property tax history
+4.9%/yrLatest (2025): $1,227 · +34.4% YoY. Source: county tax records.
Cash-flow waterfall
monthlySold comps — $/sqft
last 12 mo · ≤1 miLoading sold comps…