3199 Foxcroft Rd #215 · Miramar, FL
Flood risk 1/10 · Minimal
- FEMA flood zone
- X (shaded)
- Chance of flooding over 30 yrs
- 0.0%
- Est. flood insurance / yr
- $507 – $1,088
Fire risk 1/10 · Minimal
- Est. fire insurance / yr
- $947 – $1,759
Heat risk 10/10 · Severe
- Hot days now (above 106°F)
- 7 days/yr
- Hot days in 30 yrs
- 29 days/yr
Wind risk 10/10 · Severe
- Chance of severe wind over 30 yrs
- 99.0%
Air-quality risk 2/10 · Minimal
- Unhealthy air days now
- 2 days/yr
- Unhealthy air days in 30 yrs
- 2 days/yr
Risk factors via First Street. Map © Google.
Why this score? — see what drove the D grade
The composite is a weighted blend of 9 inputs, each scored 0–100. Each bar is that input's sub-score; the figure is the points it added to the 100-point composite (weight × sub-score).
- Cash flow +12.5/30.0
- ARV discount +7.5/15.0
- 1% rule +5.4/10.0
- Schools +4.1/10.0
- Livability +4.0/5.0
- DSCR +3.7/10.0
- Condition / age +2.5/5.0
- Rent growth +2.3/5.0
- Appreciation +0.0/10.0
$238,000
🖨 Deal sheet (PDF) 📄 Offer letter ✓ Due diligence
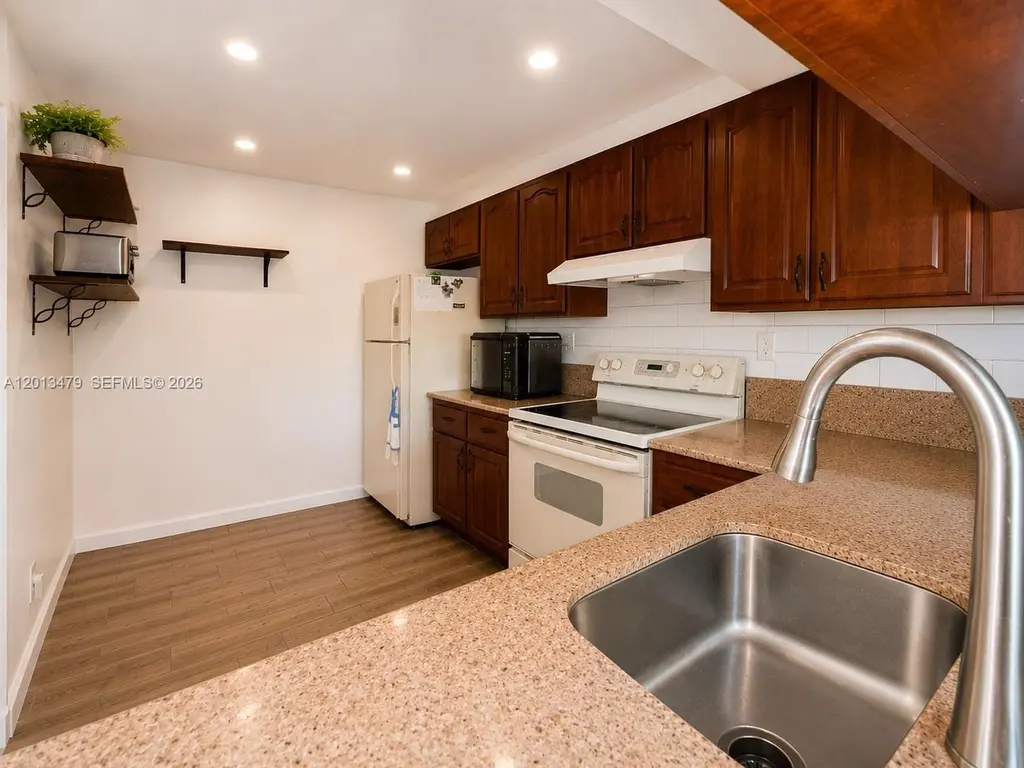
Listing remarks
Beautifully maintained second-floor 3-bedroom, 2-bath condo featuring warm wood-look tile flooring throughout, creating a cozy and inviting atmosphere. This bright and airy unit offers a spacious open-concept living and dining area perfect for entertaining and everyday living. Enjoy relaxing on the large screened patio complete with a convenient storage closet. The primary suite is privately situated on one side of the condo and features sliding glass doors leading to the patio, dual closets, and an en-suite bathroom. The fully remodeled second bathroom adds a modern touch, while the dated kitchen provides the perfect opportunity for the new owner to renovate and design it to their own tast
Key facts
- En suite bathroom
- Sliding glass doors
- Dual closets
Tags
Property features AI
Finance
- Financial info: Pets allowed with restrictions or possible restrictions
- HOA & community: Monthly association fee; Association fee includes insurance and grounds maintenance; Association amenities: pool, elevators
Exterior
- Parking: One parking space
- Utilities: Water included in association fee; Sewer included in association fee; Trash service included in association fee; Power available
- Home design: Attached property; 3 stories; Entry on level 2
- Construction: Block construction; Effective year built
- Exterior features: Balcony; Screened balcony; Storm/security shutters; Community pool
Interior
- Kitchen: Dishwasher; Electric range; Microwave; Disposal; Refrigerator
- Flooring: Ceramic tile
- Bathrooms: 2 full bathrooms
- Heating & cooling: Central heating; Central air conditioning
- Interior features: Bedroom on main level; Second-floor entry
- Laundry & utility: Washer; Dryer
Neighborhood map
What this means for you Summary
Snapshot
- This is a 3-bed/2.0-bath condo listed at $238k.
Deal economics
- At list price, monthly cash flow is $-36 ($-429/yr) — negative.
- To cash-flow at today's rent, offer at most $232k (2.7% below list).
- Meets the 1% rule at list price ($2k rent vs $238k).
- Recommended offer: $232k (2.7% below list) — sets the bar for cash-flow.
- Cap rate 6.1% vs local median 3.3% in Miramar — top-decile yield for the area; either an underpriced asset or a hidden risk that comps aren't pricing in. Stress-test before assuming the spread holds.
Location & tenants
- Location reads 80/100 on livability (#111 in FL, #1,721 nationally) — a professional / high-income tenant draw. Strengths: housing A+, health & safety A+, crime A; Watch: commute D+, cost of living D+, amenities D.
- Broward (suburban): math 42% / reading 53% proficiency, ranked #46 of 73 in FL (top 63%) — families likely to look elsewhere, expect single-tenant / working-renter base with shorter leases.
- Zoned schools: Sea Castle Elementary School (math 41% / reading 47%, grade F, #1,330 of 2,144 statewide, top 63%, 840 students, 76% FRL); Nova Middle School (math 44% / reading 53%, grade C-, #274 of 571 statewide, top 50%, 1,284 students, 68% FRL); Nova High School (math 22% / reading 56%, grade F, #312 of 667 statewide, top 48%, 2,227 students, 59% FRL) — zoned schools average 68% FRL vs 51% district-wide (17 pts higher); higher-poverty schools than district average — tighter screening recommended.
- Market conditions: Rents soft (-0.9%/yr); 447 active listings in the ZIP; 40 comparable units currently listed for rent nearby; rentals at typical pace (median 22d on market — plan ~3-4 weeks tenant-placement turnaround); 2,111 units permitted in Broward County in 2024 (1,265 in 5+ unit buildings).
- This rent runs 43% of the median local income ($69k/yr) — at the standard rent-burdened threshold; future hikes will face affordability resistance.
Forward outlook
- Local home prices are declining (-3.0%/yr); year-one equity from $2k of loan paydown is wiped out by about $7k of value loss. Plan a longer hold.
- Broward County population projected at +34% by 2050 — long-run rental-demand tailwind backs the buy-and-hold thesis.
Negotiation context
- It's been on market 15 days — a 2% lower offer ($234k) is reasonable based on typical stale-listing flexibility.
- Current owner paid $60k; list at $238k implies a 297% gain — meaningful room to come down on a strong offer.
Risks & watch-outs
- Climate carrying-cost: severe wind risk, 99% chance of damaging wind over 30y; extreme-heat days projected 7→29/yr by 2055 (HVAC capex compounding) — expect insurance premiums to compound above CPI over the hold.
Questions for the listing agent
- What do current leases actually rent for vs. the listed asking? Can we see a recent rent roll and the last 12 months of T-12 income?
- What does the HOA fee cover, when was the last increase, and are there any pending special assessments or reserve-fund shortfalls?
- Any open or pending special assessments — roof, HVAC, plumbing, elevator, façade? What's the per-unit balance and payoff schedule, and is the seller paying it off at close or rolling it to the buyer?
- Is there a deadline driving the sale (1031 exchange, divorce, estate, relocation)? That informs how much negotiation room exists.
- Schools are B-rated — typically a magnet for longer-tenancy family renters. What's the average tenant stay here, and is there a school-zone premium baked into asking?
- The area grade is low — what's the realistic commute time and amenity access for the typical tenant pool here? Any planned neighborhood developments (good or bad) we should know about?
- What's the average days-on-market for RENTAL listings here right now (not sales)? A rising rental-DOM trend means longer vacancies and softer asking-rent achievability than the comps imply.
- What's the recent tenant-quality profile in this submarket — average credit score on applications, eviction rate, late-payment / NSF rate, and stable-employment percentage? A property-management company in the area should have these aggregated.
- How much new apartment / multifamily construction is in the pipeline within 1–3 miles? Heavy new supply (>2% of stock underway) typically softens rents 12–24 months out; light construction supports rent growth.
Investment metrics
- 1% rule
- 1.04% ✓
- Cap rate
- 6.11%
- Cash-on-cash
- -0.64%
- DSCR
- 0.97
- GRM
- 8.0
CMA / ARV
No comps found within radius.
Projected returns pro-forma
-3.0% appreciation · 0.0% rent growth · sell at horizon
- IRR
- -21.4%
- Equity multiple
- 0.28×
- Total profit
- $-47,843
- Equity at exit
- $35,487
- IRR
- -27.2%
- Equity multiple
- -0.07×
- Total profit
- $-71,592
- Equity at exit
- $20,578
Cash invested: $66,640 (down + closing). Projections, not guarantees.
Landlord ↔ Tenant lean methodology
- Overall (STATE)
- 87 Strongly Landlord-Friendly
- State Florida
- 87 Strongly Landlord-Friendly · R+3
- County
- — inherits STATE
- City
- — inherits STATE
ZIP-level market 33025
- Rents YoY
- -0.9%
- Active inventory
- 447
- Price-to-rent
- 8.0×
Monthly cashflow live
- Estimated rent
- $2,473 high interval (Pro) →
- Mortgage (P&I)
- −$1,248
- Tax from tax record
- −$235 /mo · $2,823/yr
- Insurance
- −$99
- HOA
- −$407
- Lot rent
- −$0
- Vacancy / Maint / Mgmt
- −$519
- Net cashflow
- $-36
Break-even live
Sensitivity live
| Price | -10% $99 | -5% $32 | +0% $-36 | +5% $-103 | +10% $-171 |
|---|---|---|---|---|---|
| Rent | -10% $-231 | -5% $-133 | +0% $-36 | +5% $62 | +10% $160 |
| Rate | -1.0pp $84 | -0.5pp $25 | base $-36 | +0.5pp $-97 | +1.0pp $-160 |
UW: 25.0% down · 7.5% · 30yr · 1.5% tax · 5.0% vac · 8.0% maint · 8.0% mgmt
Financing live
Cash to close
- Down payment
- $59,500
- Closing costs
- $7,140
- Reserves months
- —
- Total cash needed
- —
Loan-product check · same deal, 3 products live
Conventional
25% down · 7.5% · 30yr
- Down + closing
- —
- Monthly P&I
- —
- Monthly cashflow
- —
- DSCR
- —
- Eligible?
- —
Personal DTI + credit; lowest rate.
DSCR
20% down · 8.5% · 30yr
- Down + closing
- —
- Monthly P&I
- —
- Monthly cashflow
- —
- DSCR
- —
- Eligible?
- —
No personal income docs; deal must DSCR.
Hard money
10% down · 12.0% · 12mo
- Down + closing
- —
- Monthly P&I
- —
- Monthly cashflow
- —
- DSCR
- —
- Eligible?
- —
Short-term bridge; refi at stabilization.
Rent comps 40 comps
| Address | Beds | Baths | Sqft | Rent | $/sqft | DOM | Units | Dist |
|---|---|---|---|---|---|---|---|---|
| 3199 Foxcroft Rd #311 Miramar, FL | 2.0 | 2.0 | 820 | $1,995 | $2.43 | 26d | 1 | 0.03mi |
| 3252 Foxcroft Rd Miramar, FL | 1.0–2.0 | 1.5–2.0 | 795 | $2,150 | $2.70 | 1d | 2 | 0.04mi |
| 3399 Foxcroft Rd #208 Miramar, FL | 2.0 | 2.0 | 820 | $2,100 | $2.56 | 20d | 1 | 0.04mi |
| 3399 Foxcroft Rd Miramar, FL | 2.0 | 2.0 | 820 | $2,000 | $2.44 | 10d | 2 | 0.04mi |
| 3396 Foxcroft Rd #310 Miramar, FL | 2.0 | 2.0 | 820 | $2,000 | $2.44 | 26d | 1 | 0.08mi |
| 3253 Foxcroft Rd Unit 210 Miramar, FL | 2.0 | 2.0 | 1040 | $2,000 | $1.92 | 20d | 1 | 0.09mi |
| 3410 Foxcroft Rd #206 Miramar, FL | 2.0 | 2.0 | 820 | $1,950 | $2.38 | 26d | 1 | 0.11mi |
| 3400 Foxcroft Rd #209 Miramar, FL | 2.0 | 2.0 | 820 | $2,100 | $2.56 | 26d | 1 | 0.11mi |
| 3470 Foxcroft Rd #207 Miramar, FL | 2.0 | 2.0 | 820 | $2,275 | $2.77 | 21d | 1 | 0.37mi |
| 9680 W Elm Ln Miramar, FL | 4.0 | 2.0 | 1218 | $3,700 | $3.04 | 26d | 1 | 0.40mi |
| 9761 W Heather Ln Miramar, FL | 3.0 | 2.0 | 971 | $2,550 | $2.63 | 10d | 1 | 0.46mi |
| 9761 W Heather Ln Miramar, FL | 3.0 | 2.0 | 971 | $2,550 | $2.63 | 13d | 1 | 0.46mi |
| 8660 Beekman Dr Miramar, FL | 3.0 | 2.0 | 1400 | $3,200 | $2.29 | 22d | 1 | 0.53mi |
| 8880 SW 23rd St Miramar, FL | 3.0 | 2.0 | 1359 | $3,650 | $2.69 | 26d | 1 | 0.62mi |
| 2400 SW 87th Way Miramar, FL | 3.0 | 2.5 | 1430 | $3,100 | $2.17 | 26d | 1 | 0.68mi |
| 9012 SW 20th Pl Miramar, FL | 3.0 | 2.0 | 1498 | $3,200 | $2.14 | 26d | 1 | 0.76mi |
| 2130 SW 87th Way Miramar, FL | 2.0 | 2.5 | 1270 | $2,700 | $2.13 | 1d | 1 | 0.77mi |
| 8664 SW 22nd Ct Miramar, FL | 3.0 | 2.5 | 1390 | $3,300 | $2.37 | 16d | 1 | 0.77mi |
| 8664 SW 22nd Ct Miramar, FL | 3.0 | 2.5 | 1390 | $3,300 | $2.37 | 23d | 1 | 0.77mi |
| 8572 SW 23rd Ct Miramar, FL | 3.0 | 2.5 | 1500 | $3,250 | $2.17 | 19d | 1 | 0.79mi |
| 8572 SW 23rd Ct Miramar, FL | 3.0 | 2.5 | 1500 | $3,000 | $2.00 | 1d | 1 | 0.79mi |
| 2451 SW 85th Ter Unit 2451 Miramar, FL | 2.0 | 2.0 | 1384 | $3,150 | $2.28 | 26d | 1 | 0.82mi |
| 10012 SW 23rd St Miramar, FL | 2.0 | 2.5 | 1296 | $2,650 | $2.04 | 19d | 1 | 0.85mi |
| 10012 SW 23rd St Miramar, FL | 2.0 | 2.5 | 1296 | $2,650 | $2.04 | 17d | 1 | 0.85mi |
| 8375 SW 29th St #102 Miramar, FL | 3.0 | 2.5 | 1450 | $2,850 | $1.97 | 1d | 1 | 0.86mi |
| 8375 SW 29th St Miramar, FL | 3.0 | 2.5 | 1450 | $2,850 | $1.97 | 21d | 1 | 0.86mi |
| 8720 N Sherman Cir #205 Miramar, FL | 2.0 | 1.0 | 832 | $1,800 | $2.16 | 26d | 1 | 0.87mi |
| 8931 SW 18th St #401 Miramar, FL | 3.0 | 2.5 | 1260 | $2,850 | $2.26 | 26d | 1 | 0.88mi |
| 8931 SW 18th St #401 Miramar, FL | 3.0 | 2.5 | 1260 | $2,800 | $2.22 | 4d | 1 | 0.88mi |
| 2830 SW 83rd Ter #101 Miramar, FL | 3.0 | 2.5 | 1450 | $3,050 | $2.10 | 26d | 1 | 0.89mi |
| 8730 N Sherman Cir #107 Miramar, FL | 2.0 | 2.0 | 891 | $2,000 | $2.24 | 26d | 1 | 0.89mi |
| 2764 SW 83rd Ter Unit 106 Miramar, FL | 3.0 | 2.5 | 1306 | $2,850 | $2.18 | 26d | 1 | 0.90mi |
| 1820 SW 89th Ter Miramar, FL | 2.0 | 2.5 | 1120 | $2,800 | $2.50 | 6d | 1 | 0.90mi |
| 1820 SW 89th Ter Miramar, FL | 2.0 | 2.5 | 1120 | $2,800 | $2.50 | 5d | 1 | 0.90mi |
| 8750 N Sherman Cir Miramar, FL | 2.0 | 2.0 | 832 | $2,075 | $2.49 | 26d | 2 | 0.92mi |
| 8750 N Sherman Cir Miramar, FL | 2.0 | 2.0 | 832 | $2,175 | $2.61 | 1d | 1 | 0.92mi |
| 8750 N Sherman Cir Miramar, FL | 2.0 | 2.0 | 832 | $2,125 | $2.55 | 5d | 2 | 0.92mi |
| 8915 SW 18th St Miramar, FL | 2.0 | 2.5 | 1120 | $2,650 | $2.37 | 26d | 1 | 0.93mi |
| 8740 N Sherman Cir #206 Miramar, FL | 2.0 | 2.0 | 832 | $2,000 | $2.40 | 26d | 1 | 0.93mi |
| 2677 SW 83rd Ter #102 Miramar, FL | 3.0 | 2.5 | 1450 | $3,100 | $2.14 | 26d | 1 | 0.94mi |
HOA detail condo
- Monthly dues
- $407 · $4,884/yr
- Assessments
- None detected in remarks — confirm with the listing agent.
Listing history 4 events
-
2026-05-14$238,000 Active
-
1998-12-18soldstatus $60,000
-
1984-09-01soldstatus $44,900
-
1984-09-01soldstatus $44,900
ⓘ Source: listings_history table (triggers on properties + properties_extension) + one-shot
backfill from property_details.listing_events for pre-trigger history.
Tax reassessment forecast FL · Resets to sale price
- Current annual tax
- $2,823 · $235/mo
- Projected year-2 tax
- $2,823 · $235/mo
- Expected delta
- $0/yr ($0/mo · 0.0%)
ⓘ Screening estimate from a state-policy table — verify with the county assessor before closing.
Climate risk First Street
- Flood 1/10 Low FEMA zone X (shaded) · 0% chance over 30 yrs
- Wildfire 1/10 Low
- Heat 10/10 Extreme 7 d/yr ≥106°F today · 29 d/yr by 30 yrs out
- Wind 10/10 Extreme 99% chance of damaging wind over 30 yrs
- Air quality 2/10 Low 2 unhealthy d/yr today · 2 by 30 yrs out
Nearby sold comps map
Loading sold comps map…
Walkable amenities ~0.75 mi
Loading nearby amenities…
Taxation est. · year 1
- Rental income
- $29,676
- − Mortgage interest
- −$13,332
- − Property taxes
- −$2,823
- − Insurance
- −$1,190
- − Repairs & maintenance
- −$2,374
- − Management
- −$2,374
- − HOA
- −$4,884
- − Depreciation
- −$6,924
- Taxable loss
- −$4,224
- Est. tax savings @ 24.0%
- +$1,014
- After-tax cash flow
- $584/yr
For passive investors: Depreciation is non-cash, so a rental often shows a tax loss while cash-flowing — sheltering income. Rental losses are passive: they offset passive income freely, and up to $25,000/yr can offset ordinary (W-2) income if you actively participate and your MAGI is under $100k (phasing out to $0 by $150k); unused losses carry forward. On sale, claimed depreciation is recaptured at up to 25%, and gains may owe capital-gains tax (a 1031 exchange can defer both). Figures are a year-1 estimate at your 24.0% rate — not tax advice; consult a CPA.
Schools (NCES district)
- District
- Broward
- NCES district ID
- 1200180
- Math proficiency
- 42% ▼ -18.00%
- Reading proficiency
- 53% ▼ -5.00%
- Median HH income
- $52,139
- Composite
- 40.88/100
- National rank
- #3621
- State rank
- #46 of 73 in FL
Livability — Miramar
- Score
- 80/100
- State rank
- #111
- US rank
- #1721
Category grades
Schools grade is shown separately in the Schools card above.
Census & demographics
- Census place
- Miramar, FL
- County
- Broward County · 1,963,430 people
- City population
- 214,427
- Metro
- Miami-Fort Lauderdale-Pompano Beach, FL
- Population (ZIP)
- 76,967
- Household income
- $68,743
- Rent vs Own
- Severe rent burden
- 4834.0
Population outlook (Broward County) Hauer SSP2
- Today (2025)
- 2,207,033 people
- By 2030
- 2,360,704 · +7.0%
- By 2040
- 2,661,208 · +20.6%
- By 2050
- 2,946,698 · +33.5%
- By 2075
- 3,602,273 · +63.2%
- By 2100
- 3,970,984 · +79.9%
Race, ethnicity, and origin ACS 2023
- Neighborhood character
- Diverse neighborhood (Simpson 0.64)
- Race & ethnicity
- Black 44% Hispanic / Latino 39% Two or more races 18% White 11% Asian 3%
- Hispanic origin (detail)
- Puerto Rican 4% Cuban 11% Dominican 3% Salvadoran 1%
- Common ancestry
- Hispanic 8% Italian 1%
- Foreign-born
- 38% · Canada, Jamaica, Dominican Republic
- Languages at home
- 54% English-only · Spanish 35% French/Haitian/Cajun 7% Other Indo-European 1%
Political lean MEDSL · Broward
- 2024 margin
- D (+17.0) · D 58.0% · R 41.0%
- 2008→2024 swing
- -17.8pp toward R · 2008: 34.7pp · 2024: 17.0pp
- All cycles
- 2024: D+17.0 2020: D+29.8 2016: D+35.0 2012: D+34.9 2008: D+34.7
Not yet ingested
- Civics
- —
Market trends
- HPI YoY
- ▼ -246.93%
- Current HPI
- 416.2123
- Rent YoY
- ▼ -0.92%
- Metro
- Miami-Fort Lauderdale-Pompano Beach, FL
- State GDP YoY
- ▲ 3.28%
- F500 in state
- 36
Industry mix (Fortune 500 HQ in FL)
| Industry | F500 HQs | Revenue |
|---|---|---|
| Industrial Technology | 2 | $29B |
|
||
| Insurance | 2 | $17B |
|
||
| Retail | 1 | $60B |
|
||
| Technology Distribution | 1 | $58B |
|
||
| Homebuilding | 1 | $35B |
|
||
| Technology Manufacturing | 1 | $35B |
|
||
Price history
+430.1% since first listed4 events — show timeline
- 2026-05-14 Listed $238,000 MARMLS
- 1998-12-18 Sold (Public Records) $60,000 Public Records
- 1984-09-01 Sold (Public Records) $44,900 Public Records
- 1984-09-01 Sold (Public Records) $44,900 Public Records
Property tax history
+25.8%/yrLatest (2025): $2,823 · +3.4% YoY. Source: county tax records.
Cash-flow waterfall
monthlySold comps — $/sqft
last 12 mo · ≤1 miLoading sold comps…