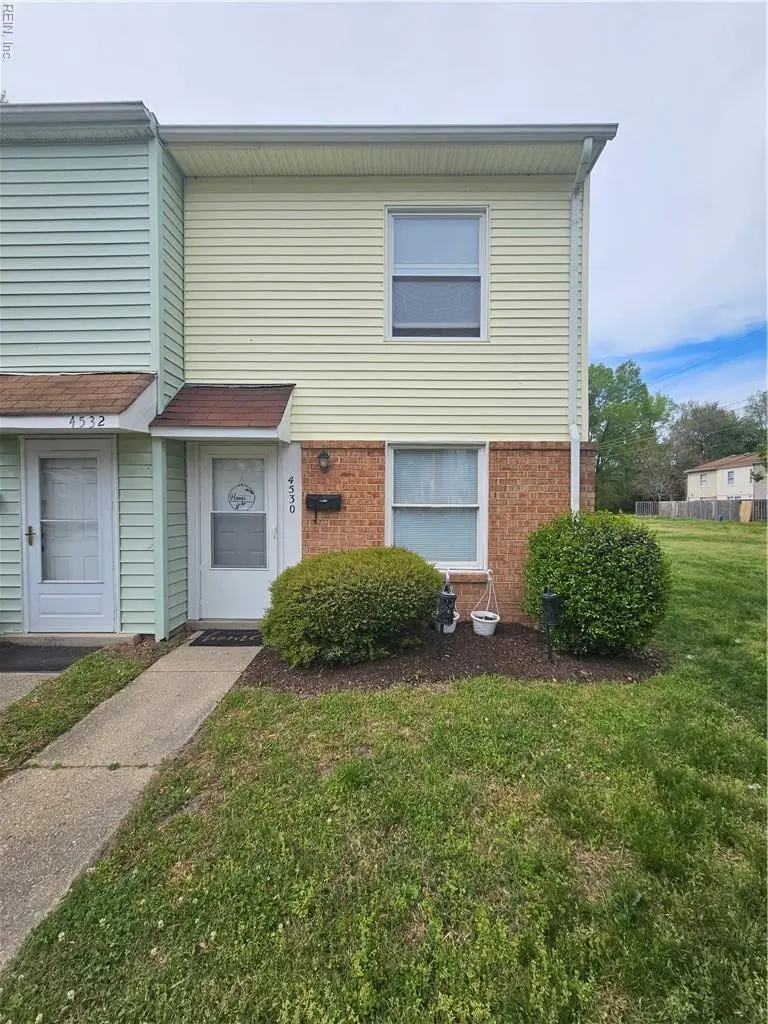
4530 Greenwood Dr · Portsmouth, VA
Flood risk 1/10 · Minimal
- FEMA flood zone
- X (unshaded)
- Chance of flooding over 30 yrs
- 0.0%
- Est. flood insurance / yr
- $507 – $1,088
Fire risk 1/10 · Minimal
- Est. fire insurance / yr
- $666 – $1,236
Heat risk 9/10 · Severe
- Hot days now (above 106°F)
- 7 days/yr
- Hot days in 30 yrs
- 16 days/yr
Wind risk 8/10 · Major
- Chance of severe wind over 30 yrs
- 80.0%
Air-quality risk 2/10 · Minimal
- Unhealthy air days now
- 2 days/yr
- Unhealthy air days in 30 yrs
- 2 days/yr
Risk factors via First Street. Map © Google.
Why this score? — see what drove the C grade
The composite is a weighted blend of 9 inputs, each scored 0–100. Each bar is that input's sub-score; the figure is the points it added to the 100-point composite (weight × sub-score).
- Cash flow +19.5/30.0
- 1% rule +7.7/10.0
- ARV discount +7.5/15.0
- DSCR +6.2/10.0
- Rent growth +5.0/5.0
- Schools +3.9/10.0
- Livability +3.7/5.0
- Condition / age +2.5/5.0
- Appreciation +0.0/10.0
$123,000
🖨 Deal sheet 📄 Offer letter ✓ Due diligence
Listing remarks MLS
Very clean unit that is move in ready with new Kitchen appliances, new carpet and paint. Fenced in back yard near 264, rivers casino, and ship yard.
Key facts
- $306 HOA
- Built 1977
- Listed 43 days
Property features AI
Finance
- Other: City view
- HOA & community: Has HOA (Charlestowne Condominiums); Monthly POA/HOA fee of $306; Amenities include clubhouse, ground maintenance, trash pickup and water; Association managed by Association Management Advisors Group
Exterior
- Parking: Assigned/reserved parking
- Utilities: City/County water; City/County sewer; Electric water heater; Electric power
- Home design: Attached townhouse; 2 stories (2 living levels); Simple ownership
- Construction: Slab foundation; Asphalt shingle roof
- Exterior features: Brick and vinyl siding; Wood fence
Interior
- Kitchen: Elec Range; Dishwasher; Disposal; Refrigerator
- Bedrooms: No bedroom and full bathroom on the first floor; Total of 4 rooms
- Flooring: Carpet; Ceramic; Laminate
- Bathrooms: 1 full bathroom
- Heating & cooling: Electric heating; Central air conditioning
- Interior features: Carpet, ceramic and laminate flooring
- Laundry & utility: Washer and dryer present; Washer hookup; Dryer hookup
Neighborhood map
What this means for you Summary
Snapshot
- This is a 2-bed/1.0-bath condo listed at $123k.
Deal economics
- At list price, monthly cash flow is $139 ($2k/yr) — positive.
- The deal already cash-flows at list — no discount required.
- Meets the 1% rule at list price ($2k rent vs $123k).
- Recommended offer: $119k (3.0% below list) — sets the bar for market timing.
- Cap rate 7.7% vs local median 4.6% in Portsmouth — top-decile yield for the area; either an underpriced asset or a hidden risk that comps aren't pricing in. Stress-test before assuming the spread holds.
Location & tenants
- Location reads 73/100 on livability (#172 in VA) — a middle-class / working-renter tenant base. Strengths: amenities A+, cost of living A+, housing A+; Watch: employment C-, crime F, commute F.
- Portsmouth City Public School District (urban): math 34% / reading 58% proficiency, ranked #107 of 131 in VA (top 82%) — families likely to look elsewhere, expect single-tenant / working-renter base with shorter leases.
- Zoned schools: Hodges Manor Elementary (math 32% / reading 57%, grade F, #827 of 1,108 statewide, top 77%, 499 students, 100% FRL); I.C. Norcom High (math 39% / reading 58%, grade D, #301 of 319 statewide, top 95%, 1,043 students, 100% FRL) — zoned schools average 100% FRL vs 60% district-wide (40 pts higher); higher-poverty schools than district average — tighter screening recommended.
- Market conditions: Rents rising fast (+11.9%/yr); 167 active listings in the ZIP; 11 comparable units currently listed for rent nearby; rentals at typical pace (median 24d on market — plan ~3-4 weeks tenant-placement turnaround); 45% of comp listings sitting > 30 days — soft ceiling on asking rent; 300 units permitted in Portsmouth city in 2024 (112 in 5+ unit buildings).
Forward outlook
- Local home prices are declining (-3.0%/yr); year-one equity from $850 of loan paydown is wiped out by about $4k of value loss. Plan a longer hold.
- At projected returns (-3.0% appreciation + 8.0% rent growth), your $34k cash investment doubles in ~9 years — after that, you're playing with house money.
Negotiation context
- It's been on market 43 days — a 3% lower offer ($119k) is reasonable based on typical stale-listing flexibility.
- 6 sale attempts since 11y ago; this cycle's ask has dropped $7k (5%) from the opening price — seller is motivated, your offer sets the floor, not the list.
- Current owner paid $105k; 17% above their basis — modest negotiation headroom, anchor on the comps not their cost.
Risks & watch-outs
- Climate carrying-cost: severe wind risk, 80% chance of damaging wind over 30y; extreme-heat days projected 7→16/yr by 2055 (HVAC capex compounding) — expect insurance premiums to compound above CPI over the hold.
Questions for the listing agent
- It's been on market 43 days. Have you received any prior offers? Is the seller open to a 3% concession, seller financing, or rate buy-down credit?
- Built in 1977 — when were the roof, HVAC, electrical panel, plumbing, and water heater last replaced?
- What does the HOA fee cover, when was the last increase, and are there any pending special assessments or reserve-fund shortfalls?
- Any open or pending special assessments — roof, HVAC, plumbing, elevator, façade? What's the per-unit balance and payoff schedule, and is the seller paying it off at close or rolling it to the buyer?
- Is there a deadline driving the sale (1031 exchange, divorce, estate, relocation)? That informs how much negotiation room exists.
- Schools are B-rated — typically a magnet for longer-tenancy family renters. What's the average tenant stay here, and is there a school-zone premium baked into asking?
- Crime grade is F in this area — have there been break-ins, vandalism, or insurance claims at this property in the last 3 years? What carrier currently insures it and at what premium?
- What's the average days-on-market for RENTAL listings here right now (not sales)? A rising rental-DOM trend means longer vacancies and softer asking-rent achievability than the comps imply.
- What's the recent tenant-quality profile in this submarket — average credit score on applications, eviction rate, late-payment / NSF rate, and stable-employment percentage? A property-management company in the area should have these aggregated.
- How much new apartment / multifamily construction is in the pipeline within 1–3 miles? Heavy new supply (>2% of stock underway) typically softens rents 12–24 months out; light construction supports rent growth.
Investment metrics
- 1% rule
- 1.27% ✓
- Cap rate
- 7.65%
- Cash-on-cash
- 4.85%
- DSCR
- 1.22
- GRM
- 6.6
CMA / ARV
No comps found within radius.
Projected returns pro-forma
-3.0% appreciation · 8.0% rent growth · sell at horizon
- IRR
- -1.9%
- Equity multiple
- 0.92×
- Total profit
- $-2,669
- Equity at exit
- $18,340
- IRR
- 13.4%
- Equity multiple
- 2.37×
- Total profit
- $47,239
- Equity at exit
- $10,635
Cash invested: $34,440 (down + closing). Projections, not guarantees.
Landlord ↔ Tenant lean methodology
- Overall (STATE)
- 55 Moderately Landlord-Leaning
- State Virginia
- 55 Moderately Landlord-Leaning · D+2
- County
- — inherits STATE
- City
- — inherits STATE
ZIP-level market 23701
- Rents YoY
- 11.9%
- Active inventory
- 167
- Price-to-rent
- 6.6×
Monthly cashflow live
- Estimated rent
- $1,557 high interval (Pro) →
- Mortgage (P&I)
- −$645
- Tax from tax record
- −$89 /mo · $1,065/yr
- Insurance
- −$51
- HOA
- −$306
- Vacancy / Maint / Mgmt
- −$327
- Net cashflow
- $139
Break-even live
UW: 25.0% down · 7.5% · 30yr · 1.5% tax · 5.0% vac · 8.0% maint · 8.0% mgmt
Financing live
Cash to close
- Down payment
- $30,750
- Closing costs
- $3,690
- Reserves months
- —
- Total cash needed
- —
Loan-product check · same deal, 3 products live
Conventional
25% down · 7.5% · 30yr
- Down + closing
- —
- Monthly P&I
- —
- Monthly cashflow
- —
- DSCR
- —
- Eligible?
- —
Personal DTI + credit; lowest rate.
DSCR
20% down · 8.5% · 30yr
- Down + closing
- —
- Monthly P&I
- —
- Monthly cashflow
- —
- DSCR
- —
- Eligible?
- —
No personal income docs; deal must DSCR.
Hard money
10% down · 12.0% · 12mo
- Down + closing
- —
- Monthly P&I
- —
- Monthly cashflow
- —
- DSCR
- —
- Eligible?
- —
Short-term bridge; refi at stabilization.
Rent comps 11 comps
| Address | Beds | Baths | Sqft | Rent | $/sqft | DOM | Units | Dist |
|---|---|---|---|---|---|---|---|---|
| 4642 Greenwood Dr Portsmouth, VA | 2.0 | 1.0 | 946 | $1,550 | $1.64 | 43d | 1 | 0.06mi |
| 840 Lancer Dr Unit 615 Portsmouth, VA | 2.0 | 1.5 | 1002 | $1,288 | $1.29 | 23d | 1 | 0.55mi |
| 940 Chumley Rd Portsmouth, VA | 1.0 | 1.0 | 760 | $1,165 | $1.53 | 43d | 1 | 0.61mi |
| 200 Chowan Dr Portsmouth, VA | 1.0–2.0 | 1.0–2.0 | 737 | $1,600 | $2.17 | 2d | 8 | 0.74mi |
| 902 Liston Ln Portsmouth, VA | 3.0 | 1.0 | 1039 | $1,785 | $1.72 | 23d | 1 | 0.99mi |
| 1008 Cherokee Rd Portsmouth, VA | 1.0–2.0 | 1.0 | 835 | $1,345 | $1.61 | 43d | 1 | 1.05mi |
| 26 Byers Ave Portsmouth, VA | 2.0 | 1.0 | 1008 | $1,575 | $1.56 | 43d | 1 | 1.28mi |
| 804 City Park Ave Portsmouth, VA | 1.0 | 1.0 | 650 | $1,350 | $2.08 | 23d | 1 | 1.35mi |
| 816 Martin Ave Portsmouth, VA | 3.0 | 1.0 | 1100 | $2,195 | $2.00 | 3d | 1 | 1.35mi |
| 6 Harrower Ct Portsmouth, VA | 2.0 | 2.0 | 800 | $1,550 | $1.94 | 43d | 1 | 1.47mi |
| 13 Hedge Ln Unit I Portsmouth, VA | 2.0 | 1.5 | 816 | $1,275 | $1.56 | 7d | 1 | 1.49mi |
HOA detail condo
- Monthly dues
- $306 · $3,672/yr
- Assessments
- None detected in remarks — confirm with the listing agent.
Listing history 28 events
-
2026-06-18days on market $123,000 Active 43 DOM
-
2026-06-17days on market $123,000 Active 42 DOM
-
2026-06-16days on market $123,000 Active 41 DOM
-
2026-06-15days on market $123,000 Active 40 DOM
-
2026-06-13statusdays on market $123,000 Active 38 DOM
-
2026-06-10status $123,000 Active Under Contract 34 DOM
-
2026-06-09days on market $123,000 Active 34 DOM
-
2026-06-08days on market $123,000 Active 33 DOM
-
2026-06-07pricestatusdays on market $123,000 Active 32 DOM
-
2026-05-08status Under Contract
-
2026-04-15historical Active Under Contract
-
2026-04-06$130,000 Active
-
2025-09-09soldstatus $105,000
-
2025-09-08soldstatus $105,000 Sold 148-char remark
Show marketing remark (148 chars)
Very clean unit that is move in ready with new Kitchen appliances, new carpet and paint. Fenced in back yard near 264, rivers casino, and ship yard.
-
2025-09-04status Under Contract 148-char remark
Show marketing remark (148 chars)
Very clean unit that is move in ready with new Kitchen appliances, new carpet and paint. Fenced in back yard near 264, rivers casino, and ship yard.
-
2025-08-26historical Active Under Contract 148-char remark
Show marketing remark (148 chars)
Very clean unit that is move in ready with new Kitchen appliances, new carpet and paint. Fenced in back yard near 264, rivers casino, and ship yard.
-
2025-08-21$105,000 Active 148-char remark
Show marketing remark (148 chars)
Very clean unit that is move in ready with new Kitchen appliances, new carpet and paint. Fenced in back yard near 264, rivers casino, and ship yard.
-
2025-06-10historical
-
2025-05-19status Active
-
2025-05-14historical
-
2025-05-08$95,000 Active
-
2015-09-09soldstatus $27,600 Sold
-
2015-08-20status Under Contract
-
2015-08-11historical
-
2015-07-23status Active
-
2015-06-17status Under Contract
-
2015-06-10historical
-
2015-05-13$30,000 Active
ⓘ Source: listings_history table (triggers on properties + properties_extension) + one-shot
backfill from property_details.listing_events for pre-trigger history.
Tax reassessment forecast VA · Resets to sale price
- Current annual tax
- $1,065 · $89/mo
- Projected year-2 tax
- $1,065 · $89/mo
- Expected delta
- $0/yr ($0/mo · 0.0%)
ⓘ Screening estimate from a state-policy table — verify with the county assessor before closing.
Climate risk First Street
- Flood 1/10 Low FEMA zone X (unshaded) · 0% chance over 30 yrs
- Wildfire 1/10 Low
- Heat 9/10 Extreme 7 d/yr ≥106°F today · 16 d/yr by 30 yrs out
- Wind 8/10 Severe 80% chance of damaging wind over 30 yrs
- Air quality 2/10 Low 2 unhealthy d/yr today · 2 by 30 yrs out
Nearby sold comps map
Loading sold comps map…
Walkable amenities ~0.75 mi
Loading nearby amenities…
Taxation est. · year 1
- Rental income
- $18,686
- − Mortgage interest
- −$6,890
- − Property taxes
- −$1,065
- − Insurance
- −$615
- − Repairs & maintenance
- −$1,495
- − Management
- −$1,495
- − HOA
- −$3,672
- − Depreciation
- −$3,578
- Taxable loss
- −$124
- Est. tax savings @ 24.0%
- +$30
- After-tax cash flow
- $1,699/yr
For passive investors: Depreciation is non-cash, so a rental often shows a tax loss while cash-flowing — sheltering income. Rental losses are passive: they offset passive income freely, and up to $25,000/yr can offset ordinary (W-2) income if you actively participate and your MAGI is under $100k (phasing out to $0 by $150k); unused losses carry forward. On sale, claimed depreciation is recaptured at up to 25%, and gains may owe capital-gains tax (a 1031 exchange can defer both). Figures are a year-1 estimate at your 24.0% rate — not tax advice; consult a CPA.
Schools (NCES district)
- District
- Portsmouth City Public School District
- NCES district ID
- 5103000
- Math proficiency
- 34% ▼ -40.00%
- Reading proficiency
- 58% ▼ -12.00%
- Median HH income
- $46,152
- Composite
- 39.01/100
- National rank
- #4071
- State rank
- #107 of 131 in VA
Livability — Portsmouth
- Score
- 73/100
- State rank
- #172
- US rank
- #5381
Category grades
Schools grade is shown separately in the Schools card above.
Census & demographics
- Census place
- Portsmouth, VA
- County
- Portsmouth City · 96,366 people
- City population
- 96,366
- Metro
- Virginia Beach-Norfolk-Newport News, VA-NC
- Population (ZIP)
- 24,298
- Household income
- $62,349
- Rent vs Own
- Severe rent burden
- 580.0
Population outlook (Portsmouth County) Hauer SSP2
- Today (2025)
- 96,730 people
- By 2030
- 96,760 · +0.0%
- By 2040
- 96,573 · -0.2%
- By 2050
- 95,606 · -1.2%
- By 2075
- 93,579 · -3.3%
- By 2100
- 83,756 · -13.4%
Race, ethnicity, and origin ACS 2023
- Neighborhood character
- Diverse neighborhood (Simpson 0.58)
- Race & ethnicity
- Black 52% White 39% Two or more races 6% Hispanic / Latino 3%
- Common ancestry
- Italian 1% Romanian 1% Slovak 1%
- Foreign-born
- 2% · Canada
- Languages at home
- 96% English-only · Spanish 2%
Political lean MEDSL · Portsmouth
- 2024 margin
- Solid D (+38.6) · D 68.6% · R 30.0% · Other 1.4%
- 2008→2024 swing
- -0.7pp no change · 2008: 39.3pp · 2024: 38.6pp
- All cycles
- 2024: D+38.6 2020: D+40.8 2016: D+36.5 2012: D+39.6 2008: D+39.3
Not yet ingested
- Civics
- —
Market trends
- HPI YoY
- ▼ -218.96%
- Current HPI
- 310.8218
- Rent YoY
- ▲ 11.92%
- Metro
- Virginia Beach-Norfolk-Newport News, VA-NC
- State GDP YoY
- ▲ 2.40%
- F500 in state
- 50
Industry mix (Fortune 500 HQ in VA)
| Industry | F500 HQs | Revenue |
|---|---|---|
| Aerospace / Defense | 4 | $236B |
|
||
| Technology / Defense | 3 | $32B |
|
||
| Financial Services | 2 | $176B |
|
||
| Utilities | 2 | $27B |
|
||
| Insurance | 2 | $25B |
|
||
| Technology | 2 | $15B |
|
||
Price history
+333.3% since first listed19 events — show timeline
- 2026-05-08 Pending — REINMLS
- 2026-04-15 Contingent — REINMLS
- 2026-04-06 Listed $130,000 REINMLS
- 2025-09-09 Sold (Public Records) $105,000 Public Records
- 2025-09-08 Sold (MLS) $105,000 REINMLS
- 2025-09-04 Pending — REINMLS
- 2025-08-26 Contingent — REINMLS
- 2025-08-21 Listed $105,000 REINMLS
- 2025-06-10 Listing Removed — REINMLS
- 2025-05-19 Relisted — REINMLS
- 2025-05-14 Listing Removed — REINMLS
- 2025-05-08 Listed $95,000 REINMLS
- 2015-09-09 Sold (MLS) $27,600 REINMLS
- 2015-08-20 Pending — REINMLS
- 2015-08-11 Listing Removed — REINMLS
- 2015-07-23 Relisted — REINMLS
- 2015-06-17 Pending — REINMLS
- 2015-06-10 Listing Removed — REINMLS
- 2015-05-13 Listed $30,000 REINMLS
Property tax history
-2.4%/yrLatest (2025): $1,065 · +13.5% YoY. Source: county tax records.
Cash-flow waterfall
monthlySold comps — $/sqft
last 12 mo · ≤1 miLoading sold comps…