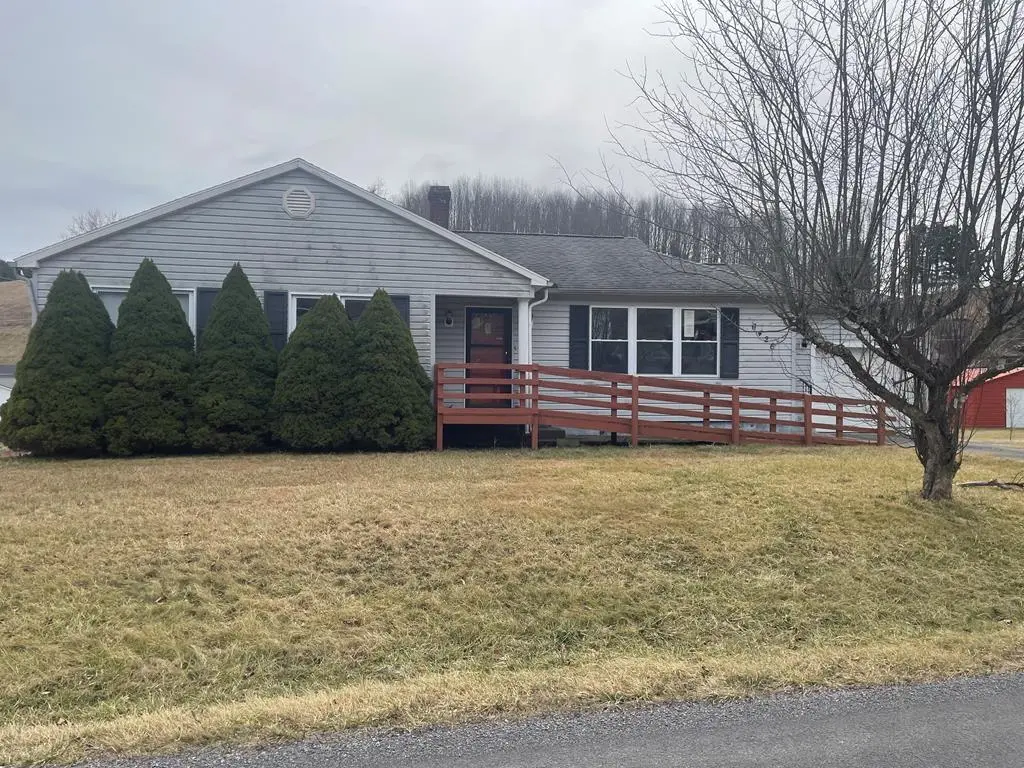
6426 Baptist Valley Rd · Tazewell, VA
Flood risk 1/10 · Minimal
- FEMA flood zone
- X (unshaded)
- Chance of flooding over 30 yrs
- 0.0%
- Est. flood insurance / yr
- $473 – $860
Fire risk 6/10 · Moderate
- Est. fire insurance / yr
- $666 – $1,236
Heat risk 3/10 · Minor
- Hot days now (above 92°F)
- 7 days/yr
- Hot days in 30 yrs
- 21 days/yr
Wind risk 2/10 · Minimal
- Chance of severe wind over 30 yrs
- 0.0%
Air-quality risk 1/10 · Minimal
- Unhealthy air days now
- 0 days/yr
- Unhealthy air days in 30 yrs
- 0 days/yr
Risk factors via First Street. Map © Google.
Why this score? — see what drove the C grade
The composite is a weighted blend of 9 inputs, each scored 0–100. Each bar is that input's sub-score; the figure is the points it added to the 100-point composite (weight × sub-score).
- Cash flow +15.7/30.0
- ARV discount +13.2/15.0
- Schools +6.0/10.0
- Appreciation +5.5/10.0
- DSCR +4.8/10.0
- 1% rule +3.3/10.0
- Livability +3.0/5.0
- Rent growth +2.5/5.0
- Condition / age +2.5/5.0
$134,900
🖨 Deal sheet 📄 Offer letter ✓ Due diligence
Listing remarks MLS
Vinyl siding rancher, built in 1968 on a nice level lot with three bedrooms, 1.5 baths, large living room, kitchen and dining combo area. Kitchen offers plenty of counter space and solid wood cabinetry plus a pantry. A full unfinished basement offers plenty of storage, a workshop area, and space for additional future living space. Basement can be accessed from both the inside and out. A one car attached garage and two storage buildings. Home is being sold AS IS.
Key facts
- Solid wood cabinetry
- Attached garage
- Workshop area
Tags
Neighborhood map
What this means for you Summary
Snapshot
- This is a 3-bed/1.5-bath single-family listed at $135k.
Deal economics
- At list price, monthly cash flow is $59 ($711/yr) — positive.
- The deal already cash-flows at list — no discount required.
- To meet the 1% rule (rent ≥ 1% of price), the offer needs to be $112k (17.3% below list).
- Recommended offer: $112k (17.3% below list) — sets the bar for 1% rule.
- Cap rate 6.8% vs local median 4.7% in Tazewell — top-decile yield for the area; either an underpriced asset or a hidden risk that comps aren't pricing in. Stress-test before assuming the spread holds.
Location & tenants
- Location reads 60/100 on livability (#458 in VA) — a middle-class / working-renter tenant base. Strengths: schools A+, cost of living A+, crime A; Watch: amenities F, commute F, employment F.
- Tazewell County Public School District (town): math 67% / reading 78% proficiency, ranked #21 of 131 in VA (top 16%) — strong family-tenant draw, lease renewals of 3-5y typical.
- Market conditions: 29 active listings in the ZIP; 4 units permitted in Tazewell County in 2024 (0 in 5+ unit buildings).
Forward outlook
- In year one you build about $2k of equity ($933 loan paydown + $1k appreciation (0.9% local appreciation)).
- Tazewell County population projected at -30% by 2050 — secular population decline; favor cash flow + early exit over multi-decade hold.
- At projected returns (0.9% appreciation + 3.0% rent growth), your $38k cash investment doubles in ~9 years — after that, you're playing with house money.
Negotiation context
- It's been on market 127 days — a 12% lower offer ($119k) is reasonable based on typical stale-listing flexibility.
- Current owner paid $115k; 17% above their basis — modest negotiation headroom, anchor on the comps not their cost.
Risks & watch-outs
- Climate carrying-cost: major wildfire risk — expect insurance premiums to compound above CPI over the hold.
Questions for the listing agent
- It's been on market 127 days. Have you received any prior offers? Is the seller open to a 17% concession, seller financing, or rate buy-down credit?
- Built in 1968 — when were the roof, HVAC, electrical panel, plumbing, and water heater last replaced?
- Why hasn't it sold? Are there any deal-killer items the seller is aware of (foundation, flood, title, zoning, code violations)?
- Is there a deadline driving the sale (1031 exchange, divorce, estate, relocation)? That informs how much negotiation room exists.
- Schools are A-rated — typically a magnet for longer-tenancy family renters. What's the average tenant stay here, and is there a school-zone premium baked into asking?
- What's the average days-on-market for RENTAL listings here right now (not sales)? A rising rental-DOM trend means longer vacancies and softer asking-rent achievability than the comps imply.
- What's the recent tenant-quality profile in this submarket — average credit score on applications, eviction rate, late-payment / NSF rate, and stable-employment percentage? A property-management company in the area should have these aggregated.
- How much new for-sale + rental construction is in the pipeline within 1–3 miles? Heavy new supply typically softens prices + rents 12–24 months out; constrained supply supports both.
Investment metrics
- 1% rule
- 0.83% ✗
- Cap rate
- 6.82%
- Cash-on-cash
- 1.88%
- DSCR
- 1.08
- GRM
- 10.1
CMA / ARV
- ARV (median comp)
- $154,507
- List price
- $134,900
- Delta
- -12.69%
- Verdict
- UNDERPRICED
- Comps
- 10 within 1.0 mi
Show comp detail 2 sales within ~0.75 mi
| Address | Dist | Beds/Ba | Sqft | Sold | Price | $/sf | Match |
|---|---|---|---|---|---|---|---|
| 6388 Baptist Valley Rd | 0.04mi | 3/2.0 | 1,649 (+2%) | 12mo | $155,000 | $94 | 83 |
| 7062 Baptist Valley Rd | 0.68mi | 3/2.0 | 1,440 (-11%) | 15mo | $150,000 | $104 | 35 |
Match score weights: distance 35% · size 25% · config 20% · recency 20%. Top-matched comps best support the ARV.
Projected returns pro-forma
0.92% appreciation · 3.0% rent growth · sell at horizon
- IRR
- 3.0%
- Equity multiple
- 1.15×
- Total profit
- $5,709
- Equity at exit
- $45,482
- IRR
- 7.5%
- Equity multiple
- 1.91×
- Total profit
- $34,298
- Equity at exit
- $60,004
Cash invested: $37,772 (down + closing). Projections, not guarantees.
Landlord ↔ Tenant lean methodology
- Overall (STATE)
- 55 Moderately Landlord-Leaning
- State Virginia
- 55 Moderately Landlord-Leaning · D+2
- County
- — inherits STATE
- City
- — inherits STATE
ZIP-level market 24630
- Home prices YoY
- 0.6%
- Active inventory
- 29
- Price-to-rent
- 10.1×
Monthly cashflow live
- Estimated rent
- $1,116 medium interval (Pro) →
- Mortgage (P&I)
- −$707
- Tax from tax record
- −$58 /mo · $701/yr
- Insurance
- −$56
- HOA
- −$0
- Vacancy / Maint / Mgmt
- −$234
- Net cashflow
- $59
Break-even live
UW: 25.0% down · 7.5% · 30yr · 1.5% tax · 5.0% vac · 8.0% maint · 8.0% mgmt
Financing live
Cash to close
- Down payment
- $33,725
- Closing costs
- $4,047
- Reserves months
- —
- Total cash needed
- —
Loan-product check · same deal, 3 products live
Conventional
25% down · 7.5% · 30yr
- Down + closing
- —
- Monthly P&I
- —
- Monthly cashflow
- —
- DSCR
- —
- Eligible?
- —
Personal DTI + credit; lowest rate.
DSCR
20% down · 8.5% · 30yr
- Down + closing
- —
- Monthly P&I
- —
- Monthly cashflow
- —
- DSCR
- —
- Eligible?
- —
No personal income docs; deal must DSCR.
Hard money
10% down · 12.0% · 12mo
- Down + closing
- —
- Monthly P&I
- —
- Monthly cashflow
- —
- DSCR
- —
- Eligible?
- —
Short-term bridge; refi at stabilization.
Listing history 18 events
-
2026-06-19days on market $134,900 Active 127 DOM
-
2026-06-18days on market $134,900 Active 126 DOM
-
2026-06-17days on market $134,900 Active 125 DOM
-
2026-06-16days on market $134,900 Active 124 DOM
-
2026-06-15days on market $134,900 Active 123 DOM
-
2026-06-14days on market $134,900 Active 121 DOM
-
2026-06-12pricedays on market $134,900 Active 120 DOM
-
2026-06-09days on market $144,800 Active 117 DOM
-
2026-06-08days on market $144,800 Active 116 DOM
-
2026-06-07days on market $144,800 Active 115 DOM
-
2026-06-03days on market $144,800 Active 111 DOM
-
2026-06-02days on market $144,800 Active 110 DOM
-
2026-06-01days on market $144,800 Active 109 DOM
-
2026-05-31days on market $144,800 Active 108 DOM
-
2026-05-30days on market $144,800 Active 107 DOM
-
2026-03-19soldstatus $114,900
-
2026-03-14price $144,800 466-char remark
Show marketing remark (466 chars)
Vinyl siding rancher, built in 1968 on a nice level lot with three bedrooms, 1.5 baths, large living room, kitchen and dining combo area. Kitchen offers plenty of counter space and solid wood cabinetry plus a pantry. A full unfinished basement offers plenty of storage, a workshop area, and space for additional future living space. Basement can be accessed from both the inside and out. A one car attached garage and two storage buildings. Home is being sold AS IS.
-
2026-02-12$149,900 Active 466-char remark
Show marketing remark (466 chars)
Vinyl siding rancher, built in 1968 on a nice level lot with three bedrooms, 1.5 baths, large living room, kitchen and dining combo area. Kitchen offers plenty of counter space and solid wood cabinetry plus a pantry. A full unfinished basement offers plenty of storage, a workshop area, and space for additional future living space. Basement can be accessed from both the inside and out. A one car attached garage and two storage buildings. Home is being sold AS IS.
ⓘ Source: listings_history table (triggers on properties + properties_extension) + one-shot
backfill from property_details.listing_events for pre-trigger history.
Tax reassessment forecast VA · Resets to sale price
- Current annual tax
- $701 · $58/mo
- Projected year-2 tax
- $1,106 · $92/mo
- Expected delta
- +$405/yr (+$34/mo · 57.8%)
ⓘ Screening estimate from a state-policy table — verify with the county assessor before closing.
Climate risk First Street
- Flood 1/10 Low FEMA zone X (unshaded) · 0% chance over 30 yrs
- Wildfire 6/10 Major
- Heat 3/10 Moderate 7 d/yr ≥92°F today · 21 d/yr by 30 yrs out
- Wind 2/10 Low 0% chance of damaging wind over 30 yrs
- Air quality 1/10 Low 0 unhealthy d/yr today · 0 by 30 yrs out
Nearby sold comps map
Loading sold comps map…
Walkable amenities ~0.75 mi
Loading nearby amenities…
Taxation est. · year 1
- Rental income
- $13,387
- − Mortgage interest
- −$7,556
- − Property taxes
- −$701
- − Insurance
- −$674
- − Repairs & maintenance
- −$1,071
- − Management
- −$1,071
- − Depreciation
- −$3,924
- Taxable loss
- −$1,611
- Est. tax savings @ 24.0%
- +$387
- After-tax cash flow
- $1,098/yr
For passive investors: Depreciation is non-cash, so a rental often shows a tax loss while cash-flowing — sheltering income. Rental losses are passive: they offset passive income freely, and up to $25,000/yr can offset ordinary (W-2) income if you actively participate and your MAGI is under $100k (phasing out to $0 by $150k); unused losses carry forward. On sale, claimed depreciation is recaptured at up to 25%, and gains may owe capital-gains tax (a 1031 exchange can defer both). Figures are a year-1 estimate at your 24.0% rate — not tax advice; consult a CPA.
Schools (NCES district)
- District
- Tazewell County Public School District
- NCES district ID
- 5103810
- Math proficiency
- 67% ▼ -23.00%
- Reading proficiency
- 78% ▼ -6.00%
- Median HH income
- $37,003
- Composite
- 60.16/100
- National rank
- #865
- State rank
- #21 of 131 in VA
Livability — Tazewell
- Score
- 60/100
- State rank
- #458
- US rank
- #19535
Category grades
Schools grade is shown separately in the Schools card above.
Census & demographics
- Population (ZIP)
- 5,920
Population outlook (Tazewell County) Hauer SSP2
- Today (2025)
- 38,275 people
- By 2030
- 35,719 · -6.7%
- By 2040
- 30,875 · -19.3%
- By 2050
- 26,798 · -30.0%
- By 2075
- 19,286 · -49.6%
- By 2100
- 13,631 · -64.4%
Race, ethnicity, and origin ACS 2023
- Neighborhood character
- Predominantly White (89%)
- Race & ethnicity
- White 89% Two or more races 5% Black 4% Asian 1%
- Common ancestry
- Serbian 1% Subsaharan African 1% Lithuanian 1%
- Foreign-born
- 1%
Political lean MEDSL · Tazewell
- 2024 margin
- Solid R (+68.9) · D 15.3% · R 84.2%
- 2008→2024 swing
- -36.0pp toward R · 2008: -32.9pp · 2024: -68.9pp
- All cycles
- 2024: R+68.9 2020: R+67.2 2016: R+66.3 2012: R+57.5 2008: R+32.9
Not yet ingested
- Civics
- —
Market trends
- HPI YoY
- ▲ 0.92%
- Current HPI
- 151.7146
- Rent YoY
- —
- Metro
- —
- State GDP YoY
- ▲ 2.40%
- F500 in state
- 50
Industry mix (Fortune 500 HQ in VA)
| Industry | F500 HQs | Revenue |
|---|---|---|
| Aerospace / Defense | 4 | $236B |
|
||
| Technology / Defense | 3 | $32B |
|
||
| Financial Services | 2 | $176B |
|
||
| Utilities | 2 | $27B |
|
||
| Insurance | 2 | $25B |
|
||
| Technology | 2 | $15B |
|
||
Price history
-23.3% since first listed3 events — show timeline
- 2026-03-19 Sold (Public Records) $114,900 Public Records
- 2026-03-14 Price Changed $144,800 SWVAR
- 2026-02-12 Listed $149,900 SWVAR
Property tax history
+3.4%/yrLatest (2025): $701 · +0.0% YoY. Source: county tax records.
Cash-flow waterfall
monthlySold comps — $/sqft
last 12 mo · ≤1 miLoading sold comps…