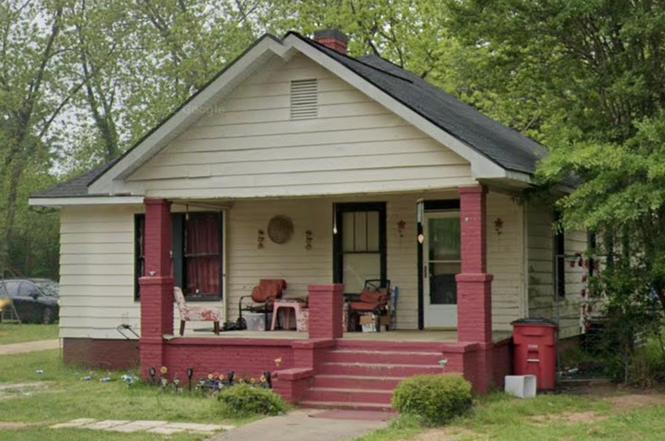
4235 Mikado Ave · Macon-Bibb County, GA
Flood risk 1/10 · Minimal
- FEMA flood zone
- X (unshaded)
- Chance of flooding over 30 yrs
- 0.0%
- Est. flood insurance / yr
- $507 – $1,088
Fire risk 2/10 · Minimal
- Est. fire insurance / yr
- $963 – $1,789
Heat risk 7/10 · Major
- Hot days now (above 109°F)
- 7 days/yr
- Hot days in 30 yrs
- 18 days/yr
Wind risk 6/10 · Moderate
- Chance of severe wind over 30 yrs
- 72.0%
Air-quality risk 3/10 · Minor
- Unhealthy air days now
- 3 days/yr
- Unhealthy air days in 30 yrs
- 4 days/yr
Risk factors via First Street. Map © Google.
Why this score? — see what drove the C+ grade
The composite is a weighted blend of 9 inputs, each scored 0–100. Each bar is that input's sub-score; the figure is the points it added to the 100-point composite (weight × sub-score).
- Cash flow +28.4/30.0
- DSCR +10.0/10.0
- ARV discount +7.5/15.0
- 1% rule +7.0/10.0
- Rent growth +3.8/5.0
- Livability +2.5/5.0
- Condition / age +2.5/5.0
- Schools +1.2/10.0
- Appreciation +0.0/10.0
$89,000
🖨 Deal sheet 📄 Offer letter ✓ Due diligence
Listing remarks
Great investment opportunity. Add this income producing property to your portfolio today! Contact your Realtor for more information.
Key facts
- 0.34 acre lot
- Built 1925
- Listed 74 days
Neighborhood map
What this means for you Summary
Snapshot
- This is a 2-bed/1.0-bath single-family listed at $89k.
Deal economics
- At list price, monthly cash flow is $288 ($3k/yr) — positive.
- The deal already cash-flows at list — no discount required.
- Meets the 1% rule at list price ($1k rent vs $89k).
- Recommended offer: $84k (6.0% below list) — sets the bar for market timing.
- Cap rate 10.2% vs local median 5.4% in Macon-Bibb County — top-decile yield for the area; either an underpriced asset or a hidden risk that comps aren't pricing in. Stress-test before assuming the spread holds.
Location & tenants
- Location reads: area grade C — affects rentability + tenant quality, not the cash-flow math above.
- Bibb County (urban): math 11% / reading 18% proficiency, ranked #161 of 174 in GA (top 92%) — low school quality limits family demand, transient renter base, plan for 1-2y turnover; 75% free/reduced lunch — lower-income household profile, screen leases tightly.
- Market conditions: Rents rising fast (+5.0%/yr); 207 active listings in the ZIP; 28 comparable units currently listed for rent nearby; rentals lingering (median 44d on market — plan ~5-8 weeks vacancy on turnover, expect pricing pressure); 64% of comp listings sitting > 30 days — soft ceiling on asking rent; lower-income renter base — watch delinquency; 154 units permitted in Bibb County in 2024 (0 in 5+ unit buildings).
- This rent runs 43% of the median local income ($30k/yr) — at the standard rent-burdened threshold; future hikes will face affordability resistance.
Forward outlook
- Local home prices are declining (-3.0%/yr); year-one equity from $615 of loan paydown is wiped out by about $3k of value loss. Plan a longer hold.
- Bibb County population projected at -12% by 2050 — secular population decline; favor cash flow + early exit over multi-decade hold.
- At projected returns (-3.0% appreciation + 5.0% rent growth), your $25k cash investment doubles in ~8 years — after that, you're playing with house money.
Negotiation context
- It's been on market 75 days — a 6% lower offer ($84k) is reasonable based on typical stale-listing flexibility.
- 2 sale attempts since 2y ago with the ask held roughly flat each time — persistent listings suggest the price (not the market) is what's stuck; bring a comps-based counter.
- Current owner paid $68k; 31% above their basis — modest negotiation headroom, anchor on the comps not their cost.
Risks & watch-outs
- Watch-outs: built in 1925 — expect roof / HVAC / electrical / plumbing capex.
- Climate carrying-cost: major wind risk, 72% chance of damaging wind over 30y; extreme-heat days projected 7→18/yr by 2055 (HVAC capex compounding) — expect insurance premiums to compound above CPI over the hold.
Questions for the listing agent
- It's been on market 75 days. Have you received any prior offers? Is the seller open to a 6% concession, seller financing, or rate buy-down credit?
- Built in 1925 — when were the roof, HVAC, electrical panel, plumbing, and water heater last replaced?
- Why hasn't it sold? Are there any deal-killer items the seller is aware of (foundation, flood, title, zoning, code violations)?
- Is there a deadline driving the sale (1031 exchange, divorce, estate, relocation)? That informs how much negotiation room exists.
- What's the average days-on-market for RENTAL listings here right now (not sales)? A rising rental-DOM trend means longer vacancies and softer asking-rent achievability than the comps imply.
- What's the recent tenant-quality profile in this submarket — average credit score on applications, eviction rate, late-payment / NSF rate, and stable-employment percentage? A property-management company in the area should have these aggregated.
- How much new for-sale + rental construction is in the pipeline within 1–3 miles? Heavy new supply typically softens prices + rents 12–24 months out; constrained supply supports both.
Investment metrics
- 1% rule
- 1.20% ✓
- Cap rate
- 10.17%
- Cash-on-cash
- 13.86%
- DSCR
- 1.62
- GRM
- 7.0
CMA / ARV
- ARV (on-the-fly)
- $47,520
- Comps found
- 12
Show comp detail 12 sales within ~0.75 mi
| Address | Dist | Beds/Ba | Sqft | Sold | Price | $/sf | Match |
|---|---|---|---|---|---|---|---|
| 4322 Mikado Ave | 0.16mi | 3/2.0 (+1) | 1,344 (+2%) | 5mo | $75,500 | $56 | 77 |
| 1205 Buena Vista Ave | 0.29mi | 3/1.0 (+1) | 1,321 (+0%) | 8mo | $8,000 | $6 | 75 |
| 4089 Kemper Ave | 0.32mi | 2/1.0 | 1,224 (-7%) | 10mo | $16,600 | $14 | 65 |
| 4055 Emory Dr | 0.52mi | 3/1.0 (+1) | 1,216 (-8%) | 2mo | $58,000 | $48 | 56 |
| 3970 Emory Dr | 0.59mi | 3/2.0 (+1) | 1,394 (+6%) | 1mo | $27,000 | $19 | 53 |
| 4133 Buena Vista Ave | 0.56mi | 3/2.0 (+1) | 1,257 (-5%) | 5mo | $45,000 | $36 | 53 |
| 1336 Peavy Dr | 0.68mi | 3/2.0 (+1) | 1,393 (+6%) | 1mo | $132,000 | $95 | 49 |
| 1380 Sylvian Dr | 0.67mi | 3/1.0 (+1) | 1,382 (+5%) | 10mo | $96,000 | $69 | 48 |
| 1275 Triple Hill Dr | 0.57mi | 3/2.0 (+1) | 1,400 (+6%) | 10mo | $130,000 | $93 | 46 |
| 3846 Flamingo Dr | 0.69mi | 3/1.0 (+1) | 1,243 (-6%) | 9mo | $45,000 | $36 | 45 |
| 3828 Lyons St | 0.69mi | 3/1.0 (+1) | 1,206 (-9%) | 10mo | $42,000 | $35 | 40 |
| 1388 Lakeview Cir | 0.70mi | 2/1.0 | 1,140 (-14%) | 6mo | $35,000 | $31 | 39 |
Match score weights: distance 35% · size 25% · config 20% · recency 20%. Top-matched comps best support the ARV.
Projected returns pro-forma
-3.0% appreciation · 5.03% rent growth · sell at horizon
- IRR
- 6.2%
- Equity multiple
- 1.25×
- Total profit
- $6,110
- Equity at exit
- $13,270
- IRR
- 17.2%
- Equity multiple
- 2.54×
- Total profit
- $38,345
- Equity at exit
- $7,695
Cash invested: $24,920 (down + closing). Projections, not guarantees.
Landlord ↔ Tenant lean methodology
- Overall (STATE)
- 90 Strongly Landlord-Friendly
- State Georgia
- 90 Strongly Landlord-Friendly · R+3
- County
- — inherits STATE
- City
- — inherits STATE
ZIP-level market 31206
- Rents YoY
- 5.0%
- Active inventory
- 207
- Price-to-rent
- 7.0×
Monthly cashflow live
- Estimated rent
- $1,067 high interval (Pro) →
- Mortgage (P&I)
- −$467
- Tax from tax record
- −$51 /mo · $613/yr
- Insurance
- −$37
- HOA
- −$0
- Vacancy / Maint / Mgmt
- −$224
- Net cashflow
- $288
Break-even live
UW: 25.0% down · 7.5% · 30yr · 1.5% tax · 5.0% vac · 8.0% maint · 8.0% mgmt
Financing live
Cash to close
- Down payment
- $22,250
- Closing costs
- $2,670
- Reserves months
- —
- Total cash needed
- —
Loan-product check · same deal, 3 products live
Conventional
25% down · 7.5% · 30yr
- Down + closing
- —
- Monthly P&I
- —
- Monthly cashflow
- —
- DSCR
- —
- Eligible?
- —
Personal DTI + credit; lowest rate.
DSCR
20% down · 8.5% · 30yr
- Down + closing
- —
- Monthly P&I
- —
- Monthly cashflow
- —
- DSCR
- —
- Eligible?
- —
No personal income docs; deal must DSCR.
Hard money
10% down · 12.0% · 12mo
- Down + closing
- —
- Monthly P&I
- —
- Monthly cashflow
- —
- DSCR
- —
- Eligible?
- —
Short-term bridge; refi at stabilization.
Rent comps 28 comps
| Address | Beds | Baths | Sqft | Rent | $/sqft | DOM | Units | Dist |
|---|---|---|---|---|---|---|---|---|
| 4196 Mikado Ave Unit A Macon, GA | 1.0 | 1.0 | 897 | $950 | $1.06 | 43d | 1 | 0.09mi |
| 4196 Mikado Ave Unit B Macon, GA | 1.0 | 1.0 | 890 | $900 | $1.01 | 43d | 1 | 0.09mi |
| 4322 Mikado Ave Macon, GA | 3.0 | 2.0 | 1344 | $1,230 | $0.92 | 20d | 1 | 0.13mi |
| 947 Troupe St Unit B Macon, GA | 2.0 | 2.0 | 1699 | $1,200 | $0.71 | 43d | 1 | 0.20mi |
| 947 Troupe St Macon, GA | 2.0 | 2.0 | 1699 | $1,200 | $0.71 | 20d | 1 | 0.20mi |
| 4052 Mikado Ave Macon, GA | 3.0 | 1.0 | 1624 | $1,300 | $0.80 | 13d | 1 | 0.33mi |
| 955 Putnam St Unit 1 Macon, GA | 3.0 | 1.0 | 950 | $1,199 | $1.26 | 43d | 1 | 0.36mi |
| 832 Richmond St Macon, GA | 3.0 | 1.0 | 1364 | $925 | $0.68 | 20d | 1 | 0.44mi |
| 1156 Triple Hill Dr Macon, GA | 2.0 | 1.0 | 980 | $875 | $0.89 | 13d | 1 | 0.44mi |
| 846 Bedingfield Ave Macon, GA | 3.0 | 1.5 | 1187 | $975 | $0.82 | 43d | 1 | 0.54mi |
| 1289 Rocky Creek Rd Macon, GA | 2.0 | 1.0 | 1404 | $750 | $0.53 | 43d | 1 | 0.58mi |
| 524 Carmen Pl Macon, GA | 3.0 | 1.0 | 1175 | $1,050 | $0.89 | 43d | 1 | 0.62mi |
| 4011 Marion Ave Macon, GA | 2.0 | 1.0 | 1200 | $1,200 | $1.00 | 20d | 1 | 0.65mi |
| 1148 N Beddingfield Dr Macon, GA | 3.0 | 1.0 | 1076 | $825 | $0.77 | 43d | 1 | 0.66mi |
| 1332 Hillridge Dr Macon, GA | 3.0 | 2.0 | 1050 | $1,050 | $1.00 | 13d | 1 | 0.66mi |
| 3709 Flamingo Dr Macon, GA | 3.0 | 1.0 | 1360 | $1,300 | $0.96 | 43d | 1 | 0.77mi |
| 4028 Saint Charles Pl Macon, GA | 3.0 | 1.0 | 900 | $800 | $0.89 | 20d | 1 | 0.98mi |
| 3423 Flamingo Dr Macon, GA | 3.0 | 1.0 | 1048 | $895 | $0.85 | 43d | 1 | 0.99mi |
| 3685 Rice Mill Rd Macon, GA | 3.0 | 1.0 | 1152 | $1,450 | $1.26 | 43d | 1 | 1.08mi |
| 837 Newberg Ave Macon, GA | 3.0 | 1.0 | 966 | $750 | $0.78 | 43d | 1 | 1.08mi |
| 3823 Saint Charles Pl Macon, GA | 3.0 | 1.0 | 1020 | $1,150 | $1.13 | 43d | 1 | 1.09mi |
| 1164 Newberg Ave Macon, GA | 3.0 | 1.0 | 1100 | $1,195 | $1.09 | 43d | 1 | 1.09mi |
| 3238 Somerset Dr Macon, GA | 3.0 | 1.0 | 1100 | $975 | $0.89 | 13d | 1 | 1.16mi |
| 3837 Spencer Cir Macon, GA | 3.0 | 1.0 | 1080 | $1,300 | $1.20 | 43d | 1 | 1.23mi |
| 3149 Somerset Dr Macon, GA | 2.0 | 1.0 | 897 | $745 | $0.83 | 43d | 1 | 1.29mi |
| 3080 Rice Mill Rd Unit M-5 Macon, GA | 1.0 | 1.0 | 875 | $750 | $0.86 | 43d | 1 | 1.49mi |
| 3080 Rice Mill Rd Macon, GA | 3.0 | 1.0 | 1100 | $950 | $0.86 | 43d | 1 | 1.49mi |
| 3080 Rice Mill Rd Unit C-1 Macon, GA | 3.0 | 1.5 | 1100 | $925 | $0.84 | 20d | 1 | 1.49mi |
Listing history 19 events
-
2026-06-19days on market $89,000 Active 75 DOM
-
2026-06-18days on market $89,000 Active 74 DOM
-
2026-06-17days on market $89,000 Active 73 DOM
-
2026-06-16days on market $89,000 Active 72 DOM
-
2026-06-15days on market $89,000 Active 71 DOM
-
2026-06-14days on market $89,000 Active 69 DOM
-
2026-06-13days on market $89,000 Active 68 DOM
-
2026-06-10days on market $89,000 Active 66 DOM
-
2026-06-09days on market $89,000 Active 65 DOM
-
2026-06-09days on market $89,000 Active 64 DOM
-
2026-06-07days on market $89,000 Active 63 DOM
-
2026-06-03status $89,000 Active 59 DOM
-
2026-04-23status Pending
-
2026-04-09status Active
-
2026-03-27status Pending
-
2024-02-21$89,000 Active
-
2003-03-03soldstatus $68,000
-
2002-12-31soldstatus $30,500
-
2000-12-21soldstatus $60,000
ⓘ Source: listings_history table (triggers on properties + properties_extension) + one-shot
backfill from property_details.listing_events for pre-trigger history.
Tax reassessment forecast GA · Resets to sale price
- Current annual tax
- $613 · $51/mo
- Projected year-2 tax
- $819 · $68/mo
- Expected delta
- +$206/yr (+$17/mo · 33.7%)
ⓘ Screening estimate from a state-policy table — verify with the county assessor before closing.
Climate risk First Street
- Flood 1/10 Low FEMA zone X (unshaded) · 0% chance over 30 yrs
- Wildfire 2/10 Low
- Heat 7/10 Severe 7 d/yr ≥109°F today · 18 d/yr by 30 yrs out
- Wind 6/10 Major 72% chance of damaging wind over 30 yrs
- Air quality 3/10 Moderate 3 unhealthy d/yr today · 4 by 30 yrs out
Nearby sold comps map
Loading sold comps map…
Walkable amenities ~0.75 mi
Loading nearby amenities…
Taxation est. · year 1
- Rental income
- $12,800
- − Mortgage interest
- −$4,985
- − Property taxes
- −$613
- − Insurance
- −$445
- − Repairs & maintenance
- −$1,024
- − Management
- −$1,024
- − Depreciation
- −$2,589
- Taxable income
- $2,120
- Est. tax owed @ 24.0%
- −$509
- After-tax cash flow
- $2,945/yr
For passive investors: Depreciation is non-cash, so a rental often shows a tax loss while cash-flowing — sheltering income. Rental losses are passive: they offset passive income freely, and up to $25,000/yr can offset ordinary (W-2) income if you actively participate and your MAGI is under $100k (phasing out to $0 by $150k); unused losses carry forward. On sale, claimed depreciation is recaptured at up to 25%, and gains may owe capital-gains tax (a 1031 exchange can defer both). Figures are a year-1 estimate at your 24.0% rate — not tax advice; consult a CPA.
Schools (NCES district)
- District
- Bibb County
- NCES district ID
- 1300420
- Math proficiency
- 11% ▼ -14.00%
- Reading proficiency
- 18% ▼ -11.00%
- Median HH income
- $37,426
- Composite
- 12.13/100
- National rank
- #9654
- State rank
- #161 of 174 in GA
Livability — Macon-Bibb County
No livability data for this city. (Only ~50 U.S. cities are tracked.)
Census & demographics
- Census place
- Macon-Bibb County, GA
- County
- Bibb County · 164,332 people
- City population
- 143,186
- Metro
- Macon-Bibb County, GA
- Population (ZIP)
- 24,310
- Household income
- $30,042
- Rent vs Own
- Severe rent burden
- 1335.0
Population outlook (Bibb County) Hauer SSP2
- Today (2025)
- 148,772 people
- By 2030
- 145,904 · -1.9%
- By 2040
- 139,404 · -6.3%
- By 2050
- 131,603 · -11.5%
- By 2075
- 111,050 · -25.4%
- By 2100
- 83,346 · -44.0%
Race, ethnicity, and origin ACS 2023
- Neighborhood character
- Predominantly Black (76%)
- Race & ethnicity
- Black 76% White 12% Hispanic / Latino 8% Two or more races 4%
- Hispanic origin (detail)
- Mexican 5% Puerto Rican 1%
- Common ancestry
- Lithuanian 1% Italian 1%
- Foreign-born
- 4% · Canada
- Languages at home
- 91% English-only · Spanish 8%
Political lean MEDSL · Bibb
- 2024 margin
- Strong D (+22.4) · D 61.0% · R 38.5%
- 2008→2024 swing
- +4.4pp toward D · 2008: 18.0pp · 2024: 22.4pp
- All cycles
- 2024: D+22.4 2020: D+23.8 2016: D+20.2 2012: D+20.0 2008: D+18.0
Not yet ingested
- Civics
- —
Market trends
- HPI YoY
- ▼ -80.17%
- Current HPI
- 148.6765
- Rent YoY
- ▲ 5.03%
- Metro
- Macon-Bibb County, GA
- State GDP YoY
- ▲ 2.66%
- F500 in state
- 28
Industry mix (Fortune 500 HQ in GA)
| Industry | F500 HQs | Revenue |
|---|---|---|
| Paper / Packaging | 2 | $29B |
|
||
| Retail | 1 | $160B |
|
||
| Transportation / Logistics | 1 | $91B |
|
||
| Airlines | 1 | $62B |
|
||
| Consumer Goods | 1 | $47B |
|
||
| Utilities | 1 | $25B |
|
||
Price history
+48.3% since first listed7 events — show timeline
- 2026-04-23 Pending — SWGABOR
- 2026-04-09 Relisted — SWGABOR
- 2026-03-27 Pending — SWGABOR
- 2024-02-21 Listed $89,000 SWGABOR
- 2003-03-03 Sold (Public Records) $68,000 Public Records
- 2002-12-31 Sold (Public Records) $30,500 Public Records
- 2000-12-21 Sold (Public Records) $60,000 Public Records
Property tax history
+10.0%/yrLatest (2025): $613 · +3.1% YoY. Source: county tax records.
Cash-flow waterfall
monthlySold comps — $/sqft
last 12 mo · ≤1 miLoading sold comps…