 🏷️ Likely Rental
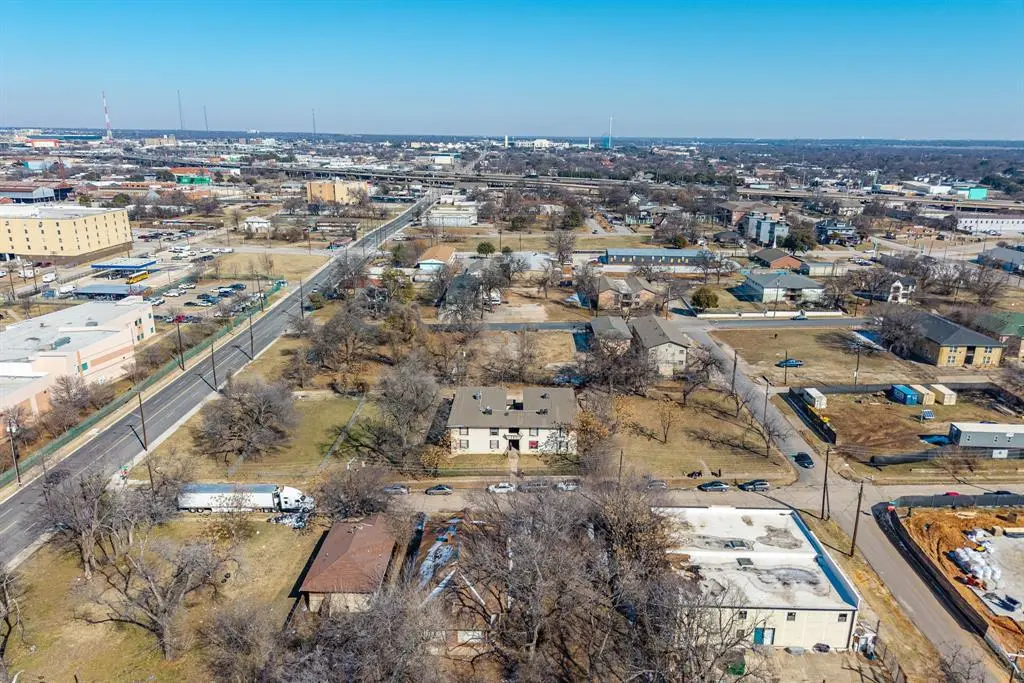
2718 Cleveland St · Dallas, TX
Flood risk 1/10 · Minimal
- FEMA flood zone
- X (unshaded)
- Chance of flooding over 30 yrs
- 0.0%
- Est. flood insurance / yr
- $507 – $1,088
Fire risk 1/10 · Minimal
- Est. fire insurance / yr
- $1,222 – $2,270
Heat risk 7/10 · Major
- Hot days now (above 109°F)
- 7 days/yr
- Hot days in 30 yrs
- 24 days/yr
Wind risk 6/10 · Moderate
- Chance of severe wind over 30 yrs
- 27.0%
Air-quality risk 3/10 · Minor
- Unhealthy air days now
- 2 days/yr
- Unhealthy air days in 30 yrs
- 3 days/yr
Risk factors via First Street. Map © Google.
Why this score? — see what drove the A- grade
The composite is a weighted blend of 9 inputs, each scored 0–100. Each bar is that input's sub-score; the figure is the points it added to the 100-point composite (weight × sub-score).
- Cash flow +30.0/30.0
- ARV discount +15.0/15.0
- 1% rule +10.0/10.0
- DSCR +10.0/10.0
- Appreciation +5.4/10.0
- Rent growth +4.3/5.0
- Livability +4.0/5.0
- Schools +2.8/10.0
- Condition / age +2.5/5.0
$995,000
🖨 Deal sheet 📄 Offer letter ✓ Due diligence
Multi-family units
County records classify this as Multi-Family (5+ Unit). Listing-text estimate: 8 units. confirmed
5+ unit building — per-unit beds/baths from public records are typically unavailable; the breakdown below (if shown) is an estimate from the listing text.
Listing remarks MLS
2718 Cleveland is an 8-unit value-add multifamily opportunity located in The Cedars, a rapidly transforming neighborhood just south of Downtown Dallas and Deep Ellum. The property benefits from immediate access to major employment centers, entertainment districts, and ongoing neighborhood reinvestment. The asset features rare, oversized unit layouts comprised of four (4) 4-bedroom units and four (4) 3-bedroom units, positioning the property to serve strong family and roommate demand within an infill urban submarket. The investment offers a clear value-add business plan, including interior renovations to drive rent growth, property tax appeals to reduce expenses, and the opportunity to shift electricity to tenant responsibility, aligning operating costs with market standards and increasing NOI. With its irreplaceable Cedars location, unique unit mix, and multiple paths to income growth, 2718 Cleveland presents an attractive opportunity for investors seeking durable cash flow with meaningful upside in a high-growth Dallas submarket.
Key facts
- Interior renovations
- Unique unit mix
- 0.29 acre lot
Tags
Neighborhood map
What this means for you Summary
Snapshot
- This is a 4×4bd/2ba + 4×3bd/2ba units multifamily listed at $995k.
Deal economics
- At list price, monthly cash flow is $10k ($123k/yr) — positive. Per door: $1k/mo.
- The deal already cash-flows at list — no discount required.
- Meets the 1% rule at list price ($22k rent vs $995k).
- Recommended offer: $876k (12.0% below list) — sets the bar for market timing.
- Cap rate 18.7% vs local median 2.3% in Dallas — top-decile yield for the area; either an underpriced asset or a hidden risk that comps aren't pricing in. Stress-test before assuming the spread holds.
Location & tenants
- Location reads 81/100 on livability (#24 in TX, #1,380 nationally) — a professional / high-income tenant draw. Strengths: amenities A+, commute A+, housing A+; Watch: schools C-, crime F.
- Dallas ISD (urban): math 31% / reading 36% proficiency, ranked #559 of 826 in TX (top 68%) — families likely to look elsewhere, expect single-tenant / working-renter base with shorter leases; 83% free/reduced lunch — lower-income household profile, screen leases tightly.
- Market conditions: Rents rising fast (+7.2%/yr); 248 active listings in the ZIP; 1 comparable units currently listed for rent nearby; 12,577 units permitted in Dallas County in 2024 (6,829 in 5+ unit buildings).
- At $22,292/mo this rent would consume 587% of the median local household income ($46k/yr) (locally 1464% of renters already pay >50% of income on rent) — very limited rent-growth headroom before tenants either downsize or default.
Forward outlook
- In year one you build about $15k of equity ($7k loan paydown + $8k appreciation (0.8% local appreciation)).
- Dallas County population projected at +35% by 2050 — long-run rental-demand tailwind backs the buy-and-hold thesis.
- At projected returns (0.8% appreciation + 7.2% rent growth), your $279k cash investment doubles in ~2 years — after that, you're playing with house money.
- By year 5, paydown + projected appreciation supports a ~$70k cash-out refi (75% LTV) — recoverable capital for the next deal without selling this one.
Negotiation context
- It's been on market 135 days — a 12% lower offer ($876k) is reasonable based on typical stale-listing flexibility.
Risks & watch-outs
- Climate carrying-cost: major wind risk, 27% chance of damaging wind over 30y; extreme-heat days projected 7→24/yr by 2055 (HVAC capex compounding) — expect insurance premiums to compound above CPI over the hold.
Questions for the listing agent
- It's been on market 135 days. Have you received any prior offers? Is the seller open to a 12% concession, seller financing, or rate buy-down credit?
- Can we see the unit-by-unit rent roll, current vacancy, and any below-market leases? What's the average tenancy length?
- What capital expenditures (roof, boiler, parking lot, exteriors) have been made in the last 5 years, and what's planned in the next 2?
- Built in 1961 — when were the roof, HVAC, electrical panel, plumbing, and water heater last replaced?
- Why hasn't it sold? Are there any deal-killer items the seller is aware of (foundation, flood, title, zoning, code violations)?
- Is there a deadline driving the sale (1031 exchange, divorce, estate, relocation)? That informs how much negotiation room exists.
- Crime grade is F in this area — have there been break-ins, vandalism, or insurance claims at this property in the last 3 years? What carrier currently insures it and at what premium?
- What's the average days-on-market for RENTAL listings here right now (not sales)? A rising rental-DOM trend means longer vacancies and softer asking-rent achievability than the comps imply.
- What's the recent tenant-quality profile in this submarket — average credit score on applications, eviction rate, late-payment / NSF rate, and stable-employment percentage? A property-management company in the area should have these aggregated.
- How much new apartment / multifamily construction is in the pipeline within 1–3 miles? Heavy new supply (>2% of stock underway) typically softens rents 12–24 months out; light construction supports rent growth.
Investment metrics
- 1% rule
- 2.24% ✓
- Cap rate
- 18.67%
- Cash-on-cash
- 44.20%
- DSCR
- 2.97
- GRM
- 3.7
CMA / ARV
- ARV (median comp)
- $1,876,868
- List price
- $995,000
- Delta
- -46.99%
- Verdict
- UNDERPRICED
- Comps
- 1 within 2.0 mi
Show comp detail 3 sales within ~0.75 mi
| Address | Dist | Beds/Ba | Sqft | Sold | Price | $/sf | Match |
|---|---|---|---|---|---|---|---|
| 1811 Browder St | 0.60mi | 3/4.5 | 3,777 (-7%) | 21mo | $883,000 | $234 | 42 |
| 3521/3523 S Harwood St | 0.66mi | 6/5.0 | 3,500 (-14%) | 9mo | $635,000 | $181 | 38 |
| 3522/3524 Parnell St | 0.57mi | 6/5.0 | 3,500 (-14%) | 16mo | $729,000 | $208 | 36 |
Match score weights: distance 35% · size 25% · config 20% · recency 20%. Top-matched comps best support the ARV.
Projected returns pro-forma
0.79% appreciation · 7.19% rent growth · sell at horizon
- IRR
- 50.7%
- Equity multiple
- 3.73×
- Total profit
- $760,532
- Equity at exit
- $328,805
- IRR
- 54.4%
- Equity multiple
- 8.61×
- Total profit
- $2,118,983
- Equity at exit
- $428,666
Cash invested: $278,600 (down + closing). Projections, not guarantees.
Landlord ↔ Tenant lean methodology
- Overall (STATE)
- 87 Strongly Landlord-Friendly
- State Texas
- 87 Strongly Landlord-Friendly · R+5
- County
- — inherits STATE
- City
- — inherits STATE
ZIP-level market 75215
- Home prices YoY
- 0.3%
- Rents YoY
- 7.2%
- Active inventory
- 248
- Price-to-rent
- 24.8×
Monthly cashflow live
- Estimated rent
- $22,292 medium interval (Pro) →
- Mortgage (P&I)
- −$5,218
- Tax from tax record
- −$1,716 /mo · $20,597/yr
- Insurance
- −$415
- HOA
- −$0
- Vacancy / Maint / Mgmt
- −$4,681
- Net cashflow
- $10,262
Break-even live
8-unit breakdown (identical units grouped — click to expand)
| Units | Beds | Baths | Est. rent |
|---|---|---|---|
| 4× units | 4 | 2 | $13,384 |
| #1 | 4 | 2 | $3,346 |
| #2 | 4 | 2 | $3,346 |
| #3 | 4 | 2 | $3,346 |
| #4 | 4 | 2 | $3,346 |
| 4× units | 3 | 2 | $8,908 |
| #5 | 3 | 2 | $2,227 |
| #6 | 3 | 2 | $2,227 |
| #7 | 3 | 2 | $2,227 |
| #8 | 3 | 2 | $2,227 |
| Total (8 units) | $22,292 | ||
UW: 25.0% down · 7.5% · 30yr · 1.5% tax · 5.0% vac · 8.0% maint · 8.0% mgmt
Financing live
Cash to close
- Down payment
- $248,750
- Closing costs
- $29,850
- Reserves months
- —
- Total cash needed
- —
Loan-product check · same deal, 3 products live
Conventional
25% down · 7.5% · 30yr
- Down + closing
- —
- Monthly P&I
- —
- Monthly cashflow
- —
- DSCR
- —
- Eligible?
- —
Personal DTI + credit; lowest rate.
DSCR
20% down · 8.5% · 30yr
- Down + closing
- —
- Monthly P&I
- —
- Monthly cashflow
- —
- DSCR
- —
- Eligible?
- —
No personal income docs; deal must DSCR.
Hard money
10% down · 12.0% · 12mo
- Down + closing
- —
- Monthly P&I
- —
- Monthly cashflow
- —
- DSCR
- —
- Eligible?
- —
Short-term bridge; refi at stabilization.
Rent comps 1 comps
| Address | Beds | Baths | Sqft | Rent | $/sqft | DOM | Units | Dist |
|---|---|---|---|---|---|---|---|---|
| 2934 S Hall St Unit 401 Dallas, TX | 3.0 | 4.5 | 5275 | $12,500 | $2.37 | 43d | 1 | 1.34mi |
Listing history 17 events
-
2026-06-18days on market $995,000 Active 135 DOM
-
2026-06-17days on market $995,000 Active 134 DOM
-
2026-06-16days on market $995,000 Active 133 DOM
-
2026-06-15days on market $995,000 Active 132 DOM
-
2026-06-13days on market $995,000 Active 130 DOM
-
2026-06-09days on market $995,000 Active 126 DOM
-
2026-06-08days on market $995,000 Active 125 DOM
-
2026-06-07days on market $995,000 Active 124 DOM
-
2026-06-04days on market $995,000 Active 121 DOM
-
2026-06-03days on market $995,000 Active 120 DOM
-
2026-06-02days on market $995,000 Active 119 DOM
-
2026-06-02days on market $995,000 Active 118 DOM
-
2026-05-31days on market $995,000 Active 117 DOM
-
2026-02-03$995,000 Active 1055-char remark
Show marketing remark (1055 chars)
2718 Cleveland is an 8-unit value-add multifamily opportunity located in The Cedars, a rapidly transforming neighborhood just south of Downtown Dallas and Deep Ellum. The property benefits from immediate access to major employment centers, entertainment districts, and ongoing neighborhood reinvestment. The asset features rare, oversized unit layouts comprised of four (4) 4-bedroom units and four (4) 3-bedroom units, positioning the property to serve strong family and roommate demand within an infill urban submarket. The investment offers a clear value-add business plan, including interior renovations to drive rent growth, property tax appeals to reduce expenses, and the opportunity to shift electricity to tenant responsibility, aligning operating costs with market standards and increasing NOI. With its irreplaceable Cedars location, unique unit mix, and multiple paths to income growth, 2718 Cleveland presents an attractive opportunity for investors seeking durable cash flow with meaningful upside in a high-growth Dallas submarket.
-
2017-02-01soldstatus
-
2015-01-12soldstatus
-
2008-04-11soldstatus
ⓘ Source: listings_history table (triggers on properties + properties_extension) + one-shot
backfill from property_details.listing_events for pre-trigger history.
Tax reassessment forecast TX · Resets to sale price
- Current annual tax
- $20,597 · $1,716/mo
- Projected year-2 tax
- $20,597 · $1,716/mo
- Expected delta
- $0/yr ($0/mo · 0.0%)
ⓘ Screening estimate from a state-policy table — verify with the county assessor before closing.
Climate risk First Street
- Flood 1/10 Low FEMA zone X (unshaded) · 0% chance over 30 yrs
- Wildfire 1/10 Low
- Heat 7/10 Severe 7 d/yr ≥109°F today · 24 d/yr by 30 yrs out
- Wind 6/10 Major 27% chance of damaging wind over 30 yrs
- Air quality 3/10 Moderate 2 unhealthy d/yr today · 3 by 30 yrs out
Nearby sold comps map
Loading sold comps map…
Walkable amenities ~0.75 mi
Loading nearby amenities…
Taxation est. · year 1
- Rental income
- $267,504
- − Mortgage interest
- −$55,735
- − Property taxes
- −$20,597
- − Insurance
- −$4,975
- − Repairs & maintenance
- −$21,400
- − Management
- −$21,400
- − Depreciation
- −$28,945
- Taxable income
- $114,450
- Est. tax owed @ 24.0%
- −$27,468
- After-tax cash flow
- $95,673/yr
For passive investors: Depreciation is non-cash, so a rental often shows a tax loss while cash-flowing — sheltering income. Rental losses are passive: they offset passive income freely, and up to $25,000/yr can offset ordinary (W-2) income if you actively participate and your MAGI is under $100k (phasing out to $0 by $150k); unused losses carry forward. On sale, claimed depreciation is recaptured at up to 25%, and gains may owe capital-gains tax (a 1031 exchange can defer both). Figures are a year-1 estimate at your 24.0% rate — not tax advice; consult a CPA.
Schools (NCES district)
- District
- Dallas ISD
- NCES district ID
- 4816230
- Math proficiency
- 31% ▼ -16.00%
- Reading proficiency
- 36% ▼ -4.00%
- Median HH income
- $42,881
- Composite
- 28.41/100
- National rank
- #6763
- State rank
- #559 of 826 in TX
Livability — Dallas
- Score
- 81/100
- State rank
- #24
- US rank
- #1380
Category grades
Schools grade is shown separately in the Schools card above.
Census & demographics
- Census place
- Dallas, TX
- County
- Dallas County · 2,612,404 people
- City population
- 1,168,437
- Metro
- Dallas-Fort Worth-Arlington, TX
- Population (ZIP)
- 18,895
- Household income
- $45,557
- Rent vs Own
- Severe rent burden
- 1464.0
Population outlook (Dallas County) Hauer SSP2
- Today (2025)
- 2,979,839 people
- By 2030
- 3,191,823 · +7.1%
- By 2040
- 3,619,611 · +21.5%
- By 2050
- 4,026,915 · +35.1%
- By 2075
- 4,957,073 · +66.4%
- By 2100
- 5,508,725 · +84.9%
Race, ethnicity, and origin ACS 2023
- Neighborhood character
- Diverse neighborhood (Simpson 0.58)
- Race & ethnicity
- Black 59% Hispanic / Latino 25% White 11% Two or more races 10%
- Hispanic origin (detail)
- Mexican 21%
- Common ancestry
- Italian 1% Hispanic 1%
- Foreign-born
- 16% · Canada
- Languages at home
- 74% English-only · Spanish 26%
Political lean MEDSL · Dallas
- 2024 margin
- Strong D (+22.2) · D 60.2% · R 38.0% · Other 1.8%
- 2008→2024 swing
- +6.9pp toward D · 2008: 15.3pp · 2024: 22.2pp
- All cycles
- 2024: D+22.2 2020: D+31.6 2016: D+26.2 2012: D+15.4 2008: D+15.3
Not yet ingested
- Civics
- —
Market trends
- HPI YoY
- ▲ 0.79%
- Current HPI
- 224.2955
- Rent YoY
- ▲ 7.19%
- Metro
- Dallas-Fort Worth-Arlington, TX
- State GDP YoY
- ▲ 3.95%
- F500 in state
- 110
Industry mix (Fortune 500 HQ in TX)
| Industry | F500 HQs | Revenue |
|---|---|---|
| Energy | 16 | $1,198B |
|
||
| Technology | 5 | $198B |
|
||
| Engineering / Construction | 4 | $72B |
|
||
| Energy Services | 3 | $60B |
|
||
| Utilities | 3 | $41B |
|
||
| Healthcare | 2 | $330B |
|
||
Price history
4 events — show timeline
- 2026-02-03 Listed $995,000 NTREIS
- 2017-02-01 Sold (Public Records) — Public Records
- 2015-01-12 Sold (Public Records) — Public Records
- 2008-04-11 Sold (Public Records) — Public Records
Property tax history
+11.9%/yrLatest (2025): $20,597 · +5.3% YoY. Source: county tax records.
Cash-flow waterfall
monthlySold comps — $/sqft
last 12 mo · ≤1 miLoading sold comps…