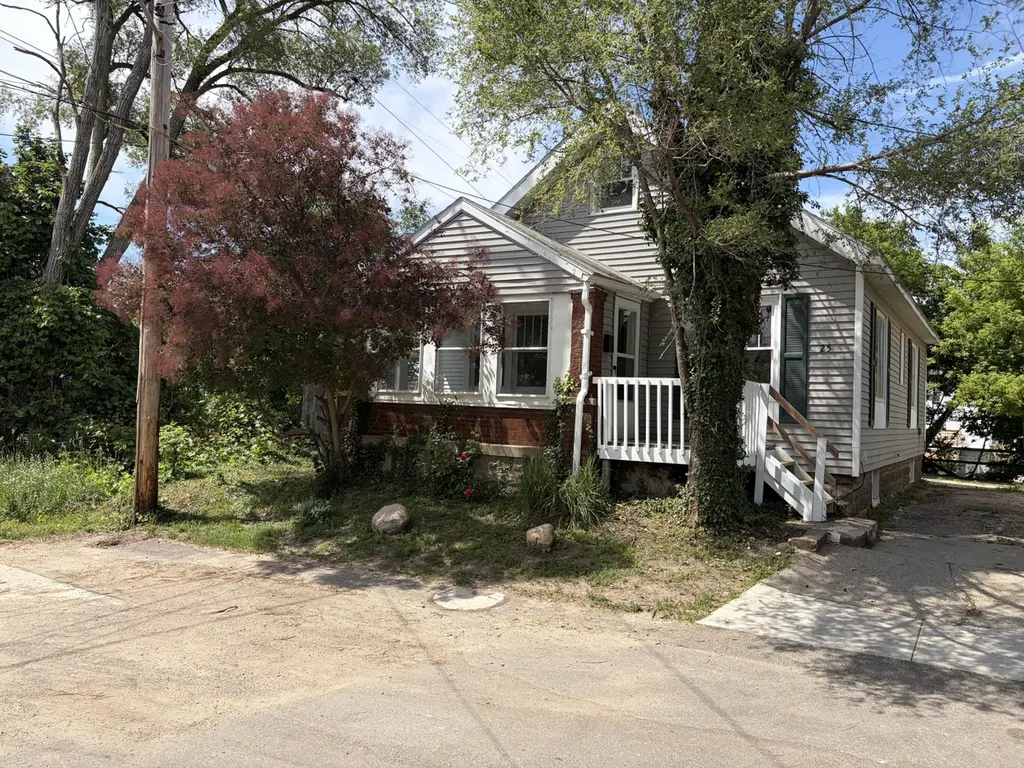
25 Page St NE · Grand Rapids, MI
Flood risk 1/10 · Minimal
- FEMA flood zone
- X (unshaded)
- Chance of flooding over 30 yrs
- 0.0%
- Est. flood insurance / yr
- $473 – $860
Fire risk 1/10 · Minimal
- Est. fire insurance / yr
- $784 – $1,456
Heat risk 2/10 · Minimal
- Hot days now (above 96°F)
- 7 days/yr
- Hot days in 30 yrs
- 16 days/yr
Wind risk 2/10 · Minimal
- Chance of severe wind over 30 yrs
- —
Air-quality risk 3/10 · Minor
- Unhealthy air days now
- 2 days/yr
- Unhealthy air days in 30 yrs
- 3 days/yr
Risk factors via First Street. Map © Google.
Why this score? — see what drove the D grade
The composite is a weighted blend of 9 inputs, each scored 0–100. Each bar is that input's sub-score; the figure is the points it added to the 100-point composite (weight × sub-score).
- Cash flow +16.1/30.0
- ARV discount +7.5/15.0
- DSCR +5.0/10.0
- Livability +4.2/5.0
- Rent growth +3.6/5.0
- 1% rule +3.5/10.0
- Condition / age +2.5/5.0
- Schools +1.9/10.0
- Appreciation +0.0/10.0
$199,975
🖨 Deal sheet (PDF) 📄 Offer letter ✓ Due diligence
Listing remarks MLS
Charming & character filled 11/2 story home in prime NE area! Features a full front enclosed porch, Living Room, Formal Dining Room, Updated Kitchen, 2 Bedrooms, Full Bath & potential galore with a full unfinished walk-up attic & full unfinished basement!! The entire interior has all fresh paint, new flooring throughout including refinished Hardwood Floors & natural wood trim, a newer forced air furnace & hot water heater (11-2024). Situated at the end of a non through street with off street parking & a very private side & backyard. Located just a few blocks from Downtown, the Grand River & NE as well as NW business districts. Offering immediate possession & best of all priced below market with all offers held & due by Tuesday June 9 at noon.
Key facts
- Updated kitchen
- 2,962 sq ft lot
- Garage
Tags
Property features AI
Exterior
- Parking: Attached garage; Attached parking
- Utilities: Public water; Natural gas available and connected; Electricity available; Natural gas water heater
- Home design: Traditional style; Single-family residence; Residential property
- Construction: Built in 1928; Vinyl siding; Asphalt composition shingle roof
- Exterior features: Paved road access
Interior
- Kitchen: Kitchen
- Bedrooms: Bedroom 2
- Bathrooms: 1 full bathroom
- Heating & cooling: Forced air heating
- Interior features: Pantry; Full basement; Total of 6 rooms
Neighborhood map
What this means for you Summary
Snapshot
- This is a 2-bed/1.0-bath single-family listed at $200k.
Deal economics
- At list price, monthly cash flow is $102 ($1k/yr) — positive.
- The deal already cash-flows at list — no discount required.
- To meet the 1% rule (rent ≥ 1% of price), the offer needs to be $170k (15.2% below list).
- Recommended offer: $170k (15.2% below list) — sets the bar for 1% rule.
- Cap rate 6.9% vs local median 4.5% in Grand Rapids — top-decile yield for the area; either an underpriced asset or a hidden risk that comps aren't pricing in. Stress-test before assuming the spread holds.
Location & tenants
- Location reads 83/100 on livability (#44 in MI, #939 nationally) — a professional / high-income tenant draw. Strengths: amenities A+, commute A+, cost of living A+; Watch: employment C-, crime F.
- Grand Rapids Public Schools (urban): math 15% / reading 29% proficiency, ranked #451 of 540 in MI (top 84%) — low school quality limits family demand, transient renter base, plan for 1-2y turnover; 80% free/reduced lunch — lower-income household profile, screen leases tightly.
- Zoned schools: Palmer School (math 5% / reading 15%, grade F, #1,230 of 1,397 statewide, top 91%, 178 students, 85% FRL); Riverside Middle School (math 8% / reading 17%, grade F, #466 of 493 statewide, top 95%, 248 students, 89% FRL); Union High School (math 2% / reading 12%, grade F, #699 of 713 statewide, top 99%, 922 students, 88% FRL).
- Zoned-school proficiency averages 10% at this address vs 22% district-wide (-12 pts) — the specific schools serving this property underperform the Grand Rapids Public Schools average; the district grade overstates school quality for this exact location.
- Market conditions: Rents rising fast (+4.5%/yr); 149 active listings in the ZIP; 40 comparable units currently listed for rent nearby; rentals lingering (median 46d on market — plan ~5-8 weeks vacancy on turnover, expect pricing pressure); 92% of comp listings sitting > 30 days — soft ceiling on asking rent; 2,253 units permitted in Kent County in 2024 (969 in 5+ unit buildings).
Forward outlook
- Local home prices are declining (-3.0%/yr); year-one equity from $1k of loan paydown is wiped out by about $6k of value loss. Plan a longer hold.
- Kent County population projected at +22% by 2050 — long-run rental-demand tailwind backs the buy-and-hold thesis.
Negotiation context
- Only 9 days on market — expect competitive offers; lowballing is unlikely to land.
- 7 sale attempts since 32y ago with the ask held roughly flat each time — persistent listings suggest the price (not the market) is what's stuck; bring a comps-based counter.
- Current owner paid $24k; list at $200k implies a 737% gain — meaningful room to come down on a strong offer.
Risks & watch-outs
- Watch-outs: built in 1928 — expect roof / HVAC / electrical / plumbing capex.
Questions for the listing agent
- Built in 1928 — when were the roof, HVAC, electrical panel, plumbing, and water heater last replaced?
- Is there a deadline driving the sale (1031 exchange, divorce, estate, relocation)? That informs how much negotiation room exists.
- Crime grade is F in this area — have there been break-ins, vandalism, or insurance claims at this property in the last 3 years? What carrier currently insures it and at what premium?
- The area grade is low — what's the realistic commute time and amenity access for the typical tenant pool here? Any planned neighborhood developments (good or bad) we should know about?
- What's the average days-on-market for RENTAL listings here right now (not sales)? A rising rental-DOM trend means longer vacancies and softer asking-rent achievability than the comps imply.
- What's the recent tenant-quality profile in this submarket — average credit score on applications, eviction rate, late-payment / NSF rate, and stable-employment percentage? A property-management company in the area should have these aggregated.
- How much new for-sale + rental construction is in the pipeline within 1–3 miles? Heavy new supply typically softens prices + rents 12–24 months out; constrained supply supports both.
Investment metrics
- 1% rule
- 0.85% ✗
- Cap rate
- 6.91%
- Cash-on-cash
- 2.19%
- DSCR
- 1.10
- GRM
- 9.8
CMA / ARV
No comps found within radius.
Projected returns pro-forma
-3.0% appreciation · 4.55% rent growth · sell at horizon
- IRR
- -11.3%
- Equity multiple
- 0.58×
- Total profit
- $-23,276
- Equity at exit
- $29,817
- IRR
- -0.2%
- Equity multiple
- 0.99×
- Total profit
- $-772
- Equity at exit
- $17,290
Cash invested: $55,993 (down + closing). Projections, not guarantees.
Landlord ↔ Tenant lean methodology
- Overall (STATE)
- 62 Landlord-Friendly
- State Michigan
- 62 Landlord-Friendly · EVEN
- County
- — inherits STATE
- City
- — inherits STATE
ZIP-level market 49505
- Rents YoY
- 4.5%
- Active inventory
- 149
- Price-to-rent
- 9.8×
Monthly cashflow live
- Estimated rent
- $1,696 high interval (Pro) →
- Mortgage (P&I)
- −$1,049
- Tax from tax record
- −$106 /mo · $1,268/yr
- Insurance
- −$83
- HOA
- −$0
- Vacancy / Maint / Mgmt
- −$356
- Net cashflow
- $102
Break-even live
Sensitivity live
| Price | -10% $215 | -5% $159 | +0% $102 | +5% $46 | +10% $-11 |
|---|---|---|---|---|---|
| Rent | -10% $-32 | -5% $35 | +0% $102 | +5% $169 | +10% $236 |
| Rate | -1.0pp $203 | -0.5pp $153 | base $102 | +0.5pp $50 | +1.0pp $-2 |
UW: 25.0% down · 7.5% · 30yr · 1.5% tax · 5.0% vac · 8.0% maint · 8.0% mgmt
Financing live
Cash to close
- Down payment
- $49,994
- Closing costs
- $5,999
- Reserves months
- —
- Total cash needed
- —
Loan-product check · same deal, 3 products live
Conventional
25% down · 7.5% · 30yr
- Down + closing
- —
- Monthly P&I
- —
- Monthly cashflow
- —
- DSCR
- —
- Eligible?
- —
Personal DTI + credit; lowest rate.
DSCR
20% down · 8.5% · 30yr
- Down + closing
- —
- Monthly P&I
- —
- Monthly cashflow
- —
- DSCR
- —
- Eligible?
- —
No personal income docs; deal must DSCR.
Hard money
10% down · 12.0% · 12mo
- Down + closing
- —
- Monthly P&I
- —
- Monthly cashflow
- —
- DSCR
- —
- Eligible?
- —
Short-term bridge; refi at stabilization.
Rent comps 40 comps
| Address | Beds | Baths | Sqft | Rent | $/sqft | DOM | Units | Dist |
|---|---|---|---|---|---|---|---|---|
| 1359 Plainfield Ave NE Grand Rapids, MI | 2.0 | 1.0–2.0 | 720 | $2,325 | $3.23 | 5d | 9 | 0.14mi |
| 41 Caledonia St NE Unit 1 Grand Rapids, MI | 2.0 | 1.0 | 800 | $1,395 | $1.74 | 45d | 1 | 0.14mi |
| 135 Page St NE Grand Rapids, MI | 3.0 | 2.0 | 1100 | $3,100 | $2.82 | 45d | 1 | 0.16mi |
| 50 Mathews Ct NE Grand Rapids, MI | 3.0 | 1.5 | 1100 | $1,850 | $1.68 | 45d | 1 | 0.21mi |
| 120 Leonard St NE Unit 2 Grand Rapids, MI | 2.0 | 1.0 | 750 | $1,275 | $1.70 | 45d | 1 | 0.23mi |
| 202 Leonard St NE Grand Rapids, MI | 2.0 | 1.0 | 950 | $1,200 | $1.26 | 45d | 1 | 0.26mi |
| 1349 Maude Ave NE Grand Rapids, MI | 2.0 | 1.0 | 600 | $1,145 | $1.91 | 45d | 1 | 0.36mi |
| 405 Carrier St NE Grand Rapids, MI | 1.0 | 1.0 | 550 | $1,250 | $2.27 | 45d | 1 | 0.45mi |
| 974 Front Ave NW Apt 116 Grand Rapids, MI | 1.0 | 1.0 | 588 | $1,450 | $2.47 | 45d | 1 | 0.53mi |
| 974 Front Ave NW Apt 129 Grand Rapids, MI | 1.0 | 1.0 | 821 | $1,825 | $2.22 | 45d | 1 | 0.53mi |
| 974 Front Ave NW Apt 123 Grand Rapids, MI | 1.0 | 1.0 | 528 | $1,395 | $2.64 | 45d | 1 | 0.53mi |
| 974 Front Ave NW Apt 121 Grand Rapids, MI | 1.0 | 1.0 | 771 | $1,800 | $2.33 | 45d | 1 | 0.53mi |
| 1033 College Ave NE Grand Rapids, MI | 1.0 | 1.0 | 560 | $1,300 | $2.32 | 45d | 3 | 0.59mi |
| 1335 Hamilton Ave NW Unit 2 Grand Rapids, MI | 3.0 | 1.0 | 1124 | $1,395 | $1.24 | 45d | 1 | 0.63mi |
| 239 Ann St NE Unit 1 Grand Rapids, MI | 2.0 | 1.0 | 928 | $1,300 | $1.40 | 45d | 1 | 0.65mi |
| 407 11th St NW Unit C Grand Rapids, MI | 2.0 | 1.0 | 772 | $1,500 | $1.94 | 45d | 1 | 0.65mi |
| 101 Dean St NE #2 Grand Rapids, MI | 1.0 | 1.0 | 851 | $1,050 | $1.23 | 45d | 1 | 0.66mi |
| 1844 Monroe Ave NW Grand Rapids, MI | 2.0 | 1.0 | 1000 | $2,050 | $2.05 | 45d | 1 | 0.69mi |
| 733 Livingston Ave NE Grand Rapids, MI | 2.0 | 1.0 | 900 | $1,245 | $1.38 | 45d | 1 | 0.75mi |
| 701 Fairview Ave NE Grand Rapids, MI | 1.0 | 1.0 | 1000 | $1,300 | $1.30 | 45d | 1 | 0.81mi |
| 711 Clancy Ave NE Grand Rapids, MI | 2.0 | 1.0 | 837 | $1,345 | $1.61 | 45d | 1 | 0.82mi |
| 814 Broadway Ave NW Grand Rapids, MI | 1.0 | 1.0 | 900 | $1,100 | $1.22 | 45d | 1 | 0.83mi |
| 1044 Muskegon Ave NW Unit 2 Grand Rapids, MI | 3.0 | 1.0 | 1100 | $1,800 | $1.64 | 45d | 1 | 0.86mi |
| 417 6th St NW Unit 1346768P Grand Rapids, MI | 2.0 | 1.0 | 742 | $2,794 | $3.77 | 45d | 1 | 0.89mi |
| 1314 Portland Ave NE Grand Rapids, MI | 2.0 | 1.0 | 908 | $1,425 | $1.57 | 45d | 1 | 0.90mi |
| 439 More St NE Unit 2 Grand Rapids, MI | 1.0 | 1.0 | 700 | $1,100 | $1.57 | 45d | 1 | 0.91mi |
| 601 Bond Ave NW Grand Rapids, MI | 1.0–2.0 | 1.0–2.0 | 853 | $2,565 | $3.01 | 45d | 10 | 0.92mi |
| 555 7th St NW Grand Rapids, MI | 2.0–4.0 | 2.0 | 547 | $640 | $1.17 | 45d | 6 | 0.97mi |
| 734 Crosby St NW Unit 1 Grand Rapids, MI | 3.0 | 1.0 | 1057 | $1,800 | $1.70 | 45d | 1 | 0.97mi |
| 600 Broadway Ave NW Grand Rapids, MI | 1.0 | 1.0–2.0 | 952 | $2,450 | $2.57 | 46d | 2 | 1.05mi |
| 600 Broadway Ave NW Grand Rapids, MI | 1.0 | 1.0–2.0 | 952 | $2,438 | $2.56 | 45d | 2 | 1.05mi |
| 818 Grand Ave NE Apt D Grand Rapids, MI | 2.0 | 1.0 | 850 | $1,400 | $1.65 | 45d | 1 | 1.06mi |
| 1004 Jennette Ave NW Grand Rapids, MI | 3.0 | 1.0 | 1000 | $1,025 | $1.02 | 45d | 1 | 1.12mi |
| 1011 Jennette Ave NW Unit 2 Grand Rapids, MI | 2.0 | 1.0 | 720 | $1,450 | $2.01 | 45d | 1 | 1.15mi |
| 201 Michigan St NW Grand Rapids, MI | 1.0–2.0 | 1.0–2.0 | 981 | $2,800 | $2.85 | 45d | 10 | 1.15mi |
| 900 Leonard St NW Grand Rapids, MI | 2.0 | 1.0–2.0 | 720 | $2,850 | $3.96 | 4d | 10 | 1.19mi |
| 1019 Widdicomb Ave NW Unit 2 Grand Rapids, MI | 2.0 | 1.0 | 1000 | $1,575 | $1.57 | 45d | 1 | 1.26mi |
| 2317 Coit Ave NE Grand Rapids, MI | 2.0 | 1.0 | 1087 | $1,700 | $1.56 | 45d | 1 | 1.27mi |
| 745 Stocking Ave NW Grand Rapids, MI | 1.0–2.0 | 1.0 | 879 | $1,541 | $1.75 | 16d | 3 | 1.30mi |
| 619 Emerald Ave NE Unit 8 Grand Rapids, MI | 1.0 | 1.0 | 656 | $1,400 | $2.13 | 45d | 1 | 1.30mi |
Listing history 10 events
-
2026-06-21statusdays on market $199,975 Pending 9 DOM
-
2026-06-18days on market $199,975 Active 7 DOM
-
2026-06-17days on market $199,975 Active 6 DOM
-
2026-06-16status $199,975 Active 5 DOM
-
2026-06-10status $199,975 Pending 5 DOM
-
2026-06-09days on market $199,975 Active 5 DOM
-
2026-06-08days on market $199,975 Active 4 DOM
-
2026-06-07days on market $199,975 Active 3 DOM
-
2026-06-05remarks 667-char remark
-
2026-06-05$199,975 Active 1 DOM
ⓘ Source: listings_history table (triggers on properties + properties_extension) + one-shot
backfill from property_details.listing_events for pre-trigger history.
Tax reassessment forecast MI · Partial reset (capped growth)
- Current annual tax
- $1,268 · $106/mo
- Projected year-2 tax
- $2,174 · $181/mo
- Expected delta
- +$906/yr (+$75/mo · 71.4%)
ⓘ Screening estimate from a state-policy table — verify with the county assessor before closing.
Climate risk First Street
- Flood 1/10 Low FEMA zone X (unshaded) · 0% chance over 30 yrs
- Wildfire 1/10 Low
- Heat 2/10 Low 7 d/yr ≥96°F today · 16 d/yr by 30 yrs out
- Wind 2/10 Low
- Air quality 3/10 Moderate 2 unhealthy d/yr today · 3 by 30 yrs out
Nearby sold comps map
Loading sold comps map…
Walkable amenities ~0.75 mi
Loading nearby amenities…
Taxation est. · year 1
- Rental income
- $20,352
- − Mortgage interest
- −$11,202
- − Property taxes
- −$1,268
- − Insurance
- −$1,000
- − Repairs & maintenance
- −$1,628
- − Management
- −$1,628
- − Depreciation
- −$5,817
- Taxable loss
- −$2,192
- Est. tax savings @ 24.0%
- +$526
- After-tax cash flow
- $1,752/yr
For passive investors: Depreciation is non-cash, so a rental often shows a tax loss while cash-flowing — sheltering income. Rental losses are passive: they offset passive income freely, and up to $25,000/yr can offset ordinary (W-2) income if you actively participate and your MAGI is under $100k (phasing out to $0 by $150k); unused losses carry forward. On sale, claimed depreciation is recaptured at up to 25%, and gains may owe capital-gains tax (a 1031 exchange can defer both). Figures are a year-1 estimate at your 24.0% rate — not tax advice; consult a CPA.
Schools (NCES district)
- District
- Grand Rapids Public Schools
- NCES district ID
- 2616440
- Math proficiency
- 15% ▼ -5.00%
- Reading proficiency
- 29% ▼ -1.00%
- Median HH income
- $40,612
- Composite
- 18.62/100
- National rank
- #8899
- State rank
- #451 of 540 in MI
Livability — Grand Rapids
- Score
- 83/100
- State rank
- #44
- US rank
- #939
Category grades
Schools grade is shown separately in the Schools card above.
Census & demographics
- Census place
- Grand Rapids, MI
- County
- Kent County · 533,805 people
- City population
- 181,325
- Metro
- Grand Rapids-Kentwood, MI
- Population (ZIP)
- 32,426
- Household income
- $74,906
- Rent vs Own
- Severe rent burden
- 1330.0
Population outlook (Kent County) Hauer SSP2
- Today (2025)
- 712,484 people
- By 2030
- 748,618 · +5.1%
- By 2040
- 814,777 · +14.4%
- By 2050
- 868,556 · +21.9%
- By 2075
- 966,487 · +35.7%
- By 2100
- 967,975 · +35.9%
Race, ethnicity, and origin ACS 2023
- Neighborhood character
- Predominantly White (68%)
- Race & ethnicity
- White 68% Black 14% Two or more races 11% Hispanic / Latino 8% Asian 3%
- Hispanic origin (detail)
- Mexican 5% Puerto Rican 1%
- Common ancestry
- Iranian 12% Romanian 8% Italian 3%
- Foreign-born
- 6% · Canada, China, Vietnam
- Languages at home
- 92% English-only · Spanish 3% Chinese 1% Other Indo-European 1%
Political lean MEDSL · Kent
- 2024 margin
- Lean D (+5.4) · D 51.8% · R 46.5% · Other 1.7%
- 2008→2024 swing
- +4.8pp toward D · 2008: 0.5pp · 2024: 5.4pp
- All cycles
- 2024: D+5.4 2020: D+6.1 2016: R+3.1 2012: R+7.9 2008: D+0.5
Not yet ingested
- Civics
- —
Market trends
- HPI YoY
- ▼ -324.57%
- Current HPI
- 306.797
- Rent YoY
- ▲ 4.55%
- Metro
- Grand Rapids-Kentwood, MI
- State GDP YoY
- ▲ 1.37%
- F500 in state
- 28
Industry mix (Fortune 500 HQ in MI)
| Industry | F500 HQs | Revenue |
|---|---|---|
| Automotive Parts | 3 | $48B |
|
||
| Automotive | 2 | $372B |
|
||
| Chemicals | 1 | $45B |
|
||
| Automotive Retail | 1 | $29B |
|
||
| Healthcare / Medical Devices | 1 | $23B |
|
||
| Automotive Technology | 1 | $20B |
|
||
Price history
+703.1% since first listed11 events — show timeline
- 2026-06-04 Listed $199,975 SW Michigan MLS
- 2026-06-04 Listed $199,975 REALCOMP
- 2026-06-04 Listed $199,975 MiRealSource-MiMLS
- 2015-01-31 Listing Removed — SW Michigan MLS
- 1997-02-27 Sold (MLS) $23,900 REALCOMP
- 1997-02-27 Sold (MLS) $23,900 SW Michigan MLS
- 1996-11-27 Listed $23,900 REALCOMP
- 1996-11-27 Listed $23,900 SW Michigan MLS
- 1994-09-03 Listing Removed — REALCOMP
- 1994-04-03 Listed $24,900 REALCOMP
- 1994-04-03 Listed $24,900 SW Michigan MLS
Property tax history
+1.5%/yrLatest (2025): $1,268 · +2.7% YoY. Source: county tax records.
Cash-flow waterfall
monthlySold comps — $/sqft
last 12 mo · ≤1 miLoading sold comps…