 Duplex
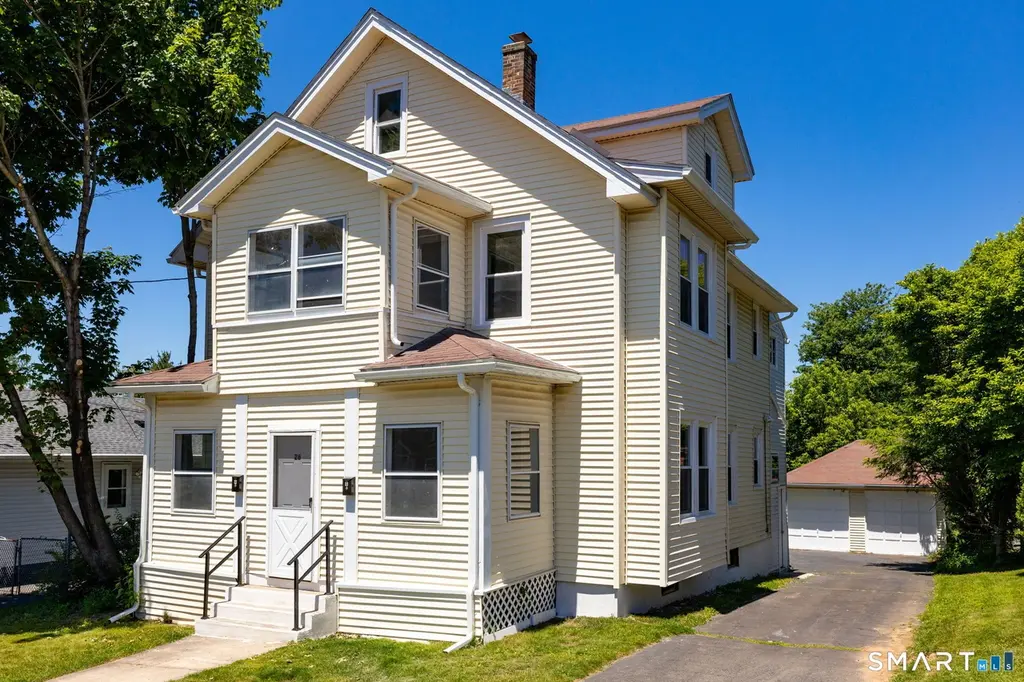
26 Magnolia St · New Britain, CT
Flood risk 1/10 · Minimal
- FEMA flood zone
- X (unshaded)
- Chance of flooding over 30 yrs
- 0.0%
- Est. flood insurance / yr
- $473 – $860
Fire risk 1/10 · Minimal
- Est. fire insurance / yr
- $829 – $1,539
Heat risk 5/10 · Moderate
- Hot days now (above 97°F)
- 7 days/yr
- Hot days in 30 yrs
- 16 days/yr
Wind risk 6/10 · Moderate
- Chance of severe wind over 30 yrs
- 27.0%
Air-quality risk 3/10 · Minor
- Unhealthy air days now
- 2 days/yr
- Unhealthy air days in 30 yrs
- 3 days/yr
Risk factors via First Street. Map © Google.
Why this score? — see what drove the D grade
The composite is a weighted blend of 9 inputs, each scored 0–100. Each bar is that input's sub-score; the figure is the points it added to the 100-point composite (weight × sub-score).
- Appreciation +10.0/10.0
- Cash flow +8.0/30.0
- ARV discount +7.5/15.0
- Rent growth +3.7/5.0
- Livability +3.7/5.0
- 1% rule +2.6/10.0
- Condition / age +2.5/5.0
- DSCR +2.0/10.0
- Schools +1.0/10.0
$419,900
🖨 Deal sheet 📄 Offer letter ✓ Due diligence
Multi-family units
County records classify this as Multi-Family (2-4 Unit). Listing-text estimate: 2 units. confirmed
Listing remarks MLS
Two-family fixer-upper with solid bones. Located at 26 Magnolia St, New Britain. Vinyl siding, detached 2-car garage. Good layout in both units with strong value-add potential. Ideal for investor or owner-occupant. Convenient location. Property needs work and is priced accordingly. Great opportunity. HIGHEST AND BEST SUBMITTED BY MONDAY 2/9/26 @12NOON
Key facts
- Two-family residence
- Brand-new windows
- Updated lighting
Tags
Property features AI
Finance
- Other:
- Financial info:
- HOA & community:
Exterior
- Parking: Detached garage; 2-car garage
- Security:
- Utilities: Public water connected; Public sewer connected; Electric hot water; Heating fuel: electric and natural gas
- Home design: Multi-family, 2-family property; Yellow exterior
- Construction: Concrete foundation; Concrete construction; Asphalt shingle roof; Vinyl siding
- Exterior features: Porch; Gutters; Garden area; Exterior lighting; Lightly wooded, level lot
Interior
- Kitchen:
- Bedrooms: 4 bedrooms
- Flooring:
- Bathrooms: 2 full bathrooms
- Heating & cooling: Baseboard heating; Hot water heating; Radiator heating
- Interior features: 8 total rooms; Full basement with storage; Finished, heated walk-up attic; Home automation for outlets, lighting, and thermostats
- Laundry & utility: Basement laundry hookups
Neighborhood map
What this means for you Summary
Snapshot
- This is a 2 × 2-bed/1.0-bath units multifamily listed at $420k.
Deal economics
- At list price, monthly cash flow is $-430 ($-5k/yr) — negative. Per door: $-215/mo.
- To cash-flow at today's rent, offer at most $344k (18.1% below list).
- To meet the 1% rule (rent ≥ 1% of price), the offer needs to be $318k (24.2% below list).
- Recommended offer: $318k (24.2% below list) — sets the bar for 1% rule.
Location & tenants
- Location reads 74/100 on livability (#67 in CT, #4,936 nationally) — a middle-class / working-renter tenant base. Strengths: health & safety A+, cost of living A, housing A; Watch: crime D, employment D, schools F.
- New Britain School District (suburban): math 6% / reading 17% proficiency, ranked #153 of 153 in CT (top 100%) — low school quality limits family demand, transient renter base, plan for 1-2y turnover; 71% free/reduced lunch — lower-income household profile, screen leases tightly.
- Market conditions: Rents rising fast (+4.9%/yr); 69 active listings in the ZIP; 22 comparable units currently listed for rent nearby; rentals at typical pace (median 24d on market — plan ~3-4 weeks tenant-placement turnaround); 1,867 units permitted in Capitol Planning Region in 2024 (1,399 in 5+ unit buildings).
- At $3,184/mo this rent would consume 61% of the median local household income ($63k/yr) (locally 1835% of renters already pay >50% of income on rent) — very limited rent-growth headroom before tenants either downsize or default.
Forward outlook
- In year one you build about $45k of equity ($3k loan paydown + $42k appreciation (10.0% local appreciation)).
- By year 2, paydown + projected appreciation supports a ~$72k cash-out refi (75% LTV) — recoverable capital for the next deal without selling this one.
Negotiation context
- Only 6 days on market — expect competitive offers; lowballing is unlikely to land.
- 2 sale attempts with the ask held roughly flat each time — persistent listings suggest the price (not the market) is what's stuck; bring a comps-based counter.
- Current owner paid $241k; list at $420k implies a 74% gain — meaningful room to come down on a strong offer.
Risks & watch-outs
- Watch-outs: built in 1926 — expect roof / HVAC / electrical / plumbing capex.
- Climate carrying-cost: major wind risk, 27% chance of damaging wind over 30y; extreme-heat days projected 7→16/yr by 2055 (HVAC capex compounding) — expect insurance premiums to compound above CPI over the hold.
Questions for the listing agent
- What do current leases actually rent for vs. the listed asking? Can we see a recent rent roll and the last 12 months of T-12 income?
- Can we see the unit-by-unit rent roll, current vacancy, and any below-market leases? What's the average tenancy length?
- What capital expenditures (roof, boiler, parking lot, exteriors) have been made in the last 5 years, and what's planned in the next 2?
- Built in 1926 — when were the roof, HVAC, electrical panel, plumbing, and water heater last replaced?
- Is there a deadline driving the sale (1031 exchange, divorce, estate, relocation)? That informs how much negotiation room exists.
- Schools are F-rated, which usually means shorter tenancies and higher turnover. Who's the typical renter profile here, and what's been the actual vacancy rate?
- Crime grade is D in this area — have there been break-ins, vandalism, or insurance claims at this property in the last 3 years? What carrier currently insures it and at what premium?
- The area grade is low — what's the realistic commute time and amenity access for the typical tenant pool here? Any planned neighborhood developments (good or bad) we should know about?
- What's the average days-on-market for RENTAL listings here right now (not sales)? A rising rental-DOM trend means longer vacancies and softer asking-rent achievability than the comps imply.
- What's the recent tenant-quality profile in this submarket — average credit score on applications, eviction rate, late-payment / NSF rate, and stable-employment percentage? A property-management company in the area should have these aggregated.
- How much new apartment / multifamily construction is in the pipeline within 1–3 miles? Heavy new supply (>2% of stock underway) typically softens rents 12–24 months out; light construction supports rent growth.
Investment metrics
- 1% rule
- 0.76% ✗
- Cap rate
- 5.06%
- Cash-on-cash
- -4.39%
- DSCR
- 0.80
- GRM
- 11.0
CMA / ARV
- ARV (on-the-fly)
- $241,600
- Comps found
- 12
Show comp detail 12 sales within ~0.75 mi
| Address | Dist | Beds/Ba | Sqft | Sold | Price | $/sf | Match |
|---|---|---|---|---|---|---|---|
| 26 Magnolia St | 0.00mi | 4/2.0 | 1,600 (0%) | 4mo | $241,000 | $151 | 97 |
| 48 Gladiola St | 0.08mi | 4/2.0 | 1,596 (-0%) | 17mo | $366,500 | $230 | 82 |
| 122 Wilcox St | 0.41mi | 5/2.0 (+1) | 1,668 (+4%) | 8mo | $325,000 | $195 | 62 |
| 324 Oak St | 0.34mi | 5/2.5 (+1) | 1,613 (+1%) | 18mo | $200,000 | $124 | 61 |
| 71 Oakland Ave | 0.49mi | 4/2.0 | 1,500 (-6%) | 9mo | $210,000 | $140 | 60 |
| 314 Allen St | 0.35mi | 4/2.0 | 1,724 (+8%) | 18mo | $207,000 | $120 | 55 |
| 432 McClintock St | 0.42mi | 3/2.0 (-1) | 1,371 (-14%) | 2mo | $302,000 | $220 | 50 |
| 278 Oak St | 0.39mi | 5/2.0 (+1) | 1,728 (+8%) | 22mo | $275,000 | $159 | 45 |
| 53 Carlton St | 0.44mi | 4/2.0 | 1,768 (+10%) | 21mo | $340,000 | $192 | 44 |
| 108 Clark St | 0.72mi | 5/2.0 (+1) | 1,576 (-2%) | 22mo | $220,000 | $140 | 41 |
| 122 Clark St | 0.69mi | 5/2.0 (+1) | 1,752 (+10%) | 23mo | $235,000 | $134 | 28 |
| 144 Clark St | 0.65mi | 5/2.0 (+1) | 1,794 (+12%) | 22mo | $180,000 | $100 | 26 |
Match score weights: distance 35% · size 25% · config 20% · recency 20%. Top-matched comps best support the ARV.
Projected returns pro-forma
10.0% appreciation · 4.94% rent growth · sell at horizon
- IRR
- 21.7%
- Equity multiple
- 2.77×
- Total profit
- $207,695
- Equity at exit
- $378,279
- IRR
- 20.0%
- Equity multiple
- 6.51×
- Total profit
- $647,235
- Equity at exit
- $815,773
Cash invested: $117,572 (down + closing). Projections, not guarantees.
Landlord ↔ Tenant lean methodology
- Overall (STATE)
- 27 Tenant-Leaning
- State Connecticut
- 27 Tenant-Leaning · D+7
- County
- — inherits STATE
- City
- — inherits STATE
ZIP-level market 06053
- Home prices YoY
- 15.4%
- Rents YoY
- 4.9%
- Active inventory
- 69
- Price-to-rent
- 22.0×
Monthly cashflow live
- Estimated rent
- $3,184 high interval (Pro) →
- Mortgage (P&I)
- −$2,202
- Tax from tax record
- −$569 /mo · $6,824/yr
- Insurance
- −$175
- HOA
- −$0
- Vacancy / Maint / Mgmt
- −$669
- Net cashflow
- $-430
Break-even live
2-unit breakdown (identical units grouped — click to expand)
| Units | Beds | Baths | Est. rent |
|---|---|---|---|
| 2× units | 2 | 1 | $3,184 |
| #1 | 2 | 1 | $1,592 |
| #2 | 2 | 1 | $1,592 |
| Total (2 units) | $3,184 | ||
UW: 25.0% down · 7.5% · 30yr · 1.5% tax · 5.0% vac · 8.0% maint · 8.0% mgmt
Financing live
Cash to close
- Down payment
- $104,975
- Closing costs
- $12,597
- Reserves months
- —
- Total cash needed
- —
Loan-product check · same deal, 3 products live
Conventional
25% down · 7.5% · 30yr
- Down + closing
- —
- Monthly P&I
- —
- Monthly cashflow
- —
- DSCR
- —
- Eligible?
- —
Personal DTI + credit; lowest rate.
DSCR
20% down · 8.5% · 30yr
- Down + closing
- —
- Monthly P&I
- —
- Monthly cashflow
- —
- DSCR
- —
- Eligible?
- —
No personal income docs; deal must DSCR.
Hard money
10% down · 12.0% · 12mo
- Down + closing
- —
- Monthly P&I
- —
- Monthly cashflow
- —
- DSCR
- —
- Eligible?
- —
Short-term bridge; refi at stabilization.
Rent comps 22 comps
| Address | Beds | Baths | Sqft | Rent | $/sqft | DOM | Units | Dist |
|---|---|---|---|---|---|---|---|---|
| 422 Allen St New Britain, CT | 3.0 | 1.0 | 1276 | $1,800 | $1.41 | 14d | 1 | 0.55mi |
| 125 Overlook Ave Unit 2nd Floor New Britain, CT | 3.0 | 1.0 | 1166 | $2,000 | $1.72 | 3d | 1 | 0.58mi |
| 27 Janet Dr Unit 1st Floor New Britain, CT | 3.0 | 1.0 | 1581 | $2,300 | $1.45 | 23d | 1 | 0.71mi |
| 189 Daly Ave New Britain, CT | 3.0 | 1.0 | 1250 | $1,900 | $1.52 | 14d | 1 | 0.75mi |
| 36 Stratford Rd New Britain, CT | 4.0 | 1.0 | 1092 | $2,400 | $2.20 | 43d | 1 | 0.75mi |
| 13 Bartlett St Unit 2nd Floor New Britain, CT | 4.0 | 1.0 | 1100 | $2,500 | $2.27 | 19d | 1 | 0.77mi |
| 1366 Stanley St New Britain, CT | 4.0 | 1.0 | 1944 | $2,400 | $1.23 | 43d | 1 | 0.78mi |
| 250 Oakland Ave #2 New Britain, CT | 3.0 | 1.0 | 1160 | $2,100 | $1.81 | 2d | 1 | 0.80mi |
| 24 Oak St Unit 2 New Britain, CT | 3.0 | 1.0 | 1300 | $1,607 | $1.24 | 16d | 1 | 0.81mi |
| 182 Washington St Unit 3S New Britain, CT | 3.0 | 1.0 | 1300 | $1,650 | $1.27 | 23d | 1 | 0.86mi |
| 182 Washington St Unit 182-A New Britain, CT | 3.0 | 1.0 | 1300 | $1,700 | $1.31 | 23d | 1 | 0.86mi |
| 45 Union St New Britain, CT | 5.0 | 2.0 | 2060 | $2,800 | $1.36 | 23d | 1 | 0.90mi |
| 17 Foxon Pl New Britain, CT | 4.0 | 1.5 | 1453 | $2,400 | $1.65 | 1d | 1 | 0.91mi |
| 170 Hillcrest Ave New Britain, CT | 4.0 | 1.0 | 1118 | $2,400 | $2.15 | 1d | 1 | 0.95mi |
| 27 Euston St New Britain, CT | 4.0 | 1.0 | 1152 | $2,400 | $2.08 | 1d | 1 | 1.00mi |
| 371 Broad St Unit 1st Floor New Britain, CT | 3.0 | 1.0 | 1128 | $1,900 | $1.68 | 43d | 1 | 1.13mi |
| 24 Dean Dr New Britain, CT | 3.0 | 1.0 | 1200 | $2,000 | $1.67 | 1d | 1 | 1.14mi |
| 21 Olive St Unit 2S New Britain, CT | 3.0 | 1.0 | 1100 | $1,600 | $1.45 | 23d | 1 | 1.17mi |
| 17 Pinehurst Ave Unit 2nd Floor New Britain, CT | 3.0 | 1.0 | 1144 | $1,900 | $1.66 | 23d | 1 | 1.23mi |
| 59 Dwight St New Britain, CT | 3.0 | 1.0 | 1200 | $1,800 | $1.50 | 43d | 1 | 1.33mi |
| 59 Dwight St Unit 3RD New Britain, CT | 3.0 | 1.0 | 1200 | $1,800 | $1.50 | 23d | 1 | 1.33mi |
| 416 Park St Unit 3 New Britain, CT | 3.0 | 1.0 | 1221 | $2,100 | $1.72 | 2d | 1 | 1.49mi |
Listing history 7 events
-
2026-06-13status $419,900 Under Contract 6 DOM
-
2026-06-10days on market $419,900 Active 6 DOM
-
2026-06-09days on market $419,900 Active 5 DOM
-
2026-06-08days on market $419,900 Active 4 DOM
-
2026-06-07days on market $419,900 Active 3 DOM
-
2026-06-05remarks 699-char remark
-
2026-06-05$419,900 Active 1 DOM
ⓘ Source: listings_history table (triggers on properties + properties_extension) + one-shot
backfill from property_details.listing_events for pre-trigger history.
Tax reassessment forecast CT · Partial reset (capped growth)
- Current annual tax
- $6,824 · $569/mo
- Projected year-2 tax
- $7,905 · $659/mo
- Expected delta
- +$1,081/yr (+$90/mo · 15.8%)
ⓘ Screening estimate from a state-policy table — verify with the county assessor before closing.
Climate risk First Street
- Flood 1/10 Low FEMA zone X (unshaded) · 0% chance over 30 yrs
- Wildfire 1/10 Low
- Heat 5/10 Major 7 d/yr ≥97°F today · 16 d/yr by 30 yrs out
- Wind 6/10 Major 27% chance of damaging wind over 30 yrs
- Air quality 3/10 Moderate 2 unhealthy d/yr today · 3 by 30 yrs out
Nearby sold comps map
Loading sold comps map…
Walkable amenities ~0.75 mi
Loading nearby amenities…
Taxation est. · year 1
- Rental income
- $38,208
- − Mortgage interest
- −$23,521
- − Property taxes
- −$6,824
- − Insurance
- −$2,100
- − Repairs & maintenance
- −$3,057
- − Management
- −$3,057
- − Depreciation
- −$12,215
- Taxable loss
- −$12,565
- Est. tax savings @ 24.0%
- +$3,016
- After-tax cash flow
- $-2,148/yr
For passive investors: Depreciation is non-cash, so a rental often shows a tax loss while cash-flowing — sheltering income. Rental losses are passive: they offset passive income freely, and up to $25,000/yr can offset ordinary (W-2) income if you actively participate and your MAGI is under $100k (phasing out to $0 by $150k); unused losses carry forward. On sale, claimed depreciation is recaptured at up to 25%, and gains may owe capital-gains tax (a 1031 exchange can defer both). Figures are a year-1 estimate at your 24.0% rate — not tax advice; consult a CPA.
Schools (NCES district)
- District
- New Britain School District
- NCES district ID
- 0902670
- Math proficiency
- 6% ▼ -6.00%
- Reading proficiency
- 17% ▼ -5.00%
- Median HH income
- $40,827
- Composite
- 9.95/100
- National rank
- #9816
- State rank
- #153 of 153 in CT
Livability — New Britain
- Score
- 74/100
- State rank
- #67
- US rank
- #4936
Category grades
Schools grade is shown separately in the Schools card above.
Census & demographics
- Census place
- New Britain, CT
- County
- Hartford County · 754,208 people
- City population
- 66,322
- Metro
- Hartford-East Hartford-Middletown, CT
- Population (ZIP)
- 36,774
- Household income
- $62,645
- Rent vs Own
- Severe rent burden
- 1835.0
Population outlook (Capitol County) Hauer SSP2
- By 2040
- 1,063,519
Race, ethnicity, and origin ACS 2023
- Neighborhood character
- Diverse neighborhood (Simpson 0.64)
- Race & ethnicity
- White 47% Hispanic / Latino 36% Two or more races 13% Black 10% Asian 3%
- Hispanic origin (detail)
- Mexican 1% Puerto Rican 25% Dominican 4%
- Common ancestry
- Romanian 19% Lithuanian 3% Russian 1%
- Foreign-born
- 22% · Canada, Vietnam, China
- Languages at home
- 50% English-only · Spanish 26% Russian/Polish/Slavic 15% French/Haitian/Cajun 3%
Political lean MEDSL · Capitol
- 2024 margin
- Strong D (+21.9) · D 60.1% · R 38.2% · Other 1.7%
- All cycles
- 2024: D+21.9
Not yet ingested
- Civics
- —
Market trends
- HPI YoY
- ▲ 65.76%
- Current HPI
- 491.4724
- Rent YoY
- ▲ 4.94%
- Metro
- Hartford-East Hartford-Middletown, CT
- State GDP YoY
- ▲ 1.06%
- F500 in state
- 38
Industry mix (Fortune 500 HQ in CT)
| Industry | F500 HQs | Revenue |
|---|---|---|
| Industrial Machinery | 4 | $38B |
|
||
| Insurance | 3 | $71B |
|
||
| Financial Services | 2 | $25B |
|
||
| Transportation / Logistics | 2 | $18B |
|
||
| Healthcare | 1 | $247B |
|
||
| Telecommunications | 1 | $55B |
|
||
Price history
+180.1% since first listed5 events — show timeline
- 2026-06-04 Listed $419,900 Smart MLS
- 2026-03-02 Sold (Public Records) $241,000 Public Records
- 2026-02-27 Sold (MLS) $241,000 Smart MLS
- 2026-02-09 Pending — Smart MLS
- 2026-02-05 Listed $149,900 Smart MLS
Property tax history
+3.2%/yrLatest (2025): $6,824 · +2.4% YoY. Source: county tax records.
Cash-flow waterfall
monthlySold comps — $/sqft
last 12 mo · ≤1 miLoading sold comps…