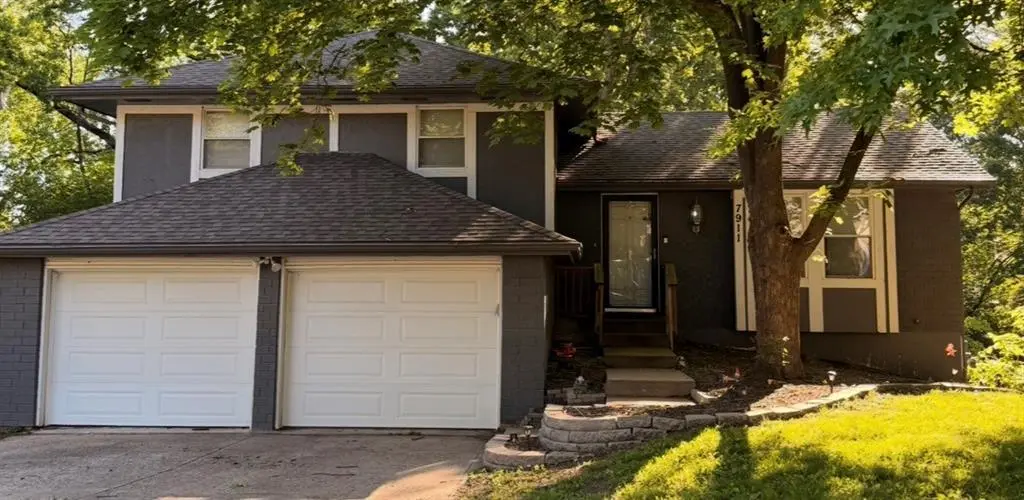
7911 N Stoddard Ave · Kansas City, MO
Flood risk 1/10 · Minimal
- FEMA flood zone
- X (unshaded)
- Chance of flooding over 30 yrs
- 0.0%
- Est. flood insurance / yr
- $473 – $860
Fire risk 1/10 · Minimal
- Est. fire insurance / yr
- $1,054 – $1,958
Heat risk 4/10 · Minor
- Hot days now (above 107°F)
- 7 days/yr
- Hot days in 30 yrs
- 17 days/yr
Wind risk 2/10 · Minimal
- Chance of severe wind over 30 yrs
- —
Air-quality risk 2/10 · Minimal
- Unhealthy air days now
- 2 days/yr
- Unhealthy air days in 30 yrs
- 2 days/yr
Risk factors via First Street. Map © Google.
Why this score? — see what drove the D- grade
The composite is a weighted blend of 9 inputs, each scored 0–100. Each bar is that input's sub-score; the figure is the points it added to the 100-point composite (weight × sub-score).
- Appreciation +10.0/10.0
- Cash flow +7.0/30.0
- ARV discount +4.7/15.0
- Schools +4.5/10.0
- Rent growth +4.3/5.0
- Livability +3.9/5.0
- Condition / age +2.5/5.0
- 1% rule +1.6/10.0
- DSCR +1.2/10.0
$320,000
🖨 Deal sheet 📄 Offer letter ✓ Due diligence
Listing remarks MLS
Beautiful home completely remodeled throughout! Gorgeous eat-in kitchen with upgraded cabinets, granite countertops and new LVT flooring! Nice family room w all new paint and carpet! Terrific rec room w newly tiled fireplace! 3 large bedrooms w all new paint and carpet! All bathrooms remodeled w updated tiles, flooring and vanities! Double tiered deck! Wonderful lot with mature trees. Award winning park hill schools! Priced for fast sale
Key facts
- 0.25 acre lot
- 2 garage spots
- Built 1979
Property features AI
Exterior
- Parking: Attached garage facing front; 2-car garage
- Utilities: Public water; Public sewer; Electric cooling; Forced air heating
- Home design: Single family residence; Residential property; Tri-level floor plan; Living area approximately 1,552; Below-grade finished area present
- Construction: Frame construction; Composition roof; Full basement
- Exterior features: Deck; City lot
Interior
- Kitchen: Dishwasher; Disposal; Electric range; Refrigerator; Eat-in kitchen
- Bedrooms: 3 bedrooms
- Bathrooms: 2 full baths; 1 half bath
- Interior features: Ceiling fan(s); Pantry; Fireplace in the family room; Family room on garage level
- Laundry & utility: Washer and dryer; Laundry on lower level
Neighborhood map
What this means for you Summary
Snapshot
- This is a 3-bed/2.5-bath single-family listed at $320k.
Deal economics
- At list price, monthly cash flow is $-467 ($-6k/yr) — negative.
- To cash-flow at today's rent, offer at most $237k (25.8% below list).
- To meet the 1% rule (rent ≥ 1% of price), the offer needs to be $210k (34.4% below list).
- Recommended offer: $210k (34.4% below list) — sets the bar for 1% rule.
Location & tenants
- Location reads 78/100 on livability (#28 in MO, #2,671 nationally) — a middle-class / working-renter tenant base. Strengths: amenities A+, commute A+, cost of living A+; Watch: crime F.
- Park Hill (urban): math 47% / reading 54% proficiency, ranked #26 of 324 in MO (top 8%) — acceptable for families but not a draw, mixed tenant base, ~2y average lease.
- Zoned schools: Prairie Point Elem. (math 49% / reading 48%, grade D, #334 of 1,115 statewide, top 30%, 422 students, 29% FRL); Park Hill High (math 70% / reading 71%, grade B+, #9 of 521 statewide, top 2%, 1,857 students, 25% FRL).
- Market conditions: Rents rising fast (+7.0%/yr); 264 active listings in the ZIP; 13 comparable units currently listed for rent nearby; rentals leasing fast (median 4d on market — plan ~1-2 weeks tenant-placement turnaround); high-income renter base; 234 units permitted in Platte County in 2024 (0 in 5+ unit buildings).
Forward outlook
- In year one you build about $34k of equity ($2k loan paydown + $32k appreciation (10.0% local appreciation)).
- Platte County population projected at +31% by 2050 — long-run rental-demand tailwind backs the buy-and-hold thesis.
- By year 2, paydown + projected appreciation supports a ~$55k cash-out refi (75% LTV) — recoverable capital for the next deal without selling this one.
Negotiation context
- Only 7 days on market — expect competitive offers; lowballing is unlikely to land.
- 4 sale attempts since 7y ago with the ask held roughly flat each time — persistent listings suggest the price (not the market) is what's stuck; bring a comps-based counter.
Questions for the listing agent
- What do current leases actually rent for vs. the listed asking? Can we see a recent rent roll and the last 12 months of T-12 income?
- Built in 1979 — when were the roof, HVAC, electrical panel, plumbing, and water heater last replaced?
- Is there a deadline driving the sale (1031 exchange, divorce, estate, relocation)? That informs how much negotiation room exists.
- Crime grade is F in this area — have there been break-ins, vandalism, or insurance claims at this property in the last 3 years? What carrier currently insures it and at what premium?
- The area grade is low — what's the realistic commute time and amenity access for the typical tenant pool here? Any planned neighborhood developments (good or bad) we should know about?
- What's the average days-on-market for RENTAL listings here right now (not sales)? A rising rental-DOM trend means longer vacancies and softer asking-rent achievability than the comps imply.
- What's the recent tenant-quality profile in this submarket — average credit score on applications, eviction rate, late-payment / NSF rate, and stable-employment percentage? A property-management company in the area should have these aggregated.
- How much new for-sale + rental construction is in the pipeline within 1–3 miles? Heavy new supply typically softens prices + rents 12–24 months out; constrained supply supports both.
Investment metrics
- 1% rule
- 0.66% ✗
- Cap rate
- 4.54%
- Cash-on-cash
- -6.26%
- DSCR
- 0.72
- GRM
- 12.7
CMA / ARV
- ARV (median comp)
- $301,114
- List price
- $320,000
- Delta
- 6.27%
- Verdict
- FAIR
- Comps
- 20 within 1.0 mi
Show comp detail 12 sales within ~0.75 mi
| Address | Dist | Beds/Ba | Sqft | Sold | Price | $/sf | Match |
|---|---|---|---|---|---|---|---|
| 7316 NW 78th St | 0.12mi | 3/2.5 | 1,626 (+5%) | 1mo | $315,000 | $194 | 86 |
| 7425 NW 79th St | 0.13mi | 3/2.5 | 1,497 (-4%) | 3mo | $319,900 | $214 | 86 |
| 6915 NW 79th Ter | 0.16mi | 3/1.5 | 1,612 (+4%) | 1mo | $310,000 | $192 | 81 |
| 7009 NW 80th St | 0.09mi | 3/2.0 | 1,676 (+8%) | 0mo | $290,000 | $173 | 81 |
| 6927 NW 76th Ter | 0.34mi | 3/2.0 | 1,558 (+0%) | 3mo | $281,000 | $180 | 79 |
| 6929 NW 80th St | 0.14mi | 3/2.0 | 1,640 (+6%) | 4mo | $269,900 | $165 | 79 |
| 8042 N Stoddard Ave | 0.19mi | 3/2.5 | 1,697 (+9%) | 2mo | $315,000 | $186 | 73 |
| 7314 NW 73rd Ter | 0.75mi | 3/2.0 | 1,548 (-0%) | 2mo | $299,000 | $193 | 61 |
| 6905 NW 75th St | 0.57mi | 3/1.0 | 1,480 (-5%) | 2mo | $239,900 | $162 | 58 |
| 8126 NW 77th Ct | 0.67mi | 3/2.5 | 1,680 (+8%) | 0mo | $365,000 | $217 | 55 |
| 7308 NW Hemple Ave | 0.74mi | 3/2.0 | 1,688 (+9%) | 4mo | $230,000 | $136 | 46 |
| 7313 N Avalon St | 0.73mi | 3/2.0 | 1,713 (+10%) | 2mo | $265,000 | $155 | 45 |
Match score weights: distance 35% · size 25% · config 20% · recency 20%. Top-matched comps best support the ARV.
Projected returns pro-forma
10.0% appreciation · 7.03% rent growth · sell at horizon
- IRR
- 20.9%
- Equity multiple
- 2.71×
- Total profit
- $153,357
- Equity at exit
- $288,281
- IRR
- 19.8%
- Equity multiple
- 6.54×
- Total profit
- $496,091
- Equity at exit
- $621,690
Cash invested: $89,600 (down + closing). Projections, not guarantees.
Landlord ↔ Tenant lean methodology
- Overall (STATE)
- 81 Strongly Landlord-Friendly
- State Missouri
- 81 Strongly Landlord-Friendly · R+10
- County
- — inherits STATE
- City
- — inherits STATE
ZIP-level market 64152
- Home prices YoY
- 4.7%
- Rents YoY
- 7.0%
- Active inventory
- 264
- Price-to-rent
- 12.7×
Monthly cashflow live
- Estimated rent
- $2,099 high interval (Pro) →
- Mortgage (P&I)
- −$1,678
- Tax from tax record
- −$314 /mo · $3,765/yr
- Insurance
- −$133
- HOA
- −$0
- Vacancy / Maint / Mgmt
- −$441
- Net cashflow
- $-467
Break-even live
UW: 25.0% down · 7.5% · 30yr · 1.5% tax · 5.0% vac · 8.0% maint · 8.0% mgmt
Financing live
Cash to close
- Down payment
- $80,000
- Closing costs
- $9,600
- Reserves months
- —
- Total cash needed
- —
Loan-product check · same deal, 3 products live
Conventional
25% down · 7.5% · 30yr
- Down + closing
- —
- Monthly P&I
- —
- Monthly cashflow
- —
- DSCR
- —
- Eligible?
- —
Personal DTI + credit; lowest rate.
DSCR
20% down · 8.5% · 30yr
- Down + closing
- —
- Monthly P&I
- —
- Monthly cashflow
- —
- DSCR
- —
- Eligible?
- —
No personal income docs; deal must DSCR.
Hard money
10% down · 12.0% · 12mo
- Down + closing
- —
- Monthly P&I
- —
- Monthly cashflow
- —
- DSCR
- —
- Eligible?
- —
Short-term bridge; refi at stabilization.
Rent comps 13 comps
| Address | Beds | Baths | Sqft | Rent | $/sqft | DOM | Units | Dist |
|---|---|---|---|---|---|---|---|---|
| 8199 NW Milrey Dr Kansas City, MO | 3.0 | 2.5 | 1458 | $2,070 | $1.42 | 17d | 8 | 0.25mi |
| 6904 NW 78th St Kansas City, MO | 3.0 | 1.0 | 1450 | $1,799 | $1.24 | 21d | 1 | 0.26mi |
| 7641 N Stoddard Ave Kansas City, MO | 3.0 | 2.0 | 1766 | $2,200 | $1.25 | 43d | 1 | 0.30mi |
| 8101 NW Barrybrooke Dr Kansas City, MO | 1.0–3.0 | 1.0–2.0 | 1020 | $2,166 | $2.12 | 1d | 27 | 0.65mi |
| 8310 NW 77th Ter Kansas City, MO | 4.0 | 2.5 | 1792 | $2,399 | $1.34 | 4d | 1 | 0.75mi |
| 6905 NW 72nd Ter Kansas City, MO | 3.0 | 1.0 | 1465 | $2,000 | $1.37 | 4d | 1 | 0.91mi |
| 8320 N Nodaway Ave Kansas City, MO | 3.0 | 2.5 | 1600 | $1,995 | $1.25 | 43d | 1 | 0.91mi |
| 8787 NW Prairie View Rd Kansas City, MO | 2.0 | 1.0–2.0 | 1046 | $2,331 | $2.23 | 1d | 8 | 0.97mi |
| 8811 N Congress Ave Kansas City, MO | 1.0–3.0 | 1.0–2.0 | 1029 | $2,028 | $1.97 | 1d | 16 | 1.21mi |
| 8940 N Shannon Ave Kansas City, MO | 1.0–2.0 | 1.0–2.0 | 937 | $2,049 | $2.19 | 1d | 23 | 1.25mi |
| 8504 N Cosby Ave Kansas City, MO | 1.0–3.0 | 1.0–2.0 | 1110 | $1,987 | $1.79 | 3d | 18 | 1.27mi |
| 6449 NW 70th St Kansas City, MO | 1.0–2.0 | 1.0–2.0 | 939 | $1,687 | $1.80 | 3d | 9 | 1.43mi |
| 7441 NW Old Tiffany Springs Rd Kansas City, MO | 1.0–2.0 | 1.0–2.0 | 958 | $1,695 | $1.77 | 4d | 2 | 1.45mi |
Listing history 10 events
-
2026-05-07historical $320,000 11-char remark
-
2020-03-17soldstatus
-
2020-03-16soldstatus Sold 441-char remark
Show marketing remark (441 chars)
Beautiful home completely remodeled throughout! Gorgeous eat-in kitchen with upgraded cabinets, granite countertops and new LVT flooring! Nice family room w all new paint and carpet! Terrific rec room w newly tiled fireplace! 3 large bedrooms w all new paint and carpet! All bathrooms remodeled w updated tiles, flooring and vanities! Double tiered deck! Wonderful lot with mature trees. Award winning park hill schools! Priced for fast sale
-
2020-02-16status Pending 441-char remark
Show marketing remark (441 chars)
Beautiful home completely remodeled throughout! Gorgeous eat-in kitchen with upgraded cabinets, granite countertops and new LVT flooring! Nice family room w all new paint and carpet! Terrific rec room w newly tiled fireplace! 3 large bedrooms w all new paint and carpet! All bathrooms remodeled w updated tiles, flooring and vanities! Double tiered deck! Wonderful lot with mature trees. Award winning park hill schools! Priced for fast sale
-
2020-02-14$224,950 Active 441-char remark
Show marketing remark (441 chars)
Beautiful home completely remodeled throughout! Gorgeous eat-in kitchen with upgraded cabinets, granite countertops and new LVT flooring! Nice family room w all new paint and carpet! Terrific rec room w newly tiled fireplace! 3 large bedrooms w all new paint and carpet! All bathrooms remodeled w updated tiles, flooring and vanities! Double tiered deck! Wonderful lot with mature trees. Award winning park hill schools! Priced for fast sale
-
2019-11-12historical
-
2019-10-28price $159,950
-
2019-10-23status Active
-
2019-10-10status Pending
-
2019-10-08$169,950 Active
ⓘ Source: listings_history table (triggers on properties + properties_extension) + one-shot
backfill from property_details.listing_events for pre-trigger history.
Tax reassessment forecast MO · Resets to sale price
- Current annual tax
- $3,765 · $314/mo
- Projected year-2 tax
- $3,765 · $314/mo
- Expected delta
- $0/yr ($0/mo · 0.0%)
ⓘ Screening estimate from a state-policy table — verify with the county assessor before closing.
Climate risk First Street
- Flood 1/10 Low FEMA zone X (unshaded) · 0% chance over 30 yrs
- Wildfire 1/10 Low
- Heat 4/10 Moderate 7 d/yr ≥107°F today · 17 d/yr by 30 yrs out
- Wind 2/10 Low
- Air quality 2/10 Low 2 unhealthy d/yr today · 2 by 30 yrs out
Nearby sold comps map
Loading sold comps map…
Walkable amenities ~0.75 mi
Loading nearby amenities…
Taxation est. · year 1
- Rental income
- $25,185
- − Mortgage interest
- −$17,925
- − Property taxes
- −$3,765
- − Insurance
- −$1,600
- − Repairs & maintenance
- −$2,015
- − Management
- −$2,015
- − Depreciation
- −$9,309
- Taxable loss
- −$11,444
- Est. tax savings @ 24.0%
- +$2,747
- After-tax cash flow
- $-2,860/yr
For passive investors: Depreciation is non-cash, so a rental often shows a tax loss while cash-flowing — sheltering income. Rental losses are passive: they offset passive income freely, and up to $25,000/yr can offset ordinary (W-2) income if you actively participate and your MAGI is under $100k (phasing out to $0 by $150k); unused losses carry forward. On sale, claimed depreciation is recaptured at up to 25%, and gains may owe capital-gains tax (a 1031 exchange can defer both). Figures are a year-1 estimate at your 24.0% rate — not tax advice; consult a CPA.
Schools (NCES district)
- District
- Park Hill
- NCES district ID
- 2923550
- Math proficiency
- 47% ▼ -3.00%
- Reading proficiency
- 54% ▼ -3.00%
- Median HH income
- $67,616
- Composite
- 44.86/100
- National rank
- #2723
- State rank
- #26 of 324 in MO
Livability — Kansas City
- Score
- 78/100
- State rank
- #28
- US rank
- #2671
Category grades
Schools grade is shown separately in the Schools card above.
Census & demographics
- Census place
- Kansas City, MO
- County
- Platte County · 100,198 people
- City population
- 439,467
- Metro
- Kansas City, MO-KS
- Population (ZIP)
- 31,545
- Household income
- $114,688
- Rent vs Own
- Severe rent burden
- 234.0
Population outlook (Platte County) Hauer SSP2
- Today (2025)
- 111,772 people
- By 2030
- 119,173 · +6.6%
- By 2040
- 133,326 · +19.3%
- By 2050
- 146,617 · +31.2%
- By 2075
- 178,626 · +59.8%
- By 2100
- 195,638 · +75.0%
Race, ethnicity, and origin ACS 2023
- Neighborhood character
- Predominantly White (82%)
- Race & ethnicity
- White 82% Hispanic / Latino 7% Two or more races 6% Black 3% Asian 2%
- Hispanic origin (detail)
- Mexican 5% Puerto Rican 1%
- Common ancestry
- Romanian 4% Italian 4% Slovak 4%
- Foreign-born
- 4% · Canada, China
- Languages at home
- 93% English-only · Spanish 3% Other Indo-European 1% German/W. Germanic 1%
Political lean MEDSL · Platte
- 2024 margin
- Toss-up / Even · D 47.7% · R 50.8% · Other 1.4%
- 2008→2024 swing
- +3.2pp toward D · 2008: -6.4pp · 2024: -3.1pp
- All cycles
- 2024: R+3.1 2020: R+3.0 2016: R+13.0 2012: R+14.2 2008: R+6.4
Not yet ingested
- Civics
- —
Market trends
- HPI YoY
- ▲ 33.10%
- Current HPI
- 739.89
- Rent YoY
- ▲ 7.03%
- Metro
- Kansas City, MO-KS
- State GDP YoY
- ▲ 1.84%
- F500 in state
- 20
Industry mix (Fortune 500 HQ in MO)
| Industry | F500 HQs | Revenue |
|---|---|---|
| Healthcare | 1 | $163B |
|
||
| Insurance | 1 | $21B |
|
||
| Industrial Technology | 1 | $17B |
|
||
| Retail | 1 | $16B |
|
||
| Industrial Distribution | 1 | $10B |
|
||
| Utilities | 1 | $9B |
|
||
Price history
+88.3% since first listed12 events — show timeline
- 2026-05-27 Pending — Heartland MLS as Distributed by MLS Grid
- 2026-05-21 Listed $320,000 Heartland MLS as Distributed by MLS Grid
- 2026-05-07 Coming Soon $320,000 Heartland MLS as Distributed by MLS Grid
- 2020-03-17 Sold (Public Records) — Public Records
- 2020-03-16 Sold (MLS) — Heartland MLS as Distributed by MLS Grid
- 2020-02-16 Pending — Heartland MLS as Distributed by MLS Grid
- 2020-02-14 Listed $224,950 Heartland MLS as Distributed by MLS Grid
- 2019-11-12 Listing Removed — Heartland MLS as Distributed by MLS Grid
- 2019-10-28 Price Changed $159,950 Heartland MLS as Distributed by MLS Grid
- 2019-10-23 Relisted — Heartland MLS as Distributed by MLS Grid
- 2019-10-10 Pending — Heartland MLS as Distributed by MLS Grid
- 2019-10-08 Listed $169,950 Heartland MLS as Distributed by MLS Grid
Property tax history
+8.7%/yrLatest (2025): $3,765 · +11.6% YoY. Source: county tax records.
Cash-flow waterfall
monthlySold comps — $/sqft
last 12 mo · ≤1 miLoading sold comps…