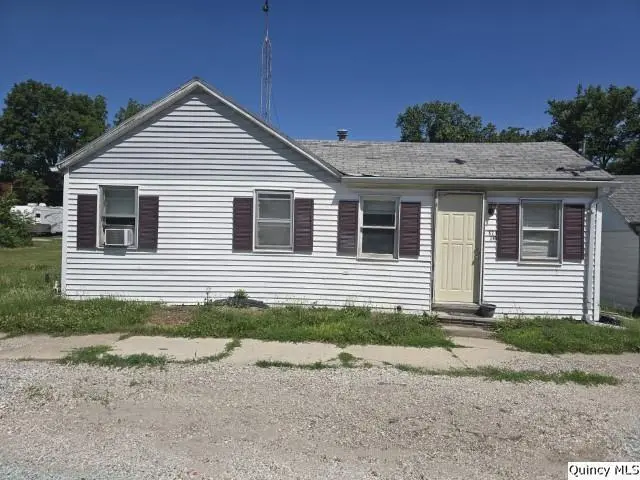
87 E 3rd St · Dallas City, IL
Flood risk 6/10 · Moderate
- FEMA flood zone
- X (unshaded)
- Chance of flooding over 30 yrs
- 0.74%
- Est. flood insurance / yr
- $473 – $860
Fire risk 1/10 · Minimal
- Est. fire insurance / yr
- $804 – $1,492
Heat risk 3/10 · Minor
- Hot days now (above 106°F)
- 7 days/yr
- Hot days in 30 yrs
- 16 days/yr
Wind risk 2/10 · Minimal
- Chance of severe wind over 30 yrs
- —
Air-quality risk 2/10 · Minimal
- Unhealthy air days now
- 0 days/yr
- Unhealthy air days in 30 yrs
- 1 days/yr
Risk factors via First Street. Map © Google.
Why this score? — see what drove the B grade
The composite is a weighted blend of 9 inputs, each scored 0–100. Each bar is that input's sub-score; the figure is the points it added to the 100-point composite (weight × sub-score).
- Cash flow +30.0/30.0
- 1% rule +10.0/10.0
- DSCR +10.0/10.0
- ARV discount +7.5/15.0
- Appreciation +5.2/10.0
- Livability +3.3/5.0
- Rent growth +2.5/5.0
- Schools +2.5/10.0
- Condition / age +2.2/5.0
$21,000
🖨 Deal sheet 📄 Offer letter ✓ Due diligence
Listing remarks
Consider this as an investment property or possibly a starter home!! This home offers a kitchen, full bathroom, enclosed back porch, living room, & one bedroom. There is natural gas forced air heat and electric water heater present in the partial/unfinished basement. A small outbuilding offers additional storage in the backyard.
Key facts
- Enclosed back porch
- Full bathroom
- Small outbuilding
Tags
Property features AI
Finance
- Other: Possession subject to tenant's rights
Exterior
- Utilities: Public water
- Home design: Detached single-family home; One-story
- Construction: Vinyl siding; Asphalt roof
- Exterior features: 50 x 120 lot; Zoned single-family
Interior
- Kitchen: Range; Refrigerator
- Bedrooms: One bedroom on the main level; One additional possible bedroom on the main level
- Flooring: Carpet in rooms and living areas
- Bathrooms: One full bathroom
- Heating & cooling: Forced air heating; Natural gas heating
- Interior features: Unfinished partial basement
- Laundry & utility: Washer; Electric water heater
Neighborhood map
What this means for you Summary
Snapshot
- This is a 1-bed/1.0-bath single-family listed at $21k. Condition is rated fair.
Deal economics
- At list price, monthly cash flow is $471 ($6k/yr) — positive.
- The deal already cash-flows at list — no discount required.
- Meets the 1% rule at list price ($780 rent vs $21k).
Location & tenants
- Location reads 66/100 on livability (#549 in IL) — a middle-class / working-renter tenant base. Strengths: crime A+, cost of living A+, housing A+; Watch: health & safety C-, employment D+, amenities F.
- Illini West H S District 307 (town): math 25% / reading 25% proficiency, ranked #611 of 919 in IL (top 66%) — low school quality limits family demand, transient renter base, plan for 1-2y turnover.
- Zoned schools: Illini West High School (math 17% / reading 27%, grade F, #319 of 693 statewide, top 50%, 342 students, 0% FRL).
- Market conditions: 17 active listings in the ZIP.
Forward outlook
- In year one you build about $225 of equity ($145 loan paydown + $80 appreciation (0.4% local appreciation)).
- Hancock County population projected at -30% by 2050 — secular population decline; favor cash flow + early exit over multi-decade hold.
- At projected returns (0.4% appreciation + 3.0% rent growth), your $6k cash investment doubles in ~2 years — after that, you're playing with house money.
Negotiation context
- Only 14 days on market — expect competitive offers; lowballing is unlikely to land.
Risks & watch-outs
- Watch-outs: built in 1885 — expect roof / HVAC / electrical / plumbing capex.
- Climate carrying-cost: major flood risk — expect insurance premiums to compound above CPI over the hold.
Questions for the listing agent
- Have any recent inspections been done? Can we get a copy of the seller's disclosures and any deferred-maintenance estimates?
- Built in 1885 — when were the roof, HVAC, electrical panel, plumbing, and water heater last replaced?
- Is there a deadline driving the sale (1031 exchange, divorce, estate, relocation)? That informs how much negotiation room exists.
- Schools are F-rated, which usually means shorter tenancies and higher turnover. Who's the typical renter profile here, and what's been the actual vacancy rate?
- What's the average days-on-market for RENTAL listings here right now (not sales)? A rising rental-DOM trend means longer vacancies and softer asking-rent achievability than the comps imply.
- What's the recent tenant-quality profile in this submarket — average credit score on applications, eviction rate, late-payment / NSF rate, and stable-employment percentage? A property-management company in the area should have these aggregated.
- How much new for-sale + rental construction is in the pipeline within 1–3 miles? Heavy new supply typically softens prices + rents 12–24 months out; constrained supply supports both.
Investment metrics
- 1% rule
- 3.72% ✓
- Cap rate
- 33.22%
- Cash-on-cash
- 96.16%
- DSCR
- 5.28
- GRM
- 2.2
CMA / ARV
- ARV (on-the-fly)
- $7,680
- Comps found
- 1
Show comp detail 1 sale within ~0.75 mi
| Address | Dist | Beds/Ba | Sqft | Sold | Price | $/sf | Match |
|---|---|---|---|---|---|---|---|
| 591 W 2nd St | 0.57mi | 1/1.0 | 728 (+14%) | 15mo | $8,750 | $12 | 38 |
Match score weights: distance 35% · size 25% · config 20% · recency 20%. Top-matched comps best support the ARV.
Projected returns pro-forma
0.38% appreciation · 3.0% rent growth · sell at horizon
- IRR
- 98.9%
- Equity multiple
- 6.07×
- Total profit
- $29,785
- Equity at exit
- $6,499
- IRR
- 99.9%
- Equity multiple
- 12.53×
- Total profit
- $67,816
- Equity at exit
- $8,140
Cash invested: $5,880 (down + closing). Projections, not guarantees.
Landlord ↔ Tenant lean methodology
- Overall (STATE)
- 43 Moderately Tenant-Leaning
- State Illinois
- 43 Moderately Tenant-Leaning · D+7
- County
- — inherits STATE
- City
- — inherits STATE
ZIP-level market 62330
- Home prices YoY
- 0.3%
- Active inventory
- 17
- Price-to-rent
- 2.2×
Monthly cashflow live
- Estimated rent
- $780 medium interval (Pro) →
- Mortgage (P&I)
- −$110
- Tax est. 1.5%
- −$26 /mo · $315/yr
- Insurance
- −$9
- HOA
- −$0
- Vacancy / Maint / Mgmt
- −$164
- Net cashflow
- $471
Break-even live
UW: 25.0% down · 7.5% · 30yr · 1.5% tax · 5.0% vac · 8.0% maint · 8.0% mgmt
Financing live
Cash to close
- Down payment
- $5,250
- Closing costs
- $630
- Reserves months
- —
- Total cash needed
- —
Loan-product check · same deal, 3 products live
Conventional
25% down · 7.5% · 30yr
- Down + closing
- —
- Monthly P&I
- —
- Monthly cashflow
- —
- DSCR
- —
- Eligible?
- —
Personal DTI + credit; lowest rate.
DSCR
20% down · 8.5% · 30yr
- Down + closing
- —
- Monthly P&I
- —
- Monthly cashflow
- —
- DSCR
- —
- Eligible?
- —
No personal income docs; deal must DSCR.
Hard money
10% down · 12.0% · 12mo
- Down + closing
- —
- Monthly P&I
- —
- Monthly cashflow
- —
- DSCR
- —
- Eligible?
- —
Short-term bridge; refi at stabilization.
Listing history 12 events
-
2026-06-19days on market $21,000 Active 14 DOM
-
2026-06-18days on market $21,000 Active 13 DOM
-
2026-06-17days on market $21,000 Active 12 DOM
-
2026-06-16days on market $21,000 Active 11 DOM
-
2026-06-15days on market $21,000 Active 10 DOM
-
2026-06-13days on market $21,000 Active 8 DOM
-
2026-06-12days on market $21,000 Active 7 DOM
-
2026-06-09days on market $21,000 Active 4 DOM
-
2026-06-08days on market $21,000 Active 3 DOM
-
2026-06-07days on market $21,000 Active 2 DOM
-
2026-06-07remarks 332-char remark
-
2026-06-07$21,000 Active 1 DOM
ⓘ Source: listings_history table (triggers on properties + properties_extension) + one-shot
backfill from property_details.listing_events for pre-trigger history.
Climate risk First Street
- Flood 6/10 Major FEMA zone X (unshaded) · 74% chance over 30 yrs
- Wildfire 1/10 Low
- Heat 3/10 Moderate 7 d/yr ≥106°F today · 16 d/yr by 30 yrs out
- Wind 2/10 Low
- Air quality 2/10 Low 0 unhealthy d/yr today · 1 by 30 yrs out
Nearby sold comps map
Loading sold comps map…
Walkable amenities ~0.75 mi
Loading nearby amenities…
Taxation est. · year 1
- Rental income
- $9,362
- − Mortgage interest
- −$1,176
- − Property taxes
- −$315
- − Insurance
- −$105
- − Repairs & maintenance
- −$749
- − Management
- −$749
- − Depreciation
- −$611
- Taxable income
- $5,657
- Est. tax owed @ 24.0%
- −$1,358
- After-tax cash flow
- $4,297/yr
For passive investors: Depreciation is non-cash, so a rental often shows a tax loss while cash-flowing — sheltering income. Rental losses are passive: they offset passive income freely, and up to $25,000/yr can offset ordinary (W-2) income if you actively participate and your MAGI is under $100k (phasing out to $0 by $150k); unused losses carry forward. On sale, claimed depreciation is recaptured at up to 25%, and gains may owe capital-gains tax (a 1031 exchange can defer both). Figures are a year-1 estimate at your 24.0% rate — not tax advice; consult a CPA.
Condition & rehab AI · 14 photos
This home requires moderate renovations, including organizing the kitchen, replacing the shower curtain, and updating the flooring and paint. These updates will significantly improve its resale and rental value.
Repairs flagged
- Minor Kitchen cabinets — The cabinets are in good condition, but the clutter suggests a need for organization.
- Minor Bathroom shower curtain — The shower curtain is dated and could be replaced for a fresh look.
- Moderate Flooring — The carpeted flooring in the kitchen and living areas is dated and may need replacement.
- Minor Paint — Peeling paint in some areas suggests a need for touch-ups or repainting.
Value-add opportunities
- Both Organize the kitchen and replace the shower curtain — These updates will improve the home's appearance and functionality, making it more attractive to potential buyers or renters.
- Both Replace the carpeted flooring with hardwood or tile — This will significantly improve the home's curb appeal and increase its value.
- Both Repaint the interior walls — Fresh paint can make a big difference in the home's appearance and can be a cost-effective way to boost its value.
Renovation cost estimate screening
| Repair item | Severity | Est. cost |
|---|---|---|
| Kitchen cabinets · The cabinets are in good condition, but the clutter suggests a need for organization. | Minor | $500–3,000 |
| Bathroom shower curtain · The shower curtain is dated and could be replaced for a fresh look. | Minor | $500–3,000 |
| Flooring · The carpeted flooring in the kitchen and living areas is dated and may need replacement. | Moderate | $3,000–15,000 |
| Paint · Peeling paint in some areas suggests a need for touch-ups or repainting. | Minor | $500–3,000 |
| Total estimated repair cost · 4 items | $4,500–24,000 |
Value-add ROI direction
- Both Organize the kitchen and replace the shower curtain — These updates will improve the home's appearance and functionality, making it more attractive to potential buyers or renters. ↑
- Both Replace the carpeted flooring with hardwood or tile — This will significantly improve the home's curb appeal and increase its value. ↑
- Both Repaint the interior walls — Fresh paint can make a big difference in the home's appearance and can be a cost-effective way to boost its value. ↑
ⓘ Cost ranges are severity-bucket heuristics (US national rule-of-thumb). Get contractor quotes + a written scope before underwriting a rehab budget.
Schools (NCES district)
- District
- Illini West H S District 307
- NCES district ID
- 1701384
- Math proficiency
- 25% ▲ 5.00%
- Reading proficiency
- 25% ▲ 5.00%
- Median HH income
- $47,745
- Composite
- 24.88/100
- National rank
- #12997
- State rank
- #611 of 919 in IL
Livability — Dallas City
- Score
- 66/100
- State rank
- #549
- US rank
- #11621
Category grades
Schools grade is shown separately in the Schools card above.
Census & demographics
- Census place
- Dallas City, IL
- Population (ZIP)
- 1,548
Population outlook (Hancock County) Hauer SSP2
- Today (2025)
- 17,042 people
- By 2030
- 16,056 · -5.8%
- By 2040
- 13,912 · -18.4%
- By 2050
- 11,879 · -30.3%
- By 2075
- 8,302 · -51.3%
- By 2100
- 5,846 · -65.7%
Race, ethnicity, and origin ACS 2023
- Neighborhood character
- Predominantly White (93%)
- Race & ethnicity
- White 93% Hispanic / Latino 6% Two or more races 3%
- Hispanic origin (detail)
- Mexican 5%
- Common ancestry
- Lithuanian 4% Italian 2% Iranian 1%
- Foreign-born
- 2% · Canada
- Languages at home
- 95% English-only · Spanish 4%
Political lean MEDSL · Hancock
- 2024 margin
- Solid R (+50.0) · D 24.1% · R 74.1% · Other 1.8%
- 2008→2024 swing
- -39.2pp toward R · 2008: -10.8pp · 2024: -50.0pp
- All cycles
- 2024: R+50.0 2020: R+48.9 2016: R+50.8 2012: R+19.0 2008: R+10.8
Not yet ingested
- Civics
- —
Market trends
- HPI YoY
- ▲ 0.38%
- Current HPI
- 133.3962
- Rent YoY
- —
- Metro
- —
- State GDP YoY
- ▲ 1.59%
- F500 in state
- 60
Industry mix (Fortune 500 HQ in IL)
| Industry | F500 HQs | Revenue |
|---|---|---|
| Insurance | 4 | $201B |
|
||
| Consumer Goods | 4 | $87B |
|
||
| Industrial Machinery | 3 | $64B |
|
||
| Healthcare | 2 | $55B |
|
||
| Retail / Pharmacy | 1 | $148B |
|
||
| Agriculture / Food | 1 | $86B |
|
||
Price history
1 event — show timeline
- 2026-06-05 Listed $21,000 MRED as Distributed by MLS Grid
Cash-flow waterfall
monthlySold comps — $/sqft
last 12 mo · ≤1 miLoading sold comps…