 Duplex
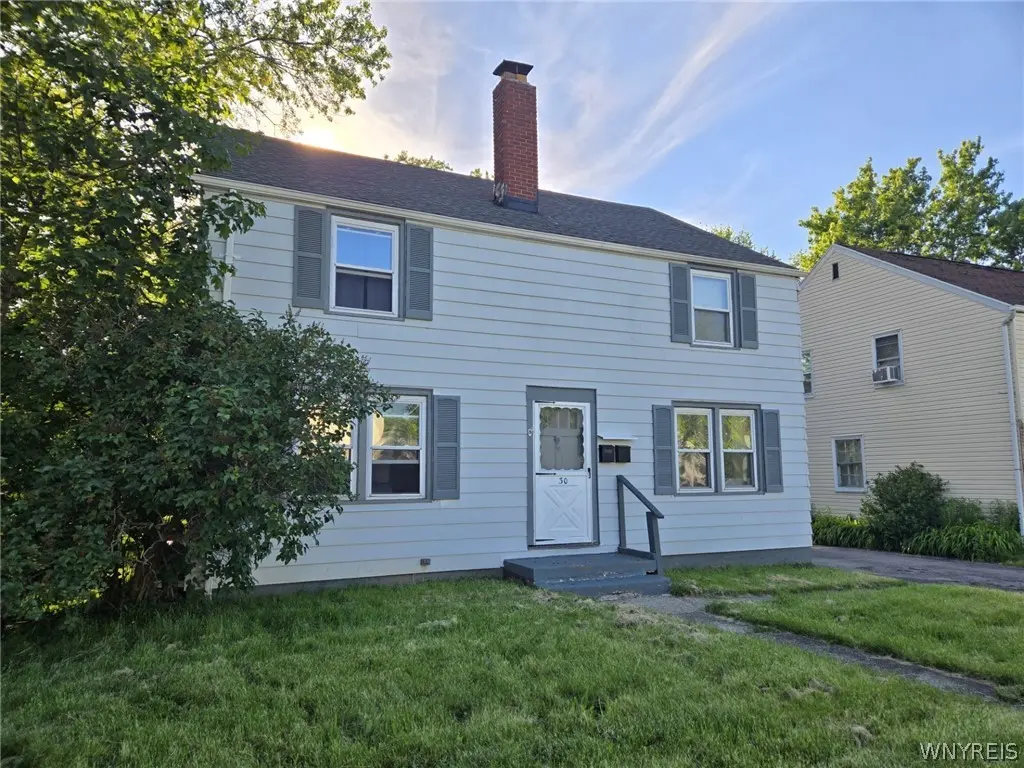
30 Ellen Dr · Cheektowaga, NY
Flood risk 1/10 · Minimal
- FEMA flood zone
- X (unshaded)
- Chance of flooding over 30 yrs
- 0.0%
- Est. flood insurance / yr
- $473 – $860
Fire risk 1/10 · Minimal
- Est. fire insurance / yr
- $691 – $1,283
Heat risk 2/10 · Minimal
- Hot days now (above 92°F)
- 7 days/yr
- Hot days in 30 yrs
- 15 days/yr
Wind risk 1/10 · Minimal
- Chance of severe wind over 30 yrs
- —
Air-quality risk 3/10 · Minor
- Unhealthy air days now
- 2 days/yr
- Unhealthy air days in 30 yrs
- 3 days/yr
Risk factors via First Street. Map © Google.
Why this score? — see what drove the B grade
The composite is a weighted blend of 9 inputs, each scored 0–100. Each bar is that input's sub-score; the figure is the points it added to the 100-point composite (weight × sub-score).
- Cash flow +26.2/30.0
- ARV discount +12.5/15.0
- DSCR +8.9/10.0
- 1% rule +7.9/10.0
- Schools +5.9/10.0
- Livability +4.2/5.0
- Rent growth +2.5/5.0
- Condition / age +2.5/5.0
- Appreciation +0.0/10.0
$223,000
🖨 Deal sheet 📄 Offer letter ✓ Due diligence
Multi-family units
County records classify this as Multi-Family (2-4 Unit). Listing-text estimate: 2 units. confirmed
Listing remarks
Opportunity knocks with this side-by-side two-family home located in the sought-after Maryvale School District. Located just minutes from shopping, dining, major highways, and everyday amenities! Both units have a similar layout featuring a kitchen with separate dining area and a spacious living room on the first floor and upstairs has 2 good-sized bedrooms and a full bath. Full basement with glass block windows and both hot water tanks and furnaces were installed in 2018. The property includes separate utilities, laundry hook-ups, off-street parking, and a 2-car garage. Whether you’re looking to expand your portfolio or live in one unit while generating income from the others, this h
Key facts
- Separate utilities
- Two-family home
- Full basement
Tags
Property features AI
Finance
- Financial info: Owner pays water; water included in rent; Operating expenses include water (multi-unit)
Exterior
- Parking: Detached or attached 2-car garage; Paved parking
- Utilities: Public water connected; Sewer connected; Circuit breaker electric service
- Home design: 2-story multi-family property; Existing condition
- Construction: Aluminum siding; Block foundation; Asphalt shingle roof; Copper and PEX plumbing
- Exterior features: Patio; Rectangular residential lot; City street frontage; Lot dimensions approximately 83 x 119
Interior
- Bedrooms: 2 dwelling units (multi-family property)
- Flooring: Carpet; Hardwood; Varies
- Bathrooms: 2 full bathrooms (total)
- Heating & cooling: Gas forced-air heating
- Interior features: Varied flooring including carpet and hardwood; Full basement
- Laundry & utility: Gas water heater
Neighborhood map
What this means for you Summary
Snapshot
- This is a 2 × 2-bed/1.0-bath units multifamily listed at $223k.
Deal economics
- At list price, monthly cash flow is $569 ($7k/yr) — positive. Per door: $285/mo.
- The deal already cash-flows at list — no discount required.
- Meets the 1% rule at list price ($3k rent vs $223k).
- Cap rate 9.4% vs local median 3.8% in Cheektowaga — top-decile yield for the area; either an underpriced asset or a hidden risk that comps aren't pricing in. Stress-test before assuming the spread holds.
Location & tenants
- Location reads 84/100 on livability (#54 in NY, #811 nationally) — a professional / high-income tenant draw. Strengths: commute A+, housing A+, health & safety A+; Watch: crime C-.
- Cheektowaga-Maryvale Union Free School District (urban): math 67% / reading 73% proficiency, ranked #154 of 590 in NY (top 26%) — strong family-tenant draw, lease renewals of 3-5y typical.
- Market conditions: 207 active listings in the ZIP; 4 comparable units currently listed for rent nearby; rentals leasing fast (median 3d on market — plan ~1-2 weeks tenant-placement turnaround); 1,244 units permitted in Erie County in 2024 (563 in 5+ unit buildings).
- At $2,868/mo this rent would consume 51% of the median local household income ($67k/yr) (locally 991% of renters already pay >50% of income on rent) — very limited rent-growth headroom before tenants either downsize or default.
Forward outlook
- Local home prices are declining (-3.0%/yr); year-one equity from $2k of loan paydown is wiped out by about $7k of value loss. Plan a longer hold.
- At projected returns (-3.0% appreciation + 3.0% rent growth), your $62k cash investment doubles in ~10 years — after that, you're playing with house money.
Negotiation context
- Only 9 days on market — expect competitive offers; lowballing is unlikely to land.
- Current owner paid $95k; list at $223k implies a 135% gain — meaningful room to come down on a strong offer.
Risks & watch-outs
- Watch-outs: built in 1942 — expect roof / HVAC / electrical / plumbing capex.
Questions for the listing agent
- Can we see the unit-by-unit rent roll, current vacancy, and any below-market leases? What's the average tenancy length?
- What capital expenditures (roof, boiler, parking lot, exteriors) have been made in the last 5 years, and what's planned in the next 2?
- Built in 1942 — when were the roof, HVAC, electrical panel, plumbing, and water heater last replaced?
- Is there a deadline driving the sale (1031 exchange, divorce, estate, relocation)? That informs how much negotiation room exists.
- Schools are B-rated — typically a magnet for longer-tenancy family renters. What's the average tenant stay here, and is there a school-zone premium baked into asking?
- What's the average days-on-market for RENTAL listings here right now (not sales)? A rising rental-DOM trend means longer vacancies and softer asking-rent achievability than the comps imply.
- What's the recent tenant-quality profile in this submarket — average credit score on applications, eviction rate, late-payment / NSF rate, and stable-employment percentage? A property-management company in the area should have these aggregated.
- How much new apartment / multifamily construction is in the pipeline within 1–3 miles? Heavy new supply (>2% of stock underway) typically softens rents 12–24 months out; light construction supports rent growth.
Investment metrics
- 1% rule
- 1.29% ✓
- Cap rate
- 9.36%
- Cash-on-cash
- 10.94%
- DSCR
- 1.49
- GRM
- 6.5
CMA / ARV
- ARV (on-the-fly)
- $250,880
- Comps found
- 9
Show comp detail 9 sales within ~0.75 mi
| Address | Dist | Beds/Ba | Sqft | Sold | Price | $/sf | Match |
|---|---|---|---|---|---|---|---|
| 7 Matthew Ln | 0.09mi | 4/2.0 | 1,792 (0%) | 4mo | $250,000 | $140 | 92 |
| 1 Jean | 0.05mi | 4/2.0 | 1,798 (+0%) | 22mo | $270,000 | $150 | 79 |
| 24 Garden Rd | 0.12mi | 4/2.0 | 1,856 (+4%) | 12mo | $273,000 | $147 | 78 |
| 302 S Forest Rd | 0.43mi | 5/2.0 (+1) | 1,822 (+2%) | 6mo | $282,500 | $155 | 67 |
| 36 Montfort Dr | 0.20mi | 4/2.0 | 1,941 (+8%) | 17mo | $241,100 | $124 | 62 |
| 16 Wilshire Rd | 0.31mi | 4/2.0 | 1,930 (+8%) | 22mo | $201,350 | $104 | 55 |
| 4613 Union Rd | 0.47mi | 4/2.0 | 1,612 (-10%) | 9mo | $200,000 | $124 | 54 |
| 620 Beach Rd | 0.63mi | 4/2.0 | 1,600 (-11%) | 14mo | $224,000 | $140 | 41 |
| 18 Doyle Ct | 0.59mi | 5/2.5 (+1) | 1,926 (+8%) | 16mo | $340,000 | $177 | 39 |
Match score weights: distance 35% · size 25% · config 20% · recency 20%. Top-matched comps best support the ARV.
Projected returns pro-forma
-3.0% appreciation · 3.0% rent growth · sell at horizon
- IRR
- 0.1%
- Equity multiple
- 1.00×
- Total profit
- $272
- Equity at exit
- $33,250
- IRR
- 9.8%
- Equity multiple
- 1.76×
- Total profit
- $47,503
- Equity at exit
- $19,281
Cash invested: $62,440 (down + closing). Projections, not guarantees.
Landlord ↔ Tenant lean methodology
- Overall (STATE)
- 15 Strongly Tenant-Friendly
- State New York
- 15 Strongly Tenant-Friendly · D+10
- County
- — inherits STATE
- City
- — inherits STATE
ZIP-level market 14225
- Home prices YoY
- -27.3%
- Active inventory
- 207
- Price-to-rent
- 13.0×
Monthly cashflow live
- Estimated rent
- $2,868 high interval (Pro) →
- Mortgage (P&I)
- −$1,169
- Tax from tax record
- −$434 /mo · $5,207/yr
- Insurance
- −$93
- HOA
- −$0
- Vacancy / Maint / Mgmt
- −$602
- Net cashflow
- $569
Break-even live
2-unit breakdown (identical units grouped — click to expand)
| Units | Beds | Baths | Est. rent |
|---|---|---|---|
| 2× units | 2 | 1 | $2,868 |
| #1 | 2 | 1 | $1,434 |
| #2 | 2 | 1 | $1,434 |
| Total (2 units) | $2,868 | ||
UW: 25.0% down · 7.5% · 30yr · 1.5% tax · 5.0% vac · 8.0% maint · 8.0% mgmt
Financing live
Cash to close
- Down payment
- $55,750
- Closing costs
- $6,690
- Reserves months
- —
- Total cash needed
- —
Loan-product check · same deal, 3 products live
Conventional
25% down · 7.5% · 30yr
- Down + closing
- —
- Monthly P&I
- —
- Monthly cashflow
- —
- DSCR
- —
- Eligible?
- —
Personal DTI + credit; lowest rate.
DSCR
20% down · 8.5% · 30yr
- Down + closing
- —
- Monthly P&I
- —
- Monthly cashflow
- —
- DSCR
- —
- Eligible?
- —
No personal income docs; deal must DSCR.
Hard money
10% down · 12.0% · 12mo
- Down + closing
- —
- Monthly P&I
- —
- Monthly cashflow
- —
- DSCR
- —
- Eligible?
- —
Short-term bridge; refi at stabilization.
Rent comps 4 comps
| Address | Beds | Baths | Sqft | Rent | $/sqft | DOM | Units | Dist |
|---|---|---|---|---|---|---|---|---|
| 758 S Huth Rd Buffalo, NY | 5.0 | 2.0 | 2235 | $2,800 | $1.25 | 43d | 1 | 0.45mi |
| 512 Cayuga Rd Buffalo, NY | 3.0 | 1.0 | 1944 | $1,795 | $0.92 | 1d | 1 | 0.62mi |
| 239 Lehn Springs Dr Buffalo, NY | 3.0 | 1.0 | 1700 | $3,200 | $1.88 | 3d | 1 | 1.00mi |
| 44 Aurora Dr Buffalo, NY | 3.0 | 1.0 | 1272 | $3,300 | $2.59 | 1d | 1 | 1.47mi |
Listing history 7 events
-
2026-06-18days on market $223,000 Active 9 DOM
-
2026-06-17days on market $223,000 Active 8 DOM
-
2026-06-16days on market $223,000 Active 7 DOM
-
2026-06-15days on market $223,000 Active 6 DOM
-
2026-06-13days on market $223,000 Active 4 DOM
-
2026-06-10remarks 693-char remark
-
2026-06-10$223,000 Active 1 DOM
ⓘ Source: listings_history table (triggers on properties + properties_extension) + one-shot
backfill from property_details.listing_events for pre-trigger history.
Tax reassessment forecast NY · Partial reset (capped growth)
- Current annual tax
- $5,207 · $434/mo
- Projected year-2 tax
- $5,207 · $434/mo
- Expected delta
- $0/yr ($0/mo · 0.0%)
ⓘ Screening estimate from a state-policy table — verify with the county assessor before closing.
Climate risk First Street
- Flood 1/10 Low FEMA zone X (unshaded) · 0% chance over 30 yrs
- Wildfire 1/10 Low
- Heat 2/10 Low 7 d/yr ≥92°F today · 15 d/yr by 30 yrs out
- Wind 1/10 Low
- Air quality 3/10 Moderate 2 unhealthy d/yr today · 3 by 30 yrs out
Nearby sold comps map
Loading sold comps map…
Walkable amenities ~0.75 mi
Loading nearby amenities…
Taxation est. · year 1
- Rental income
- $34,416
- − Mortgage interest
- −$12,491
- − Property taxes
- −$5,207
- − Insurance
- −$1,115
- − Repairs & maintenance
- −$2,753
- − Management
- −$2,753
- − Depreciation
- −$6,487
- Taxable income
- $3,609
- Est. tax owed @ 24.0%
- −$866
- After-tax cash flow
- $5,967/yr
For passive investors: Depreciation is non-cash, so a rental often shows a tax loss while cash-flowing — sheltering income. Rental losses are passive: they offset passive income freely, and up to $25,000/yr can offset ordinary (W-2) income if you actively participate and your MAGI is under $100k (phasing out to $0 by $150k); unused losses carry forward. On sale, claimed depreciation is recaptured at up to 25%, and gains may owe capital-gains tax (a 1031 exchange can defer both). Figures are a year-1 estimate at your 24.0% rate — not tax advice; consult a CPA.
Schools (NCES district)
- District
- Cheektowaga-Maryvale Union Free School District
- NCES district ID
- 3618600
- Math proficiency
- 67% ▲ 11.00%
- Reading proficiency
- 73% ▲ 23.00%
- Median HH income
- $46,537
- Composite
- 59.02/100
- National rank
- #960
- State rank
- #154 of 590 in NY
Livability — Cheektowaga
- Score
- 84/100
- State rank
- #54
- US rank
- #811
Category grades
Schools grade is shown separately in the Schools card above.
Census & demographics
- Census place
- Cheektowaga, NY
- County
- Erie County · 714,559 people
- City population
- 55,470
- Metro
- Buffalo-Cheektowaga, NY
- Population (ZIP)
- 33,620
- Household income
- $67,237
- Rent vs Own
- Severe rent burden
- 991.0
Population outlook (Erie County) Hauer SSP2
- Today (2025)
- 933,037 people
- By 2030
- 935,181 · +0.2%
- By 2040
- 928,531 · -0.5%
- By 2050
- 905,725 · -2.9%
- By 2075
- 834,037 · -10.6%
- By 2100
- 708,033 · -24.1%
Race, ethnicity, and origin ACS 2023
- Neighborhood character
- Predominantly White (74%)
- Race & ethnicity
- White 74% Black 13% Two or more races 7% Hispanic / Latino 4% Asian 3%
- Common ancestry
- Romanian 21% Lithuanian 3% Iranian 1%
- Foreign-born
- 6% · Canada, Vietnam
- Languages at home
- 92% English-only · Other Indo-European 2% Spanish 2% Arabic 1%
Political lean MEDSL · Erie
- 2024 margin
- Lean D (+9.7) · D 54.8% · R 45.2%
- 2008→2024 swing
- -7.9pp toward R · 2008: 17.5pp · 2024: 9.7pp
- All cycles
- 2024: D+9.7 2020: D+14.7 2016: D+4.8 2012: D+15.6 2008: D+17.5
Not yet ingested
- Civics
- —
Market trends
- HPI YoY
- ▼ -120.26%
- Current HPI
- 320.6248
- Rent YoY
- —
- Metro
- Buffalo-Cheektowaga, NY
- State GDP YoY
- ▲ 2.60%
- F500 in state
- 92
Industry mix (Fortune 500 HQ in NY)
| Industry | F500 HQs | Revenue |
|---|---|---|
| Financial Services | 10 | $950B |
|
||
| Consumer Goods | 9 | $162B |
|
||
| Insurance | 4 | $225B |
|
||
| Telecommunications | 2 | $144B |
|
||
| Pharmaceuticals | 2 | $112B |
|
||
| Media / Entertainment | 2 | $69B |
|
||
Price history
+209.1% since first listed3 events — show timeline
- 2026-06-09 Listed $223,000 WNYREIS
- 2018-12-28 Sold (Public Records) $95,000 Public Records
- 2008-01-10 Sold (Public Records) $72,140 Public Records
Property tax history
+4.3%/yrLatest (2025): $5,207 · +2.2% YoY. Source: county tax records.
Cash-flow waterfall
monthlySold comps — $/sqft
last 12 mo · ≤1 miLoading sold comps…