 🏗️ New Construction
290 Cochise Rd · Greers Ferry, AR
Flood risk 1/10 · Minimal
- FEMA flood zone
- X (unshaded)
- Chance of flooding over 30 yrs
- 0.0%
- Est. flood insurance / yr
- $507 – $1,088
Fire risk 5/10 · Moderate
- Est. fire insurance / yr
- $1,499 – $2,785
Heat risk 5/10 · Moderate
- Hot days now (above 109°F)
- 7 days/yr
- Hot days in 30 yrs
- 18 days/yr
Wind risk 3/10 · Minor
- Chance of severe wind over 30 yrs
- 4.0%
Air-quality risk 2/10 · Minimal
- Unhealthy air days now
- 0 days/yr
- Unhealthy air days in 30 yrs
- 1 days/yr
Risk factors via First Street. Map © Google.
Why this score? — see what drove the B grade
The composite is a weighted blend of 9 inputs, each scored 0–100. Each bar is that input's sub-score; the figure is the points it added to the 100-point composite (weight × sub-score).
- Cash flow +28.9/30.0
- DSCR +10.0/10.0
- Appreciation +8.8/10.0
- ARV discount +7.5/15.0
- 1% rule +6.9/10.0
- Livability +3.1/5.0
- Schools +2.9/10.0
- Rent growth +2.5/5.0
- Condition / age +2.5/5.0
$95,000
🖨 Deal sheet (PDF) 📄 Offer letter ✓ Due diligence
Listing remarks
Escape to the peace and privacy of 290 Cochise Rd in Higden! This beautiful 5-acre property offers the perfect opportunity for a lake getaway, hunting retreat, or weekend escape. Surrounded by abundant wildlife, the land is ideal for outdoor enthusiasts, with plenty of turkey and deer roaming the area. Two deer stands are already in place, making it ready for hunting season. The property includes two trailers with utility hookups that need some work. The seller is currently making improvements, and updated photos will be available soon. Enjoy the best of both worlds privacy and convenience with approximately 3 miles from the main road to the property and just 2 miles to the lake, offering
Key facts
- Hunting retreat
- Abundant wildlife
- Lake getaway
Tags
Property features AI
Exterior
- Utilities: Septic tank sewer
- Home design: Single-family residence; One story
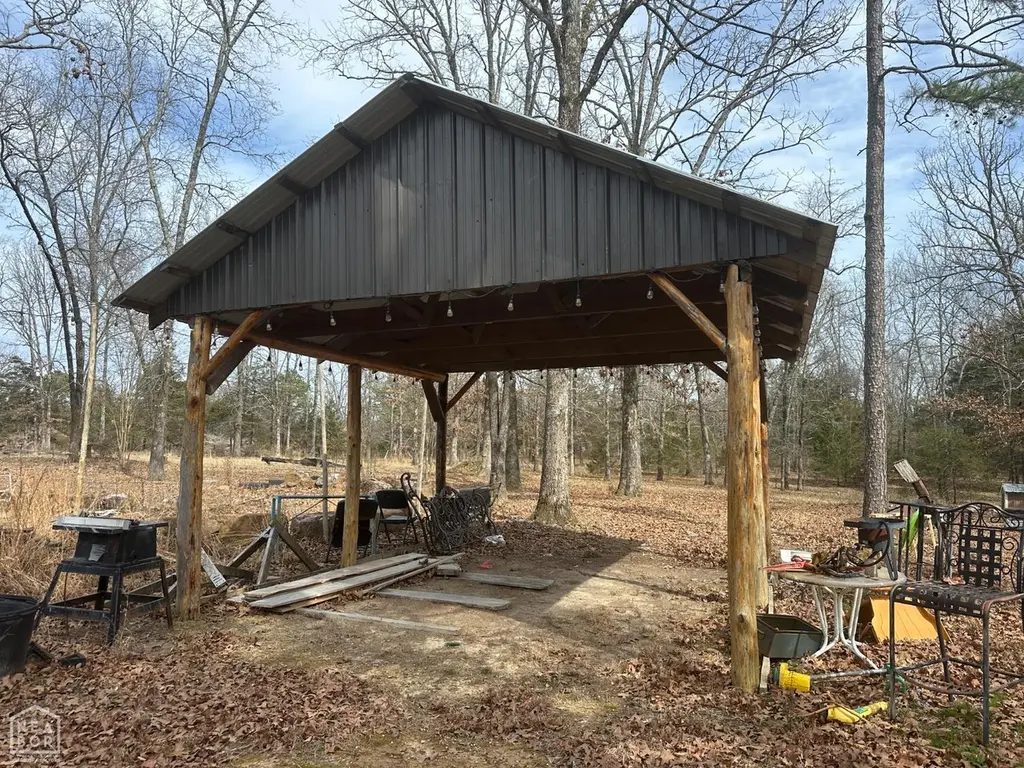
- Construction: Vinyl siding; Built new (new construction)
- Exterior features: 5-acre lot
Interior
- Bathrooms: 1 full bathroom
- Interior features: New construction; Irregular lot
Neighborhood map
What this means for you Summary
Snapshot
- This is a 3-bed/1.0-bath manufactured listed at $95k.
Deal economics
- At list price, monthly cash flow is $322 ($4k/yr) — positive.
- The deal already cash-flows at list — no discount required.
- Meets the 1% rule at list price ($1k rent vs $95k).
- Recommended offer: $86k (9.0% below list) — sets the bar for market timing.
- Cap rate 10.4% vs local median 2.8% in Greers Ferry — top-decile yield for the area; either an underpriced asset or a hidden risk that comps aren't pricing in. Stress-test before assuming the spread holds.
Location & tenants
- Location reads 61/100 on livability (#251 in AR) — a middle-class / working-renter tenant base. Strengths: cost of living A+, housing A+; Watch: employment D+, amenities F, commute F.
- West Side School District (rural): math 29% / reading 41% proficiency, ranked #118 of 238 in AR (top 50%) — families likely to look elsewhere, expect single-tenant / working-renter base with shorter leases.
- Zoned schools: West Side Elementary School (math 27% / reading 42%, grade F, #254 of 454 statewide, top 59%, 288 students, 100% FRL); West Side High School (math 27% / reading 42%, grade F, #92 of 292 statewide, top 37%, 218 students, 100% FRL) — zoned schools average 100% FRL vs 47% district-wide (53 pts higher); higher-poverty schools than district average — tighter screening recommended.
- Market conditions: 168 active listings in the ZIP; 13 units permitted in Cleburne County in 2024 (0 in 5+ unit buildings).
Forward outlook
- In year one you build about $8k of equity ($657 loan paydown + $7k appreciation (7.6% local appreciation)).
- Cleburne County population projected at -18% by 2050 — secular population decline; favor cash flow + early exit over multi-decade hold.
- At projected returns (7.6% appreciation + 3.0% rent growth), your $27k cash investment doubles in ~3 years — after that, you're playing with house money.
- By year 5, paydown + projected appreciation supports a ~$35k cash-out refi (75% LTV) — recoverable capital for the next deal without selling this one.
Negotiation context
- It's been on market 105 days — a 9% lower offer ($86k) is reasonable based on typical stale-listing flexibility.
- 2 sale attempts with the ask held roughly flat each time — persistent listings suggest the price (not the market) is what's stuck; bring a comps-based counter.
- Current owner paid $22k; list at $95k implies a 332% gain — meaningful room to come down on a strong offer.
Risks & watch-outs
- Climate carrying-cost: moderate wildfire risk; extreme-heat days projected 7→18/yr by 2055 (HVAC capex compounding) — expect insurance premiums to compound above CPI over the hold.
Questions for the listing agent
- It's been on market 105 days. Have you received any prior offers? Is the seller open to a 9% concession, seller financing, or rate buy-down credit?
- Built in 1974 — when were the roof, HVAC, electrical panel, plumbing, and water heater last replaced?
- Why hasn't it sold? Are there any deal-killer items the seller is aware of (foundation, flood, title, zoning, code violations)?
- Is there a deadline driving the sale (1031 exchange, divorce, estate, relocation)? That informs how much negotiation room exists.
- Schools are D-rated, which usually means shorter tenancies and higher turnover. Who's the typical renter profile here, and what's been the actual vacancy rate?
- What's the average days-on-market for RENTAL listings here right now (not sales)? A rising rental-DOM trend means longer vacancies and softer asking-rent achievability than the comps imply.
- What's the recent tenant-quality profile in this submarket — average credit score on applications, eviction rate, late-payment / NSF rate, and stable-employment percentage? A property-management company in the area should have these aggregated.
- How much new for-sale + rental construction is in the pipeline within 1–3 miles? Heavy new supply typically softens prices + rents 12–24 months out; constrained supply supports both.
Investment metrics
- 1% rule
- 1.19% ✓
- Cap rate
- 10.36%
- Cash-on-cash
- 14.54%
- DSCR
- 1.65
- GRM
- 7.0
CMA / ARV
No comps found within radius.
Projected returns pro-forma
7.59% appreciation · 3.0% rent growth · sell at horizon
- IRR
- 30.5%
- Equity multiple
- 3.15×
- Total profit
- $57,156
- Equity at exit
- $69,542
- IRR
- 27.5%
- Equity multiple
- 6.66×
- Total profit
- $150,481
- Equity at exit
- $135,602
Cash invested: $26,600 (down + closing). Projections, not guarantees.
Landlord ↔ Tenant lean methodology
- Overall (STATE)
- 92 Strongly Landlord-Friendly
- State Arkansas
- 92 Strongly Landlord-Friendly · R+14
- County
- — inherits STATE
- City
- — inherits STATE
ZIP-level market 72067
- Home prices YoY
- 3.2%
- Active inventory
- 168
- Price-to-rent
- 7.0×
Monthly cashflow live
- Estimated rent
- $1,132 medium interval (Pro) →
- Mortgage (P&I)
- −$498
- Tax from tax record
- −$34 /mo · $405/yr
- Insurance
- −$40
- HOA
- −$0
- Vacancy / Maint / Mgmt
- −$238
- Net cashflow
- $322
Break-even live
Sensitivity live
| Price | -10% $376 | -5% $349 | +0% $322 | +5% $295 | +10% $269 |
|---|---|---|---|---|---|
| Rent | -10% $233 | -5% $278 | +0% $322 | +5% $367 | +10% $412 |
| Rate | -1.0pp $370 | -0.5pp $347 | base $322 | +0.5pp $298 | +1.0pp $273 |
UW: 25.0% down · 7.5% · 30yr · 1.5% tax · 5.0% vac · 8.0% maint · 8.0% mgmt
Financing live
Cash to close
- Down payment
- $23,750
- Closing costs
- $2,850
- Reserves months
- —
- Total cash needed
- —
Loan-product check · same deal, 3 products live
Conventional
25% down · 7.5% · 30yr
- Down + closing
- —
- Monthly P&I
- —
- Monthly cashflow
- —
- DSCR
- —
- Eligible?
- —
Personal DTI + credit; lowest rate.
DSCR
20% down · 8.5% · 30yr
- Down + closing
- —
- Monthly P&I
- —
- Monthly cashflow
- —
- DSCR
- —
- Eligible?
- —
No personal income docs; deal must DSCR.
Hard money
10% down · 12.0% · 12mo
- Down + closing
- —
- Monthly P&I
- —
- Monthly cashflow
- —
- DSCR
- —
- Eligible?
- —
Short-term bridge; refi at stabilization.
Listing history 22 events
-
2026-06-22days on market $95,000 Active 105 DOM
-
2026-06-21days on market $95,000 Active 104 DOM
-
2026-06-19days on market $95,000 Active 102 DOM
-
2026-06-18days on market $95,000 Active 101 DOM
-
2026-06-17days on market $95,000 Active 100 DOM
-
2026-06-16days on market $95,000 Active 99 DOM
-
2026-06-15days on market $95,000 Active 98 DOM
-
2026-06-14days on market $95,000 Active 96 DOM
-
2026-06-12days on market $95,000 Active 95 DOM
-
2026-06-09days on market $95,000 Active 92 DOM
-
2026-06-08days on market $95,000 Active 91 DOM
-
2026-06-07days on market $95,000 Active 90 DOM
-
2026-06-07days on market $95,000 Active 89 DOM
-
2026-06-04days on market $95,000 Active 86 DOM
-
2026-06-02days on market $95,000 Active 85 DOM
-
2026-06-01days on market $95,000 Active 84 DOM
-
2026-05-31days on market $95,000 Active 83 DOM
-
2026-05-31days on market $95,000 Active 82 DOM
-
2026-05-16status Active
-
2026-05-02historical
-
2026-02-22$95,000 Active
-
1996-04-10soldstatus $22,000
ⓘ Source: listings_history table (triggers on properties + properties_extension) + one-shot
backfill from property_details.listing_events for pre-trigger history.
Tax reassessment forecast AR · Resets to sale price
- Current annual tax
- $405 · $34/mo
- Projected year-2 tax
- $608 · $51/mo
- Expected delta
- +$203/yr (+$17/mo · 50.0%)
ⓘ Screening estimate from a state-policy table — verify with the county assessor before closing.
Climate risk First Street
- Flood 1/10 Low FEMA zone X (unshaded) · 0% chance over 30 yrs
- Wildfire 5/10 Major
- Heat 5/10 Major 7 d/yr ≥109°F today · 18 d/yr by 30 yrs out
- Wind 3/10 Moderate 4% chance of damaging wind over 30 yrs
- Air quality 2/10 Low 0 unhealthy d/yr today · 1 by 30 yrs out
Nearby sold comps map
Loading sold comps map…
Walkable amenities ~0.75 mi
Loading nearby amenities…
Taxation est. · year 1
- Rental income
- $13,578
- − Mortgage interest
- −$5,321
- − Property taxes
- −$405
- − Insurance
- −$475
- − Repairs & maintenance
- −$1,086
- − Management
- −$1,086
- − Depreciation
- −$2,764
- Taxable income
- $2,440
- Est. tax owed @ 24.0%
- −$586
- After-tax cash flow
- $3,283/yr
For passive investors: Depreciation is non-cash, so a rental often shows a tax loss while cash-flowing — sheltering income. Rental losses are passive: they offset passive income freely, and up to $25,000/yr can offset ordinary (W-2) income if you actively participate and your MAGI is under $100k (phasing out to $0 by $150k); unused losses carry forward. On sale, claimed depreciation is recaptured at up to 25%, and gains may owe capital-gains tax (a 1031 exchange can defer both). Figures are a year-1 estimate at your 24.0% rate — not tax advice; consult a CPA.
Schools (NCES district)
- District
- West Side School District
- NCES district ID
- 0514040
- Math proficiency
- 29% ▼ -6.00%
- Reading proficiency
- 41% ▼ -6.00%
- Median HH income
- $39,658
- Composite
- 29.31/100
- National rank
- #6551
- State rank
- #118 of 238 in AR
Livability — Greers Ferry
- Score
- 61/100
- State rank
- #251
- US rank
- #18144
Category grades
Schools grade is shown separately in the Schools card above.
Census & demographics
- City population
- 2,881
- Population (ZIP)
- 2,881
Population outlook (Cleburne County) Hauer SSP2
- Today (2025)
- 24,198 people
- By 2030
- 23,324 · -3.6%
- By 2040
- 21,566 · -10.9%
- By 2050
- 19,916 · -17.7%
- By 2075
- 16,744 · -30.8%
- By 2100
- 13,303 · -45.0%
Race, ethnicity, and origin ACS 2023
- Neighborhood character
- Predominantly White (92%)
- Race & ethnicity
- White 92% Two or more races 7% Hispanic / Latino 2%
- Common ancestry
- Slovak 4% Serbian 3% Iranian 1%
- Foreign-born
- 0%
Political lean MEDSL · Cleburne
- 2024 margin
- Solid R (+67.9) · D 15.2% · R 83.2% · Other 1.6%
- 2008→2024 swing
- -23.7pp toward R · 2008: -44.2pp · 2024: -67.9pp
- All cycles
- 2024: R+67.9 2020: R+65.8 2016: R+61.4 2012: R+52.2 2008: R+44.2
Not yet ingested
- Civics
- —
Market trends
- HPI YoY
- ▲ 7.59%
- Current HPI
- 245.97
- Rent YoY
- —
- Metro
- —
- State GDP YoY
- ▲ 3.80%
- F500 in state
- 10
Industry mix (Fortune 500 HQ in AR)
| Industry | F500 HQs | Revenue |
|---|---|---|
| Retail | 1 | $681B |
|
||
| Food / Agriculture | 1 | $53B |
|
||
| Retail / Energy | 1 | $22B |
|
||
| Transportation / Logistics | 1 | $12B |
|
||
| Energy | 1 | $4B |
|
||
Price history
+331.8% since first listed4 events — show timeline
- 2026-05-16 Relisted — NEABOR MLS
- 2026-05-02 Delisted — NEABOR MLS
- 2026-02-22 Listed $95,000 NEABOR MLS
- 1996-04-10 Sold (Public Records) $22,000 Public Records
Property tax history
+0.9%/yrLatest (2025): $405 · +10.0% YoY. Source: county tax records.
Cash-flow waterfall
monthlySold comps — $/sqft
last 12 mo · ≤1 miLoading sold comps…