 Duplex
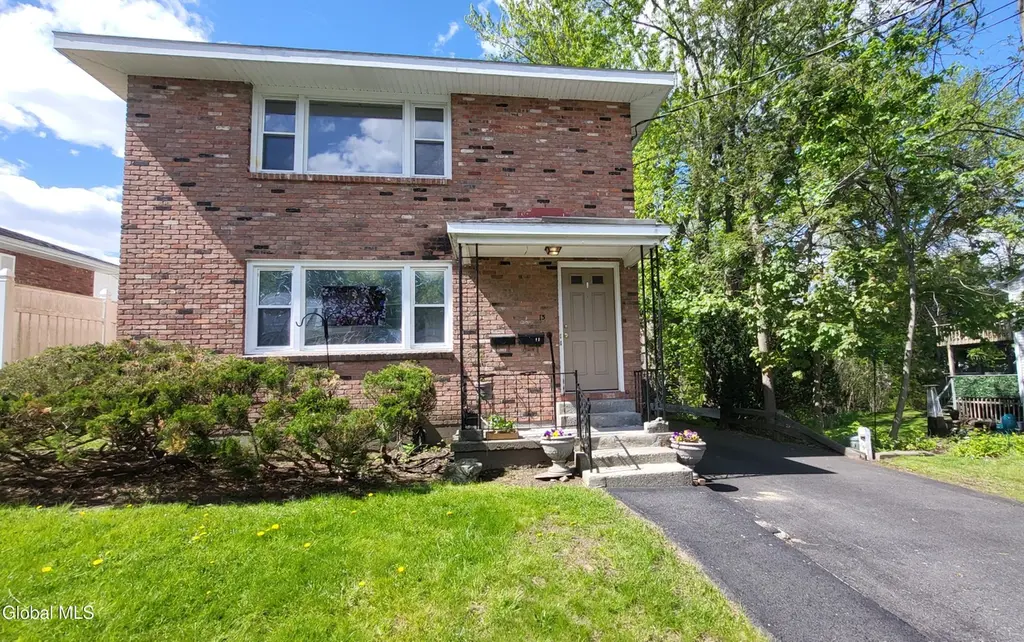
13 Fay St · Albany, NY
Flood risk 1/10 · Minimal
- FEMA flood zone
- X (unshaded)
- Chance of flooding over 30 yrs
- 0.0%
- Est. flood insurance / yr
- $473 – $860
Fire risk 1/10 · Minimal
- Est. fire insurance / yr
- $691 – $1,283
Heat risk 3/10 · Minor
- Hot days now (above 98°F)
- 7 days/yr
- Hot days in 30 yrs
- 16 days/yr
Wind risk 3/10 · Minor
- Chance of severe wind over 30 yrs
- 6.0%
Air-quality risk 1/10 · Minimal
- Unhealthy air days now
- 0 days/yr
- Unhealthy air days in 30 yrs
- 0 days/yr
Risk factors via First Street. Map © Google.
Why this score? — see what drove the C- grade
The composite is a weighted blend of 9 inputs, each scored 0–100. Each bar is that input's sub-score; the figure is the points it added to the 100-point composite (weight × sub-score).
- Cash flow +20.7/30.0
- ARV discount +8.5/15.0
- DSCR +6.6/10.0
- 1% rule +6.1/10.0
- Livability +4.0/5.0
- Schools +3.2/10.0
- Rent growth +3.0/5.0
- Condition / age +2.5/5.0
- Appreciation +0.0/10.0
$369,000
🖨 Deal sheet 📄 Offer letter ✓ Due diligence
Multi-family units
County records classify this as Multi-Family (2-4 Unit). Listing-text estimate: 2 units. confirmed
Listing remarks
Calling all investors and owner-occupants! Well-maintained up-and-down Brick Duplex in PRIME LOCATION- each unit featuring spacious 2-bedrooms, 1-bath, large living room & dining. Separate Electric & Gas Meters. First-floor unit currently occupied; second-floor unit vacant and ready for immediate occupancy or rental income. First-floor unit features a decorative faux fireplace in the living room. Both units offer beautiful hardwood floors throughout, large picture windows providing abundant natural light, and open kitchen layouts with adjoining dining areas. Each unit has its own laundry setup -- first-floor unit includes interior basement access with laundry area, while the sec
Key facts
- Open kitchen layouts
- Brick duplex
- Laundry setup
Tags
Property features AI
Finance
- Financial info: Property is a 2-unit multi-family; tenants pay heat, electricity, and gas
Exterior
- Parking: Detached garage; Paved driveway; Total parking for 6 vehicles; 2 garage spaces
- Utilities: Public water; Public sewer; Cable available and connected
- Home design: Duplex; Facing direction not specified
- Construction: Brick and vinyl siding exterior; Block foundation; Asphalt roof; Built prior to or in public records (year built not provided)
- Exterior features: Landscaped lot; Garage(s) as additional structure
Interior
- Kitchen: Each unit has a kitchen
- Bedrooms: Unit 1: 2 bedrooms (both on the 1st floor); Unit 2: 2 bedrooms (both on the 2nd floor)
- Flooring: Hardwood floors
- Bathrooms: 2 full bathrooms total; Unit 1: 1 full bathroom (1st floor); Unit 2: 1 full bathroom (2nd floor)
- Heating & cooling: Baseboard heating; Hot water heating; Natural gas
- Interior features: Solid surface counters; Bay window(s); Blinds
- Laundry & utility: Laundry in basement; Laundry on upper level
Neighborhood map
What this means for you Summary
Snapshot
- This is a 2 × 2-bed/1-bath units multifamily listed at $369k.
Deal economics
- At list price, monthly cash flow is $500 ($6k/yr) — positive. Per door: $250/mo.
- The deal already cash-flows at list — no discount required.
- Meets the 1% rule at list price ($4k rent vs $369k).
- Cap rate 7.9% vs local median 5.7% in Albany — top-decile yield for the area; either an underpriced asset or a hidden risk that comps aren't pricing in. Stress-test before assuming the spread holds.
Location & tenants
- Location reads 79/100 on livability (#129 in NY, #2,083 nationally) — a middle-class / working-renter tenant base. Strengths: amenities A+, commute A+, housing A+; Watch: employment C-, crime F.
- Albany City School District (urban): math 37% / reading 40% proficiency, ranked #543 of 590 in NY (top 92%) — families likely to look elsewhere, expect single-tenant / working-renter base with shorter leases; 66% free/reduced lunch — lower-income household profile, screen leases tightly.
- Zoned schools: Albany High School (math 74% / reading 67%, grade B+, #710 of 1,100 statewide, top 65%, 2,676 students, 69% FRL) — zoned schools at 69% FRL track the district average.
- Zoned-school proficiency averages 70% at this address vs 38% district-wide (+32 pts) — the actual schools serving this property are materially stronger than the Albany City School District average implies; a family-tenant draw the district grade alone would hide.
- Market conditions: Rents rising (+1.9%/yr); 124 active listings in the ZIP; 7 comparable units currently listed for rent nearby; rentals at typical pace (median 21d on market — plan ~3-4 weeks tenant-placement turnaround); solid renter incomes; 675 units permitted in Albany County in 2024 (451 in 5+ unit buildings).
- At $4,093/mo this rent would consume 59% of the median local household income ($83k/yr) (locally 1704% of renters already pay >50% of income on rent) — very limited rent-growth headroom before tenants either downsize or default.
Forward outlook
- Local home prices are declining (-3.0%/yr); year-one equity from $3k of loan paydown is wiped out by about $11k of value loss. Plan a longer hold.
- Albany County population projected at +9% by 2050 — modest demand growth; plan on rents tracking national, not racing it.
Negotiation context
- Only 2 days on market — expect competitive offers; lowballing is unlikely to land.
- 2 sale attempts since 3y ago with the ask held roughly flat each time — persistent listings suggest the price (not the market) is what's stuck; bring a comps-based counter.
Questions for the listing agent
- Can we see the unit-by-unit rent roll, current vacancy, and any below-market leases? What's the average tenancy length?
- What capital expenditures (roof, boiler, parking lot, exteriors) have been made in the last 5 years, and what's planned in the next 2?
- Built in 1970 — when were the roof, HVAC, electrical panel, plumbing, and water heater last replaced?
- Is there a deadline driving the sale (1031 exchange, divorce, estate, relocation)? That informs how much negotiation room exists.
- Crime grade is F in this area — have there been break-ins, vandalism, or insurance claims at this property in the last 3 years? What carrier currently insures it and at what premium?
- What's the average days-on-market for RENTAL listings here right now (not sales)? A rising rental-DOM trend means longer vacancies and softer asking-rent achievability than the comps imply.
- What's the recent tenant-quality profile in this submarket — average credit score on applications, eviction rate, late-payment / NSF rate, and stable-employment percentage? A property-management company in the area should have these aggregated.
- How much new apartment / multifamily construction is in the pipeline within 1–3 miles? Heavy new supply (>2% of stock underway) typically softens rents 12–24 months out; light construction supports rent growth.
Investment metrics
- 1% rule
- 1.11% ✓
- Cap rate
- 7.92%
- Cash-on-cash
- 5.81%
- DSCR
- 1.26
- GRM
- 7.5
CMA / ARV
- ARV (on-the-fly)
- $377,200
- Comps found
- 4
Show comp detail 4 sales within ~0.75 mi
| Address | Dist | Beds/Ba | Sqft | Sold | Price | $/sf | Match |
|---|---|---|---|---|---|---|---|
| 155 Russell Blessing Rd | 0.10mi | 4/2.0 | 2,156 (+5%) | 20mo | $320,000 | $148 | 70 |
| 23 Beach Ave | 0.15mi | 5/3.0 (+1) | 2,080 (+2%) | 18mo | $392,500 | $189 | 66 |
| 82-88 Russell Rd | 0.28mi | 5/2.0 (+1) | 2,000 (-2%) | 22mo | $367,500 | $184 | 59 |
| 106 Tampa Ave | 0.67mi | 4/2.0 | 2,242 (+9%) | 3mo | $375,000 | $167 | 51 |
Match score weights: distance 35% · size 25% · config 20% · recency 20%. Top-matched comps best support the ARV.
Projected returns pro-forma
-3.0% appreciation · 1.85% rent growth · sell at horizon
- IRR
- -8.7%
- Equity multiple
- 0.69×
- Total profit
- $-32,458
- Equity at exit
- $55,019
- IRR
- -0.8%
- Equity multiple
- 0.95×
- Total profit
- $-5,325
- Equity at exit
- $31,904
Cash invested: $103,320 (down + closing). Projections, not guarantees.
Landlord ↔ Tenant lean methodology
- Overall (STATE)
- 15 Strongly Tenant-Friendly
- State New York
- 15 Strongly Tenant-Friendly · D+10
- County
- — inherits STATE
- City
- — inherits STATE
ZIP-level market 12203
- Home prices YoY
- -31.0%
- Rents YoY
- 1.9%
- Active inventory
- 124
- Price-to-rent
- 15.0×
Monthly cashflow live
- Estimated rent
- $4,093 high interval (Pro) →
- Mortgage (P&I)
- −$1,935
- Tax from tax record
- −$645 /mo · $7,736/yr
- Insurance
- −$154
- HOA
- −$0
- Vacancy / Maint / Mgmt
- −$860
- Net cashflow
- $500
Break-even live
2-unit breakdown (identical units grouped — click to expand)
| Units | Beds | Baths | Est. rent |
|---|---|---|---|
| 2× units | 2 | 1 | $4,094 |
| #1 | 2 | 1 | $2,047 |
| #2 | 2 | 1 | $2,047 |
| Total (2 units) | $4,093 | ||
UW: 25.0% down · 7.5% · 30yr · 1.5% tax · 5.0% vac · 8.0% maint · 8.0% mgmt
Financing live
Cash to close
- Down payment
- $92,250
- Closing costs
- $11,070
- Reserves months
- —
- Total cash needed
- —
Loan-product check · same deal, 3 products live
Conventional
25% down · 7.5% · 30yr
- Down + closing
- —
- Monthly P&I
- —
- Monthly cashflow
- —
- DSCR
- —
- Eligible?
- —
Personal DTI + credit; lowest rate.
DSCR
20% down · 8.5% · 30yr
- Down + closing
- —
- Monthly P&I
- —
- Monthly cashflow
- —
- DSCR
- —
- Eligible?
- —
No personal income docs; deal must DSCR.
Hard money
10% down · 12.0% · 12mo
- Down + closing
- —
- Monthly P&I
- —
- Monthly cashflow
- —
- DSCR
- —
- Eligible?
- —
Short-term bridge; refi at stabilization.
Rent comps 7 comps
| Address | Beds | Baths | Sqft | Rent | $/sqft | DOM | Units | Dist |
|---|---|---|---|---|---|---|---|---|
| 32 Moreland Ave Unit NA Albany, NY | 3.0 | 1.5 | 1500 | $2,300 | $1.53 | 21d | 1 | 0.10mi |
| 62 Homestead St Albany, NY | 4.0 | 2.0 | 1600 | $2,600 | $1.62 | 43d | 1 | 0.34mi |
| 830 Western Ave Albany, NY | 4.0 | 2.5 | 1600 | $2,700 | $1.69 | 14d | 1 | 0.93mi |
| 726 Western Ave Albany, NY | 4.0 | 2.5 | 1900 | $2,800 | $1.47 | 43d | 1 | 1.03mi |
| 53 Greenway N Albany, NY | 3.0 | 2.0 | 1500 | $2,600 | $1.73 | 23d | 1 | 1.13mi |
| 255 Patroon Creek Blvd Albany, NY | 1.0–3.0 | 1.0–2.0 | 1080 | $2,559 | $2.37 | 14d | 22 | 1.39mi |
| 78 S Pine Ave Unit 2 Albany, NY | 3.0 | 1.5 | 1541 | $2,350 | $1.52 | 14d | 1 | 1.50mi |
Listing history 4 events
-
2026-05-21status Pending
-
2026-05-19$369,000 Active
-
2023-11-09historical $1,400
-
2023-10-20$1,400
ⓘ Source: listings_history table (triggers on properties + properties_extension) + one-shot
backfill from property_details.listing_events for pre-trigger history.
Tax reassessment forecast NY · Partial reset (capped growth)
- Current annual tax
- $7,736 · $645/mo
- Projected year-2 tax
- $7,736 · $645/mo
- Expected delta
- $0/yr ($0/mo · 0.0%)
ⓘ Screening estimate from a state-policy table — verify with the county assessor before closing.
Climate risk First Street
- Flood 1/10 Low FEMA zone X (unshaded) · 0% chance over 30 yrs
- Wildfire 1/10 Low
- Heat 3/10 Moderate 7 d/yr ≥98°F today · 16 d/yr by 30 yrs out
- Wind 3/10 Moderate 6% chance of damaging wind over 30 yrs
- Air quality 1/10 Low 0 unhealthy d/yr today · 0 by 30 yrs out
Nearby sold comps map
Loading sold comps map…
Walkable amenities ~0.75 mi
Loading nearby amenities…
Taxation est. · year 1
- Rental income
- $49,116
- − Mortgage interest
- −$20,670
- − Property taxes
- −$7,736
- − Insurance
- −$1,845
- − Repairs & maintenance
- −$3,929
- − Management
- −$3,929
- − Depreciation
- −$10,735
- Taxable income
- $272
- Est. tax owed @ 24.0%
- −$65
- After-tax cash flow
- $5,934/yr
For passive investors: Depreciation is non-cash, so a rental often shows a tax loss while cash-flowing — sheltering income. Rental losses are passive: they offset passive income freely, and up to $25,000/yr can offset ordinary (W-2) income if you actively participate and your MAGI is under $100k (phasing out to $0 by $150k); unused losses carry forward. On sale, claimed depreciation is recaptured at up to 25%, and gains may owe capital-gains tax (a 1031 exchange can defer both). Figures are a year-1 estimate at your 24.0% rate — not tax advice; consult a CPA.
Schools (NCES district)
- District
- Albany City School District
- NCES district ID
- 3602460
- Math proficiency
- 37% ▲ 6.00%
- Reading proficiency
- 40% ▲ 7.00%
- Median HH income
- $40,568
- Composite
- 32.34/100
- National rank
- #5744
- State rank
- #543 of 590 in NY
Livability — Albany
- Score
- 79/100
- State rank
- #129
- US rank
- #2083
Category grades
Schools grade is shown separately in the Schools card above.
Census & demographics
- Census place
- Albany, NY
- County
- Albany County · 196,626 people
- City population
- 116,921
- Metro
- Albany-Schenectady-Troy, NY
- Population (ZIP)
- 30,771
- Household income
- $83,147
- Rent vs Own
- Severe rent burden
- 1704.0
Population outlook (Albany County) Hauer SSP2
- Today (2025)
- 320,794 people
- By 2030
- 327,401 · +2.1%
- By 2040
- 338,218 · +5.4%
- By 2050
- 348,467 · +8.6%
- By 2075
- 381,693 · +19.0%
- By 2100
- 393,809 · +22.8%
Race, ethnicity, and origin ACS 2023
- Neighborhood character
- Predominantly White (69%)
- Race & ethnicity
- White 69% Black 10% Asian 8% Hispanic / Latino 7% Two or more races 7%
- Hispanic origin (detail)
- Mexican 2% Puerto Rican 2%
- Common ancestry
- Romanian 5% Lithuanian 3% Slovak 2%
- Foreign-born
- 16% · Canada, China, South Korea
- Languages at home
- 82% English-only · Other Indo-European 6% Spanish 3% Russian/Polish/Slavic 2%
Political lean MEDSL · Albany
- 2024 margin
- Strong D (+25.8) · D 62.9% · R 37.1%
- 2008→2024 swing
- -3.6pp toward R · 2008: 29.4pp · 2024: 25.8pp
- All cycles
- 2024: D+25.8 2020: D+31.4 2016: D+24.3 2012: D+31.0 2008: D+29.4
Not yet ingested
- Civics
- —
Market trends
- HPI YoY
- ▼ -133.05%
- Current HPI
- 296.0467
- Rent YoY
- ▲ 1.85%
- Metro
- Albany-Schenectady-Troy, NY
- State GDP YoY
- ▲ 2.60%
- F500 in state
- 92
Industry mix (Fortune 500 HQ in NY)
| Industry | F500 HQs | Revenue |
|---|---|---|
| Financial Services | 10 | $950B |
|
||
| Consumer Goods | 9 | $162B |
|
||
| Insurance | 4 | $225B |
|
||
| Telecommunications | 2 | $144B |
|
||
| Pharmaceuticals | 2 | $112B |
|
||
| Media / Entertainment | 2 | $69B |
|
||
Price history
+26257.1% since first listed4 events — show timeline
- 2026-05-21 Pending — Global MLS
- 2026-05-19 Listed $369,000 Global MLS
- 2023-11-09 Rental Removed $1,400 GLOBALMLS
- 2023-10-20 Listed for Rent $1,400 GLOBALMLS
Property tax history
+1.2%/yrLatest (2025): $7,736 · +2.4% YoY. Source: county tax records.
Cash-flow waterfall
monthlySold comps — $/sqft
last 12 mo · ≤1 miLoading sold comps…