 Duplex
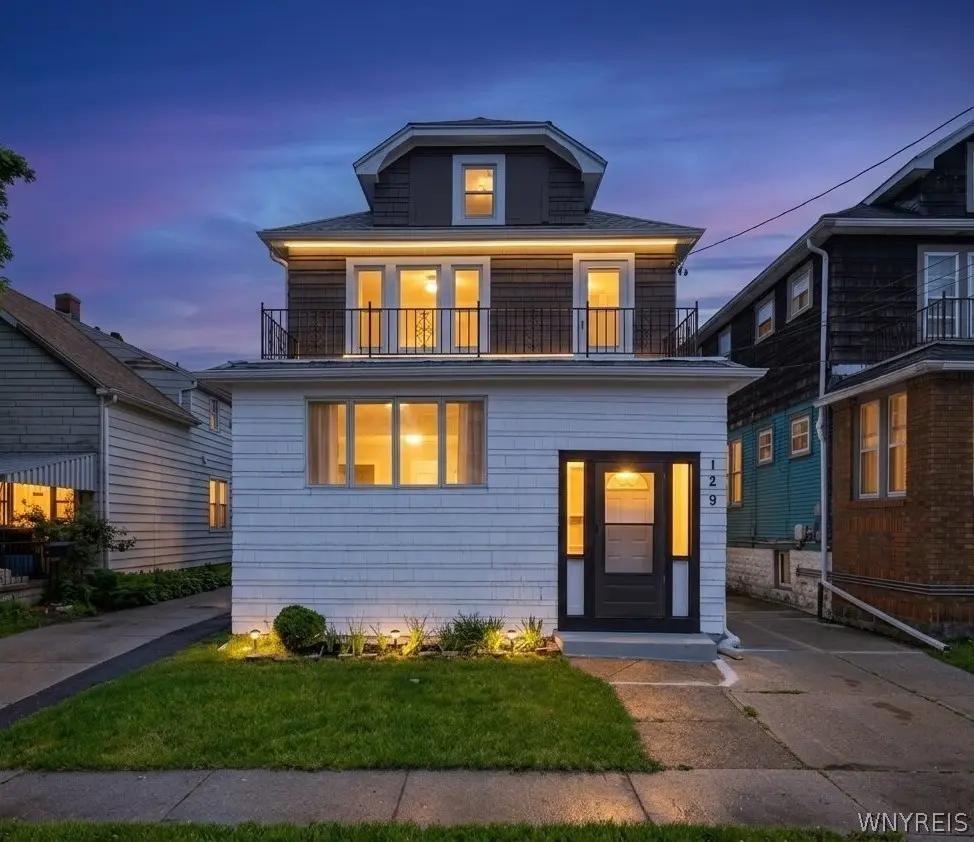
129 Ridge Park Ave · Cheektowaga, NY
Flood risk 1/10 · Minimal
- FEMA flood zone
- X (unshaded)
- Chance of flooding over 30 yrs
- 0.0%
- Est. flood insurance / yr
- $473 – $860
Fire risk 1/10 · Minimal
- Est. fire insurance / yr
- $691 – $1,283
Heat risk 3/10 · Minor
- Hot days now (above 93°F)
- 7 days/yr
- Hot days in 30 yrs
- 15 days/yr
Wind risk 1/10 · Minimal
- Chance of severe wind over 30 yrs
- —
Air-quality risk 3/10 · Minor
- Unhealthy air days now
- 2 days/yr
- Unhealthy air days in 30 yrs
- 3 days/yr
Risk factors via First Street. Map © Google.
Why this score? — see what drove the D grade
The composite is a weighted blend of 9 inputs, each scored 0–100. Each bar is that input's sub-score; the figure is the points it added to the 100-point composite (weight × sub-score).
- Cash flow +16.5/30.0
- Appreciation +6.0/10.0
- 1% rule +5.1/10.0
- DSCR +5.1/10.0
- Livability +4.2/5.0
- Schools +2.8/10.0
- Rent growth +2.5/5.0
- Condition / age +2.5/5.0
- ARV discount +0.0/15.0
$289,900
🖨 Deal sheet (PDF) 📄 Offer letter ✓ Due diligence
Multi-family units
County records classify this as Multi-Family (2-4 Unit). Listing-text estimate: 2 units. confirmed
Listing remarks
Ideally situated minutes from the Buffalo Niagara International Airport and the Route 33 expressway, this exceptional Cheektowaga duplex at 129 Ridge Park Ave, Cheektowaga, NY offers the perfect blend of convenience, comfort, and versatile living. Each well-appointed unit features a welcoming living room, a formal dining area, three comfortable bedrooms, and an updated full bathroom, highlighted by upgraded ceramic tile layouts in both the kitchens and baths. The property boasts an impressive, massive finished basement complete with an office/hobby room and generous storage—an ideal setup for entertaining, recreation, or working from home. Some Photos does have virtual staging for int
Key facts
- Fenced yard
- Finished basement
- Office hobby room
Tags
Property features AI
Finance
- Other: Two-unit building with separate gas and electric meters for each unit
- Financial info: Owner pays snow removal and water; Rent includes snow removal and water; Operating expenses may include electric, fuel and water/sewer
Exterior
- Parking: Concrete parking surface
- Utilities: Electricity connected; Public water connected; Sewer connected
- Home design: Two-story property; Existing (pre-owned) condition
- Construction: Shake siding and wood siding; Block foundation; Shingle roof
- Exterior features: Fully fenced yard; Rectangular residential lot; Near public transit; City street frontage; Lot dimensions approximately 30 x 140
Interior
- Flooring: Luxury vinyl; Tile; Varies
- Bathrooms: Two full bathrooms
- Heating & cooling: Gas forced air heat
- Interior features: Full finished basement; Luxury vinyl and tile flooring; Varied flooring types
- Laundry & utility: Gas water heater
Neighborhood map
What this means for you Summary
Snapshot
- This is a 2 × 3-bed/1.0-bath units multifamily listed at $290k.
Deal economics
- At list price, monthly cash flow is $169 ($2k/yr) — positive. Per door: $85/mo.
- The deal already cash-flows at list — no discount required.
- Meets the 1% rule at list price ($3k rent vs $290k).
- Cap rate 7.0% vs local median 3.8% in Cheektowaga — top-decile yield for the area; either an underpriced asset or a hidden risk that comps aren't pricing in. Stress-test before assuming the spread holds.
Location & tenants
- Location reads 84/100 on livability (#54 in NY, #811 nationally) — a professional / high-income tenant draw. Strengths: commute A+, housing A+, health & safety A+; Watch: crime C-.
- Cheektowaga Central School District (urban): math 30% / reading 37% proficiency, ranked #564 of 590 in NY (top 96%) — families likely to look elsewhere, expect single-tenant / working-renter base with shorter leases.
- Market conditions: 172 active listings in the ZIP; lower-income renter base — watch delinquency; 1,244 units permitted in Erie County in 2024 (563 in 5+ unit buildings).
- At $2,940/mo this rent would consume 97% of the median local household income ($36k/yr) (locally 1804% of renters already pay >50% of income on rent) — very limited rent-growth headroom before tenants either downsize or default.
Forward outlook
- In year one you build about $8k of equity ($2k loan paydown + $6k appreciation (2.0% local appreciation)).
- At projected returns (2.0% appreciation + 3.0% rent growth), your $81k cash investment doubles in ~7 years — after that, you're playing with house money.
- By year 5, paydown + projected appreciation supports a ~$35k cash-out refi (75% LTV) — recoverable capital for the next deal without selling this one.
Negotiation context
- Only 11 days on market — expect competitive offers; lowballing is unlikely to land.
- Current owner paid $67k; list at $290k implies a 333% gain — meaningful room to come down on a strong offer.
Risks & watch-outs
- Watch-outs: built in 1922 — expect roof / HVAC / electrical / plumbing capex.
Questions for the listing agent
- Can we see the unit-by-unit rent roll, current vacancy, and any below-market leases? What's the average tenancy length?
- What capital expenditures (roof, boiler, parking lot, exteriors) have been made in the last 5 years, and what's planned in the next 2?
- Built in 1922 — when were the roof, HVAC, electrical panel, plumbing, and water heater last replaced?
- Is there a deadline driving the sale (1031 exchange, divorce, estate, relocation)? That informs how much negotiation room exists.
- Schools are B-rated — typically a magnet for longer-tenancy family renters. What's the average tenant stay here, and is there a school-zone premium baked into asking?
- The area grade is low — what's the realistic commute time and amenity access for the typical tenant pool here? Any planned neighborhood developments (good or bad) we should know about?
- What's the average days-on-market for RENTAL listings here right now (not sales)? A rising rental-DOM trend means longer vacancies and softer asking-rent achievability than the comps imply.
- What's the recent tenant-quality profile in this submarket — average credit score on applications, eviction rate, late-payment / NSF rate, and stable-employment percentage? A property-management company in the area should have these aggregated.
- How much new apartment / multifamily construction is in the pipeline within 1–3 miles? Heavy new supply (>2% of stock underway) typically softens rents 12–24 months out; light construction supports rent growth.
Investment metrics
- 1% rule
- 1.01% ✓
- Cap rate
- 6.99%
- Cash-on-cash
- 2.50%
- DSCR
- 1.11
- GRM
- 8.2
CMA / ARV
- ARV (on-the-fly)
- $233,688
- Comps found
- 12
Show comp detail 12 sales within ~0.75 mi
| Address | Dist | Beds/Ba | Sqft | Sold | Price | $/sf | Match |
|---|---|---|---|---|---|---|---|
| 143 Reo Ave | 0.07mi | 6/3.0 | 2,251 (+3%) | 8mo | $261,000 | $116 | 81 |
| 51 Randolph Ave | 0.50mi | 6/2.0 | 2,198 (+1%) | 4mo | $235,101 | $107 | 72 |
| 15 Haller Ave | 0.34mi | 5/2.0 (-1) | 2,101 (-4%) | 9mo | $285,000 | $136 | 66 |
| 50 Avery Pl | 0.60mi | 6/2.0 | 2,132 (-2%) | 10mo | $226,125 | $106 | 60 |
| 62 Wanda Ave | 0.16mi | 5/3.0 (-1) | 1,868 (-14%) | 1mo | $200,000 | $107 | 58 |
| 566 Doat St | 0.54mi | 6/2.0 | 1,900 (-13%) | 6mo | $185,000 | $97 | 48 |
| 35 Loxley Rd | 0.62mi | 5/2.0 (-1) | 1,943 (-11%) | 1mo | $175,000 | $90 | 46 |
| 2581 Genesee St | 0.72mi | 5/2.0 (-1) | 2,107 (-4%) | 11mo | $255,000 | $121 | 46 |
| 50 Randolph Ave | 0.52mi | 6/2.0 | 2,449 (+12%) | 14mo | $295,000 | $120 | 44 |
| 56 George Urban Blvd | 0.64mi | 5/2.0 (-1) | 2,030 (-7%) | 15mo | $185,000 | $91 | 41 |
| 63 Pine Ridge Rd | 0.38mi | 7/4.0 (+1) | 2,428 (+11%) | 13mo | $311,000 | $128 | 40 |
| 1085 Walden Ave | 0.44mi | 5/3.0 (-1) | 2,506 (+15%) | 11mo | $188,000 | $75 | 36 |
Match score weights: distance 35% · size 25% · config 20% · recency 20%. Top-matched comps best support the ARV.
Projected returns pro-forma
2.05% appreciation · 3.0% rent growth · sell at horizon
- IRR
- 7.2%
- Equity multiple
- 1.39×
- Total profit
- $31,514
- Equity at exit
- $115,116
- IRR
- 10.5%
- Equity multiple
- 2.43×
- Total profit
- $115,848
- Equity at exit
- $166,363
Cash invested: $81,172 (down + closing). Projections, not guarantees.
Landlord ↔ Tenant lean methodology
- Overall (STATE)
- 15 Strongly Tenant-Friendly
- State New York
- 15 Strongly Tenant-Friendly · D+10
- County
- — inherits STATE
- City
- — inherits STATE
ZIP-level market 14211
- Home prices YoY
- 0.6%
- Active inventory
- 172
- Price-to-rent
- 16.4×
Monthly cashflow live
- Estimated rent
- $2,940 high interval (Pro) →
- Mortgage (P&I)
- −$1,520
- Tax from tax record
- −$512 /mo · $6,148/yr
- Insurance
- −$121
- HOA
- −$0
- Vacancy / Maint / Mgmt
- −$617
- Net cashflow
- $169
Break-even live
Sensitivity live
| Price | -10% $333 | -5% $251 | +0% $169 | +5% $87 | +10% $5 |
|---|---|---|---|---|---|
| Rent | -10% $-63 | -5% $53 | +0% $169 | +5% $285 | +10% $401 |
| Rate | -1.0pp $315 | -0.5pp $243 | base $169 | +0.5pp $94 | +1.0pp $18 |
2-unit breakdown (identical units grouped — click to expand)
| Units | Beds | Baths | Est. rent |
|---|---|---|---|
| 2× units | 3 | 1 | $2,940 |
| #1 | 3 | 1 | $1,470 |
| #2 | 3 | 1 | $1,470 |
| Total (2 units) | $2,940 | ||
UW: 25.0% down · 7.5% · 30yr · 1.5% tax · 5.0% vac · 8.0% maint · 8.0% mgmt
Financing live
Cash to close
- Down payment
- $72,475
- Closing costs
- $8,697
- Reserves months
- —
- Total cash needed
- —
Loan-product check · same deal, 3 products live
Conventional
25% down · 7.5% · 30yr
- Down + closing
- —
- Monthly P&I
- —
- Monthly cashflow
- —
- DSCR
- —
- Eligible?
- —
Personal DTI + credit; lowest rate.
DSCR
20% down · 8.5% · 30yr
- Down + closing
- —
- Monthly P&I
- —
- Monthly cashflow
- —
- DSCR
- —
- Eligible?
- —
No personal income docs; deal must DSCR.
Hard money
10% down · 12.0% · 12mo
- Down + closing
- —
- Monthly P&I
- —
- Monthly cashflow
- —
- DSCR
- —
- Eligible?
- —
Short-term bridge; refi at stabilization.
Listing history 10 events
-
2026-06-13statusdays on market $289,900 Pending 11 DOM
-
2026-06-10days on market $289,900 Active 10 DOM
-
2026-06-09days on market $289,900 Active 9 DOM
-
2026-06-08days on market $289,900 Active 8 DOM
-
2026-06-07days on market $289,900 Active 7 DOM
-
2026-06-05days on market $289,900 Active 4 DOM
-
2026-06-03days on market $289,900 Active 3 DOM
-
2026-06-02days on market $289,900 Active 2 DOM
-
2026-06-01remarks 693-char remark
-
2026-06-01$289,900 Active 1 DOM
ⓘ Source: listings_history table (triggers on properties + properties_extension) + one-shot
backfill from property_details.listing_events for pre-trigger history.
Tax reassessment forecast NY · Partial reset (capped growth)
- Current annual tax
- $6,148 · $512/mo
- Projected year-2 tax
- $6,148 · $512/mo
- Expected delta
- $0/yr ($0/mo · 0.0%)
ⓘ Screening estimate from a state-policy table — verify with the county assessor before closing.
Climate risk First Street
- Flood 1/10 Low FEMA zone X (unshaded) · 0% chance over 30 yrs
- Wildfire 1/10 Low
- Heat 3/10 Moderate 7 d/yr ≥93°F today · 15 d/yr by 30 yrs out
- Wind 1/10 Low
- Air quality 3/10 Moderate 2 unhealthy d/yr today · 3 by 30 yrs out
Nearby sold comps map
Loading sold comps map…
Walkable amenities ~0.75 mi
Loading nearby amenities…
Taxation est. · year 1
- Rental income
- $35,280
- − Mortgage interest
- −$16,239
- − Property taxes
- −$6,148
- − Insurance
- −$1,450
- − Repairs & maintenance
- −$2,822
- − Management
- −$2,822
- − Depreciation
- −$8,433
- Taxable loss
- −$2,635
- Est. tax savings @ 24.0%
- +$632
- After-tax cash flow
- $2,663/yr
For passive investors: Depreciation is non-cash, so a rental often shows a tax loss while cash-flowing — sheltering income. Rental losses are passive: they offset passive income freely, and up to $25,000/yr can offset ordinary (W-2) income if you actively participate and your MAGI is under $100k (phasing out to $0 by $150k); unused losses carry forward. On sale, claimed depreciation is recaptured at up to 25%, and gains may owe capital-gains tax (a 1031 exchange can defer both). Figures are a year-1 estimate at your 24.0% rate — not tax advice; consult a CPA.
Schools (NCES district)
- District
- Cheektowaga Central School District
- NCES district ID
- 3607230
- Math proficiency
- 30% ▼ -7.00%
- Reading proficiency
- 37% ▲ 1.00%
- Median HH income
- $43,401
- Composite
- 28.45/100
- National rank
- #6753
- State rank
- #564 of 590 in NY
Livability — Cheektowaga
- Score
- 84/100
- State rank
- #54
- US rank
- #811
Category grades
Schools grade is shown separately in the Schools card above.
Census & demographics
- Census place
- Cheektowaga, NY
- County
- Erie County · 714,559 people
- City population
- 440,021
- Metro
- Buffalo-Cheektowaga, NY
- Population (ZIP)
- 24,663
- Household income
- $36,300
- Rent vs Own
- Severe rent burden
- 1804.0
Population outlook (Erie County) Hauer SSP2
- Today (2025)
- 933,037 people
- By 2030
- 935,181 · +0.2%
- By 2040
- 928,531 · -0.5%
- By 2050
- 905,725 · -2.9%
- By 2075
- 834,037 · -10.6%
- By 2100
- 708,033 · -24.1%
Race, ethnicity, and origin ACS 2023
- Neighborhood character
- Diverse neighborhood (Simpson 0.60)
- Race & ethnicity
- Black 59% Asian 20% Hispanic / Latino 9% White 9% Two or more races 5%
- Hispanic origin (detail)
- Puerto Rican 6%
- Common ancestry
- Romanian 4%
- Foreign-born
- 17% · Canada, Philippines, Vietnam
- Languages at home
- 74% English-only · Other Indo-European 14% Spanish 6% Other Asian/Pacific 1%
Political lean MEDSL · Erie
- 2024 margin
- Lean D (+9.7) · D 54.8% · R 45.2%
- 2008→2024 swing
- -7.9pp toward R · 2008: 17.5pp · 2024: 9.7pp
- All cycles
- 2024: D+9.7 2020: D+14.7 2016: D+4.8 2012: D+15.6 2008: D+17.5
Not yet ingested
- Civics
- —
Market trends
- HPI YoY
- ▲ 2.05%
- Current HPI
- 357.6438
- Rent YoY
- —
- Metro
- Buffalo-Cheektowaga, NY
- State GDP YoY
- ▲ 2.60%
- F500 in state
- 92
Industry mix (Fortune 500 HQ in NY)
| Industry | F500 HQs | Revenue |
|---|---|---|
| Financial Services | 10 | $950B |
|
||
| Consumer Goods | 9 | $162B |
|
||
| Insurance | 4 | $225B |
|
||
| Telecommunications | 2 | $144B |
|
||
| Pharmaceuticals | 2 | $112B |
|
||
| Media / Entertainment | 2 | $69B |
|
||
Price history
+333.0% since first listed2 events — show timeline
- 2026-05-31 Listed $289,900 WNYREIS
- 2006-09-05 Sold (Public Records) $66,950 Public Records
Property tax history
+7.4%/yrLatest (2025): $6,148 · +18.4% YoY. Source: county tax records.
Cash-flow waterfall
monthlySold comps — $/sqft
last 12 mo · ≤1 miLoading sold comps…