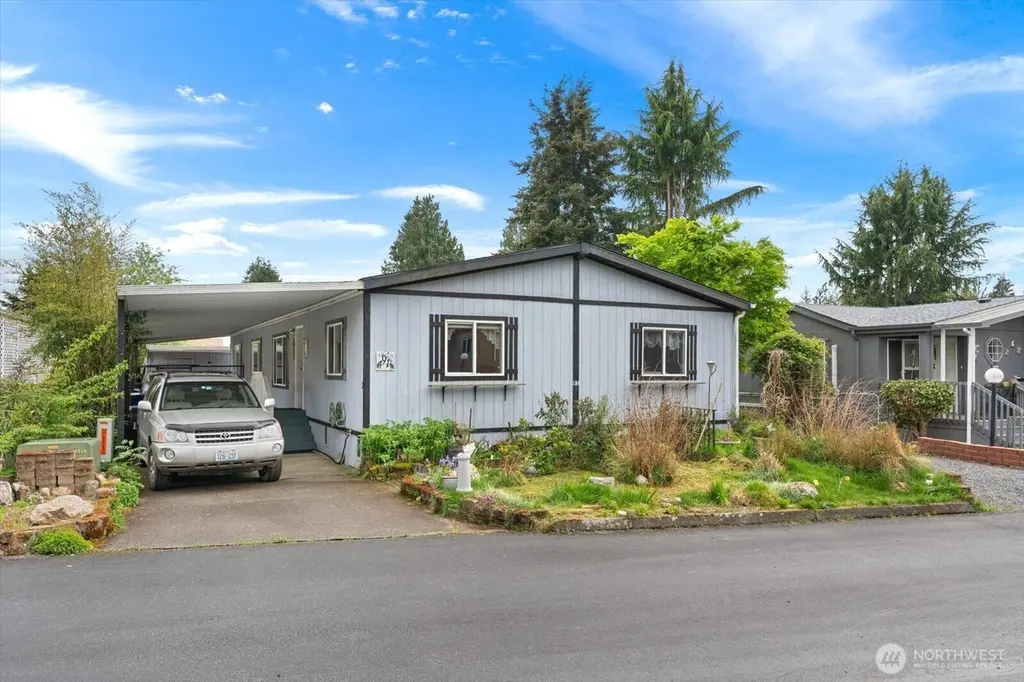
8430 SE 15th Pl #91 · Lake Stevens, WA
Flood risk No data
- FEMA flood zone
- —
- Chance of flooding over 30 yrs
- —
- Est. flood insurance / yr
- —
Fire risk No data
- Est. fire insurance / yr
- —
Heat risk No data
- Hot days now (above threshold)
- —
- Hot days in 30 yrs
- —
Wind risk No data
- Chance of severe wind over 30 yrs
- —
Air-quality risk No data
- Unhealthy air days now
- —
- Unhealthy air days in 30 yrs
- —
Risk factors via First Street. Map © Google.
Why this score? — see what drove the B grade
The composite is a weighted blend of 9 inputs, each scored 0–100. Each bar is that input's sub-score; the figure is the points it added to the 100-point composite (weight × sub-score).
- Cash flow +29.2/30.0
- DSCR +10.0/10.0
- ARV discount +8.6/15.0
- 1% rule +8.1/10.0
- Schools +5.8/10.0
- Livability +4.2/5.0
- Rent growth +2.5/5.0
- Condition / age +2.5/5.0
- Appreciation +0.0/10.0
$229,900
🖨 Deal sheet 📄 Offer letter ✓ Due diligence
Listing remarks
Welcome to Cardinal Estates, a 55+ community. This 3 bedrooms and 2.75 bath sq feet of 1848 home sits on a landscaped lot including enclosed sun porch and storage shed. Including a double car carport and side parking. This home has a open floor plan with a large kitchen, dining room, living area, large primary bedroom with new carpet and utility room with storage; all kitchen appliances are included in sale. New roof in 2025. Space rent at $1102.66 including sewer, RV parking is available in park. Enjoy the privacy that is provided by the mature landscaping This great location is close to Hwy 9, Hwy 2 and I5, Costco, Cavallero Station, and Frontier Village.
Key facts
- Storage shed
- Large kitchen
- Dining room
Tags
Property features AI
Finance
- Other: Listing active; Buyer broker compensation: 2.5%
- Financial info: Accepts Cash, Conventional, FHA
- HOA & community: Located in Cardinal Estate manufactured home park; Park approved for sale; Senior community (senior exemption); Approximately 91 homes in the park; Pets allowed — see remarks; Land lease: $1,102
Exterior
- Parking: Carport; Uncovered parking; RV parking available in park
- Utilities: Electric energy; Public water (PUD); Sewer via park (Cardinal Estates); Power by PUD; Dish satellite connected
- Home design: Manufactured double-wide home; One level; Good condition
- Construction: Metal/vinyl construction materials; Composition roof; Pillar/post/pier foundation; Manufactured house structure
- Exterior features: Metal/vinyl exterior; Paved lot; Has view
Interior
- Kitchen: Dishwasher; Refrigerator; Stove/Range
- Bedrooms: 3 bedrooms
- Flooring: Laminate; Vinyl; Carpet
- Bathrooms: 2 full baths; 1 three-quarter bath; 2 bathtubs; 3 showers
- Heating & cooling: Forced air heating; Heat pump cooling
- Interior features: Water heater (electric, located on back porch); Skylights; Drapes; Walk-in pantry; Walk-in closet; Bath off primary bedroom; Awnings; Double pane windows
- Laundry & utility: Washer; Dryer; Utility room
Neighborhood map
What this means for you Summary
Snapshot
- This is a 3-bed/3.0-bath manufactured listed at $230k.
Deal economics
- At list price, monthly cash flow is $798 ($10k/yr) — positive.
- The deal already cash-flows at list — no discount required.
- Meets the 1% rule at list price ($3k rent vs $230k).
- Recommended offer: $223k (3.0% below list) — sets the bar for market timing.
- Cap rate 10.5% vs local median 2.8% in Lake Stevens — top-decile yield for the area; either an underpriced asset or a hidden risk that comps aren't pricing in. Stress-test before assuming the spread holds.
Location & tenants
- Location reads 83/100 on livability (#51 in WA, #917 nationally) — a professional / high-income tenant draw. Strengths: crime A+, employment A+, housing A+; Watch: amenities C-, cost of living F.
- Lake Stevens School District (suburban): math 57% / reading 70% proficiency, ranked #31 of 291 in WA (top 11%) — acceptable for families but not a draw, mixed tenant base, ~2y average lease.
- Market conditions: Rents flat; 418 active listings in the ZIP; 8 comparable units currently listed for rent nearby; rentals at typical pace (median 24d on market — plan ~3-4 weeks tenant-placement turnaround); high-income renter base; 3,982 units permitted in Snohomish County in 2024 (1,492 in 5+ unit buildings).
Forward outlook
- Local home prices are declining (-3.0%/yr); year-one equity from $2k of loan paydown is wiped out by about $7k of value loss. Plan a longer hold.
- Snohomish County population projected at +30% by 2050 — long-run rental-demand tailwind backs the buy-and-hold thesis.
Negotiation context
- It's been on market 48 days — a 3% lower offer ($223k) is reasonable based on typical stale-listing flexibility.
- 2 sale attempts since 15y ago; this cycle's ask has dropped $30k (12%) from the opening price — seller is motivated, your offer sets the floor, not the list.
Questions for the listing agent
- It's been on market 48 days. Have you received any prior offers? Is the seller open to a 3% concession, seller financing, or rate buy-down credit?
- Is there a deadline driving the sale (1031 exchange, divorce, estate, relocation)? That informs how much negotiation room exists.
- Schools are B-rated — typically a magnet for longer-tenancy family renters. What's the average tenant stay here, and is there a school-zone premium baked into asking?
- What's the average days-on-market for RENTAL listings here right now (not sales)? A rising rental-DOM trend means longer vacancies and softer asking-rent achievability than the comps imply.
- What's the recent tenant-quality profile in this submarket — average credit score on applications, eviction rate, late-payment / NSF rate, and stable-employment percentage? A property-management company in the area should have these aggregated.
- How much new for-sale + rental construction is in the pipeline within 1–3 miles? Heavy new supply typically softens prices + rents 12–24 months out; constrained supply supports both.
Investment metrics
- 1% rule
- 1.31% ✓
- Cap rate
- 10.46%
- Cash-on-cash
- 14.88%
- DSCR
- 1.66
- GRM
- 6.3
CMA / ARV
- ARV (median comp)
- $235,894
- List price
- $229,900
- Delta
- -2.54%
- Verdict
- FAIR
- Comps
- 20 within 1.0 mi
Show comp detail 10 sales within ~0.75 mi
| Address | Dist | Beds/Ba | Sqft | Sold | Price | $/sf | Match |
|---|---|---|---|---|---|---|---|
| 8430 15th Pl SE #88 | 0.00mi | 3/2.0 | 1,782 (0%) | 7mo | $220,000 | $123 | 90 |
| 8430 15th Pl SE #94 | 0.00mi | 3/2.0 | 1,782 (0%) | 7mo | $270,000 | $152 | 90 |
| 8430 15th Pl SE #33 | 0.00mi | 3/2.0 | 1,792 (+1%) | 10mo | $280,500 | $157 | 86 |
| 8430 15th Pl SE #44 | 0.00mi | 3/2.0 | 1,782 (0%) | 12mo | $234,950 | $132 | 86 |
| 8430 15th Pl SE #82 | 0.00mi | 3/2.0 | 1,782 (0%) | 13mo | $236,000 | $132 | 85 |
| 8628 19th St SE | 0.08mi | 4/2.0 (+1) | 1,848 (+4%) | 2mo | $506,000 | $274 | 80 |
| 8430 15th Pl SE #85 | 0.00mi | 3/2.0 | 1,782 (0%) | 23mo | $264,900 | $149 | 76 |
| 8430 15th Pl SE #39 | 0.00mi | 3/2.0 | 1,728 (-3%) | 19mo | $250,000 | $145 | 75 |
| 8430 15th Pl SE #34 | 0.00mi | 3/2.0 | 1,568 (-12%) | 6mo | $249,950 | $159 | 71 |
| 8411 15th Pl SE | 0.21mi | 3/2.0 | 1,620 (-9%) | 7mo | $479,000 | $296 | 65 |
Match score weights: distance 35% · size 25% · config 20% · recency 20%. Top-matched comps best support the ARV.
Projected returns pro-forma
-3.0% appreciation · 0.19% rent growth · sell at horizon
- IRR
- 2.2%
- Equity multiple
- 1.08×
- Total profit
- $5,313
- Equity at exit
- $34,279
- IRR
- 8.8%
- Equity multiple
- 1.59×
- Total profit
- $38,031
- Equity at exit
- $19,878
Cash invested: $64,372 (down + closing). Projections, not guarantees.
Landlord ↔ Tenant lean methodology
- Overall (STATE)
- 28 Tenant-Leaning
- State Washington
- 28 Tenant-Leaning · D+8
- County
- — inherits STATE
- City
- — inherits STATE
ZIP-level market 98258
- Rents YoY
- 0.2%
- Active inventory
- 418
- Price-to-rent
- 6.3×
Monthly cashflow live
- Estimated rent
- $3,021 high interval (Pro) →
- Mortgage (P&I)
- −$1,206
- Tax est. 1.5%
- −$287 /mo · $3,448/yr
- Insurance
- −$96
- HOA
- −$0
- Vacancy / Maint / Mgmt
- −$634
- Net cashflow
- $798
Break-even live
UW: 25.0% down · 7.5% · 30yr · 1.5% tax · 5.0% vac · 8.0% maint · 8.0% mgmt
Financing live
Cash to close
- Down payment
- $57,475
- Closing costs
- $6,897
- Reserves months
- —
- Total cash needed
- —
Loan-product check · same deal, 3 products live
Conventional
25% down · 7.5% · 30yr
- Down + closing
- —
- Monthly P&I
- —
- Monthly cashflow
- —
- DSCR
- —
- Eligible?
- —
Personal DTI + credit; lowest rate.
DSCR
20% down · 8.5% · 30yr
- Down + closing
- —
- Monthly P&I
- —
- Monthly cashflow
- —
- DSCR
- —
- Eligible?
- —
No personal income docs; deal must DSCR.
Hard money
10% down · 12.0% · 12mo
- Down + closing
- —
- Monthly P&I
- —
- Monthly cashflow
- —
- DSCR
- —
- Eligible?
- —
Short-term bridge; refi at stabilization.
Rent comps 8 comps
| Address | Beds | Baths | Sqft | Rent | $/sqft | DOM | Units | Dist |
|---|---|---|---|---|---|---|---|---|
| 7815 14th St SE Lake Stevens, WA | 3.0 | 2.5 | 1587 | $3,100 | $1.95 | 24d | 1 | 0.56mi |
| 9503 15th St SE Unit B Lake Stevens, WA | 3.0 | 1.5 | 2280 | $2,600 | $1.14 | 24d | 1 | 0.58mi |
| 7412 19th Pl SE Lake Stevens, WA | 3.0 | 2.0 | 1374 | $1,400 | $1.02 | 4d | 1 | 0.74mi |
| 609 84th Ave SE Lake Stevens, WA | 4.0 | 3.0 | 1744 | $2,800 | $1.61 | 12d | 1 | 0.74mi |
| 10103 16th Pl SE #1 Lake Stevens, WA | 4.0 | 4.0 | 2105 | $3,100 | $1.47 | 43d | 1 | 0.94mi |
| 9504 Chapel Hill Rd Lake Stevens, WA | 3.0 | 2.5 | 1340 | $2,950 | $2.20 | 5d | 1 | 1.20mi |
| 610 103rd Ct SE Lake Stevens, WA | 3.0 | 2.5 | 1870 | $3,400 | $1.82 | 20d | 1 | 1.30mi |
| 2430 106th Dr SE Lake Stevens, WA | 3.0 | 2.5 | 1830 | $3,000 | $1.64 | 24d | 1 | 1.31mi |
Listing history 20 events
-
2026-06-18days on market $229,900 Active 48 DOM
-
2026-06-17days on market $229,900 Active 47 DOM
-
2026-06-16days on market $229,900 Active 46 DOM
-
2026-06-15days on market $229,900 Active 45 DOM
-
2026-06-13days on market $229,900 Active 43 DOM
-
2026-06-13days on market $229,900 Active 42 DOM
-
2026-06-09days on market $229,900 Active 39 DOM
-
2026-06-08days on market $229,900 Active 38 DOM
-
2026-06-07days on market $229,900 Active 37 DOM
-
2026-06-04days on market $229,900 Active 34 DOM
-
2026-06-03days on market $229,900 Active 33 DOM
-
2026-06-02days on market $229,900 Active 32 DOM
-
2026-06-01days on market $229,900 Active 31 DOM
-
2026-05-31days on market $229,900 Active 30 DOM
-
2026-05-15price $229,900
-
2026-05-08price $239,900
-
2026-05-01$259,900 Active
-
2012-03-19status Pending
-
2012-01-24price
-
2011-10-06Active
ⓘ Source: listings_history table (triggers on properties + properties_extension) + one-shot
backfill from property_details.listing_events for pre-trigger history.
Nearby sold comps map
Loading sold comps map…
Walkable amenities ~0.75 mi
Loading nearby amenities…
Taxation est. · year 1
- Rental income
- $36,256
- − Mortgage interest
- −$12,878
- − Property taxes
- −$3,448
- − Insurance
- −$1,150
- − Repairs & maintenance
- −$2,900
- − Management
- −$2,900
- − Depreciation
- −$6,688
- Taxable income
- $6,291
- Est. tax owed @ 24.0%
- −$1,510
- After-tax cash flow
- $8,067/yr
For passive investors: Depreciation is non-cash, so a rental often shows a tax loss while cash-flowing — sheltering income. Rental losses are passive: they offset passive income freely, and up to $25,000/yr can offset ordinary (W-2) income if you actively participate and your MAGI is under $100k (phasing out to $0 by $150k); unused losses carry forward. On sale, claimed depreciation is recaptured at up to 25%, and gains may owe capital-gains tax (a 1031 exchange can defer both). Figures are a year-1 estimate at your 24.0% rate — not tax advice; consult a CPA.
Schools (NCES district)
- District
- Lake Stevens School District
- NCES district ID
- 5304200
- Math proficiency
- 57% ▼ -2.00%
- Reading proficiency
- 70% ▬ 0.00%
- Median HH income
- $78,301
- Composite
- 58.12/100
- National rank
- #2141
- State rank
- #31 of 291 in WA
Livability — Lake Stevens
- Score
- 83/100
- State rank
- #51
- US rank
- #917
Category grades
Schools grade is shown separately in the Schools card above.
Census & demographics
- Census place
- Lake Stevens, WA
- County
- Snohomish County · 786,756 people
- City population
- 52,752
- Metro
- Seattle-Tacoma-Bellevue, WA
- Population (ZIP)
- 52,752
- Household income
- $123,898
- Rent vs Own
- Severe rent burden
- 786.0
Population outlook (Snohomish County) Hauer SSP2
- Today (2025)
- 899,800 people
- By 2030
- 960,975 · +6.8%
- By 2040
- 1,074,447 · +19.4%
- By 2050
- 1,171,954 · +30.2%
- By 2075
- 1,384,849 · +53.9%
- By 2100
- 1,497,296 · +66.4%
Race, ethnicity, and origin ACS 2023
- Neighborhood character
- Predominantly White (73%)
- Race & ethnicity
- White 73% Hispanic / Latino 12% Two or more races 11% Asian 6% Black 2%
- Hispanic origin (detail)
- Mexican 7%
- Common ancestry
- Portuguese 7% Italian 3% Slovak 2%
- Foreign-born
- 10% · Canada, Vietnam, China
- Languages at home
- 87% English-only · Spanish 5% Russian/Polish/Slavic 2% Other Indo-European 1%
Political lean MEDSL · Snohomish
- 2024 margin
- D (+19.0) · D 57.8% · R 38.9% · Other 3.3%
- 2008→2024 swing
- +0.1pp no change · 2008: 18.9pp · 2024: 19.0pp
- All cycles
- 2024: D+19.0 2020: D+20.6 2016: D+16.6 2012: D+16.2 2008: D+18.9
Not yet ingested
- Civics
- —
Market trends
- HPI YoY
- ▼ -725.77%
- Current HPI
- 303.8934
- Rent YoY
- ▲ 0.19%
- Metro
- Seattle-Tacoma-Bellevue, WA
- State GDP YoY
- ▲ 4.65%
- F500 in state
- 22
Industry mix (Fortune 500 HQ in WA)
| Industry | F500 HQs | Revenue |
|---|---|---|
| Retail | 2 | $269B |
|
||
| Technology / Retail | 1 | $638B |
|
||
| Technology | 1 | $245B |
|
||
| Telecommunications | 1 | $38B |
|
||
| Food / Beverage | 1 | $36B |
|
||
| Automotive / Trucks | 1 | $34B |
|
||
Price history
-11.5% since first listed6 events — show timeline
- 2026-05-15 Price Changed $229,900 NWMLS as Distributed by MLS Grid
- 2026-05-08 Price Changed $239,900 NWMLS as Distributed by MLS Grid
- 2026-05-01 Listed $259,900 NWMLS as Distributed by MLS Grid
- 2012-03-19 Pending — NWMLS as Distributed by MLS Grid
- 2012-01-24 Price Changed — NWMLS as Distributed by MLS Grid
- 2011-10-06 Listed — NWMLS as Distributed by MLS Grid
Property tax history
-30.9%/yrLatest (2022): $5 · -1.3% YoY. Source: county tax records.
Cash-flow waterfall
monthlySold comps — $/sqft
last 12 mo · ≤1 miLoading sold comps…