 Fourplex
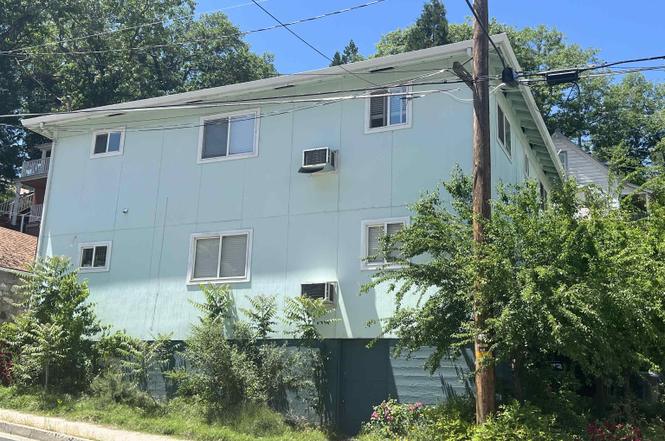
4300 Pine St Unit Tenant · Dunsmuir, CA
Flood risk 9/10 · Severe
- FEMA flood zone
- X (unshaded)
- Chance of flooding over 30 yrs
- 0.99%
- Est. flood insurance / yr
- $507 – $1,088
Fire risk 7/10 · Major
- Est. fire insurance / yr
- $659 – $1,223
Heat risk 6/10 · Moderate
- Hot days now (above 95°F)
- 10 days/yr
- Hot days in 30 yrs
- 24 days/yr
Wind risk 1/10 · Minimal
- Chance of severe wind over 30 yrs
- —
Air-quality risk 10/10 · Severe
- Unhealthy air days now
- 51 days/yr
- Unhealthy air days in 30 yrs
- 52 days/yr
Risk factors via First Street. Map © Google.
Why this score? — see what drove the D- grade
The composite is a weighted blend of 9 inputs, each scored 0–100. Each bar is that input's sub-score; the figure is the points it added to the 100-point composite (weight × sub-score).
- Cash flow +12.9/30.0
- ARV discount +7.5/15.0
- Schools +4.1/10.0
- DSCR +3.9/10.0
- 1% rule +3.7/10.0
- Livability +2.7/5.0
- Rent growth +2.5/5.0
- Condition / age +2.5/5.0
- Appreciation +0.0/10.0
$450,000
🖨 Deal sheet (PDF) 📄 Offer letter ✓ Due diligence
Multi-family units
County records classify this as Multi-Family (2-4 Unit). Listing-text estimate: 4 units. confirmed
Listing remarks
Great income generating property just steps from downtown Dunsmuir. Newly renovated with amazing tenants in place. Clean & Tidy - what more could you ask for. All four units are one bedroom one bath. Back patio for the lower units is shared, and upstairs units share a deck. There is a full basement as well, where every tenant has a storage space, and paid laundry for extra income. Call for a tour today!
Key facts
- Full basement
- Storage space
- Newly renovated
Tags
Property features AI
Exterior
- Parking: Gravel parking
- Utilities: Public water
- Home design: Multi-family residential income property; 2 stories
- Construction: Wood siding; Composition roof
- Exterior features: Deck; Patio; Wood fencing
Interior
- Kitchen: Refrigerator
- Flooring: Carpet; Laminate; Vinyl
- Heating & cooling: Wall/window air conditioning unit(s); Has cooling
- Interior features: Full basement; Basement laundry (washer located in basement)
- Laundry & utility: Washer (in basement)
Neighborhood map
What this means for you Summary
Snapshot
- This is a 4 × 1-bed/1.0-bath units multifamily listed at $450k.
Deal economics
- At list price, monthly cash flow is $-95 ($-1k/yr) — negative. Per door: $-24/mo.
- To cash-flow at today's rent, offer at most $436k (3.1% below list).
- To meet the 1% rule (rent ≥ 1% of price), the offer needs to be $390k (13.3% below list).
- Recommended offer: $390k (13.3% below list) — sets the bar for 1% rule.
- Cap rate 6.2% vs local median 3.8% in Dunsmuir — top-decile yield for the area; either an underpriced asset or a hidden risk that comps aren't pricing in. Stress-test before assuming the spread holds.
Location & tenants
- Location reads 53/100 on livability (#967 in CA) — a working-class tenant base; expect higher turnover. Strengths: housing A-; Watch: cost of living D+, schools D, crime F.
- Dunsmuir Joint Union High (rural): math 25% / reading 75% proficiency, ranked #163 of 517 in CA (top 32%) — acceptable for families but not a draw, mixed tenant base, ~2y average lease.
- Market conditions: 36 active listings in the ZIP; 50 units permitted in Siskiyou County in 2024 (0 in 5+ unit buildings).
Forward outlook
- Local home prices are declining (-3.0%/yr); year-one equity from $3k of loan paydown is wiped out by about $14k of value loss. Plan a longer hold.
- Siskiyou County population projected at -26% by 2050 — secular population decline; favor cash flow + early exit over multi-decade hold.
Negotiation context
- It's been on market 103 days — a 9% lower offer ($410k) is reasonable based on typical stale-listing flexibility.
Risks & watch-outs
- Watch-outs: flood insurance adds $66/mo.
- Climate carrying-cost: severe flood risk; major wildfire risk; extreme-heat days projected 10→24/yr by 2055 (HVAC capex compounding) — expect insurance premiums to compound above CPI over the hold.
Questions for the listing agent
- What do current leases actually rent for vs. the listed asking? Can we see a recent rent roll and the last 12 months of T-12 income?
- It's been on market 103 days. Have you received any prior offers? Is the seller open to a 13% concession, seller financing, or rate buy-down credit?
- Can we see the unit-by-unit rent roll, current vacancy, and any below-market leases? What's the average tenancy length?
- What capital expenditures (roof, boiler, parking lot, exteriors) have been made in the last 5 years, and what's planned in the next 2?
- What's the actual annual flood-insurance premium (NFIP or private), and is the property in a SFHA with mandatory coverage?
- Why hasn't it sold? Are there any deal-killer items the seller is aware of (foundation, flood, title, zoning, code violations)?
- Is there a deadline driving the sale (1031 exchange, divorce, estate, relocation)? That informs how much negotiation room exists.
- Schools are D-rated, which usually means shorter tenancies and higher turnover. Who's the typical renter profile here, and what's been the actual vacancy rate?
- Crime grade is F in this area — have there been break-ins, vandalism, or insurance claims at this property in the last 3 years? What carrier currently insures it and at what premium?
- The area grade is low — what's the realistic commute time and amenity access for the typical tenant pool here? Any planned neighborhood developments (good or bad) we should know about?
- What's the average days-on-market for RENTAL listings here right now (not sales)? A rising rental-DOM trend means longer vacancies and softer asking-rent achievability than the comps imply.
- What's the recent tenant-quality profile in this submarket — average credit score on applications, eviction rate, late-payment / NSF rate, and stable-employment percentage? A property-management company in the area should have these aggregated.
- How much new apartment / multifamily construction is in the pipeline within 1–3 miles? Heavy new supply (>2% of stock underway) typically softens rents 12–24 months out; light construction supports rent growth.
Investment metrics
- 1% rule
- 0.87% ✗
- Cap rate
- 6.22%
- Cash-on-cash
- -0.27%
- DSCR
- 0.99
- GRM
- 9.6
CMA / ARV
No comps found within radius.
Projected returns pro-forma
-3.0% appreciation · 3.0% rent growth · sell at horizon
- IRR
- -17.8%
- Equity multiple
- 0.37×
- Total profit
- $-78,890
- Equity at exit
- $67,096
- IRR
- -9.9%
- Equity multiple
- 0.40×
- Total profit
- $-76,107
- Equity at exit
- $38,908
Cash invested: $126,000 (down + closing). Projections, not guarantees.
Landlord ↔ Tenant lean methodology
- Overall (STATE)
- 18 Strongly Tenant-Friendly
- State California
- 18 Strongly Tenant-Friendly · D+13
- County
- — inherits STATE
- City
- — inherits STATE
ZIP-level market 96025
- Active inventory
- 36
- Price-to-rent
- 38.5×
Monthly cashflow live
- Estimated rent
- $3,900 medium interval (Pro) →
- Mortgage (P&I)
- −$2,360
- Tax est. 1.5%
- −$562 /mo · $6,750/yr
- Insurance
- −$188
- Flood insurance flood zone
- −$66 /mo · $798/yr
- HOA
- −$0
- Vacancy / Maint / Mgmt
- −$819
- Net cashflow
- $-95
Break-even live
Sensitivity live
| Price | -10% $216 | -5% $60 | +0% $-95 | +5% $-251 | +10% $-406 |
|---|---|---|---|---|---|
| Rent | -10% $-403 | -5% $-249 | +0% $-95 | +5% $59 | +10% $213 |
| Rate | -1.0pp $131 | -0.5pp $19 | base $-95 | +0.5pp $-212 | +1.0pp $-331 |
4-unit breakdown (identical units grouped — click to expand)
| Units | Beds | Baths | Est. rent |
|---|---|---|---|
| 4× units | 1 | 1 | $3,900 |
| #1 | 1 | 1 | $975 |
| #2 | 1 | 1 | $975 |
| #3 | 1 | 1 | $975 |
| #4 | 1 | 1 | $975 |
| Total (4 units) | $3,900 | ||
UW: 25.0% down · 7.5% · 30yr · 1.5% tax · 5.0% vac · 8.0% maint · 8.0% mgmt
Financing live
Cash to close
- Down payment
- $112,500
- Closing costs
- $13,500
- Reserves months
- —
- Total cash needed
- —
Loan-product check · same deal, 3 products live
Conventional
25% down · 7.5% · 30yr
- Down + closing
- —
- Monthly P&I
- —
- Monthly cashflow
- —
- DSCR
- —
- Eligible?
- —
Personal DTI + credit; lowest rate.
DSCR
20% down · 8.5% · 30yr
- Down + closing
- —
- Monthly P&I
- —
- Monthly cashflow
- —
- DSCR
- —
- Eligible?
- —
No personal income docs; deal must DSCR.
Hard money
10% down · 12.0% · 12mo
- Down + closing
- —
- Monthly P&I
- —
- Monthly cashflow
- —
- DSCR
- —
- Eligible?
- —
Short-term bridge; refi at stabilization.
Listing history 18 events
-
2026-06-21days on market $450,000 Active 103 DOM
-
2026-06-19days on market $450,000 Active 101 DOM
-
2026-06-18days on market $450,000 Active 100 DOM
-
2026-06-17days on market $450,000 Active 99 DOM
-
2026-06-16days on market $450,000 Active 98 DOM
-
2026-06-15days on market $450,000 Active 97 DOM
-
2026-06-14days on market $450,000 Active 95 DOM
-
2026-06-12days on market $450,000 Active 94 DOM
-
2026-06-09days on market $450,000 Active 91 DOM
-
2026-06-08days on market $450,000 Active 90 DOM
-
2026-06-07days on market $450,000 Active 89 DOM
-
2026-06-07days on market $450,000 Active 88 DOM
-
2026-06-04days on market $450,000 Active 85 DOM
-
2026-06-02days on market $450,000 Active 84 DOM
-
2026-06-01days on market $450,000 Active 83 DOM
-
2026-05-31days on market $450,000 Active 82 DOM
-
2026-05-31days on market $450,000 Active 81 DOM
-
2026-03-10$450,000 Active
ⓘ Source: listings_history table (triggers on properties + properties_extension) + one-shot
backfill from property_details.listing_events for pre-trigger history.
Climate risk First Street
- Flood 9/10 Extreme FEMA zone X (unshaded) · 99% chance over 30 yrs
- Wildfire 7/10 Severe
- Heat 6/10 Major 10 d/yr ≥95°F today · 24 d/yr by 30 yrs out
- Wind 1/10 Low
- Air quality 10/10 Extreme 51 unhealthy d/yr today · 52 by 30 yrs out
Nearby sold comps map
Loading sold comps map…
Walkable amenities ~0.75 mi
Loading nearby amenities…
Taxation est. · year 1
- Rental income
- $46,800
- − Mortgage interest
- −$25,207
- − Property taxes
- −$6,750
- − Insurance
- −$3,048
- − Repairs & maintenance
- −$3,744
- − Management
- −$3,744
- − Depreciation
- −$13,091
- Taxable loss
- −$8,783
- Est. tax savings @ 24.0%
- +$2,108
- After-tax cash flow
- $964/yr
For passive investors: Depreciation is non-cash, so a rental often shows a tax loss while cash-flowing — sheltering income. Rental losses are passive: they offset passive income freely, and up to $25,000/yr can offset ordinary (W-2) income if you actively participate and your MAGI is under $100k (phasing out to $0 by $150k); unused losses carry forward. On sale, claimed depreciation is recaptured at up to 25%, and gains may owe capital-gains tax (a 1031 exchange can defer both). Figures are a year-1 estimate at your 24.0% rate — not tax advice; consult a CPA.
Schools (NCES district)
- District
- Dunsmuir Joint Union High
- NCES district ID
- 0611700
- Math proficiency
- 25% ▲ 25.00%
- Reading proficiency
- 75% ▲ 75.00%
- Median HH income
- $32,255
- Composite
- 40.88/100
- National rank
- #3620
- State rank
- #163 of 517 in CA
Livability — Dunsmuir
- Score
- 53/100
- State rank
- #967
- US rank
- #24546
Category grades
Schools grade is shown separately in the Schools card above.
Census & demographics
- Census place
- Dunsmuir, CA
- Population (ZIP)
- 2,150
Population outlook (Siskiyou County) Hauer SSP2
- Today (2025)
- 39,337 people
- By 2030
- 36,930 · -6.1%
- By 2040
- 32,367 · -17.7%
- By 2050
- 29,030 · -26.2%
- By 2075
- 23,534 · -40.2%
- By 2100
- 19,312 · -50.9%
Race, ethnicity, and origin ACS 2023
- Neighborhood character
- Predominantly White (76%)
- Race & ethnicity
- White 76% Two or more races 13% Hispanic / Latino 12% Asian 1% Black 1% Native American 1%
- Hispanic origin (detail)
- Mexican 9%
- Common ancestry
- Italian 4% Romanian 4% Lithuanian 3%
- Foreign-born
- 6% · Canada, China, South Korea
- Languages at home
- 94% English-only · Spanish 4% Other Indo-European 1%
Political lean MEDSL · Siskiyou
- 2024 margin
- R (+19.2) · D 38.8% · R 58.0% · Other 3.2%
- 2008→2024 swing
- -8.8pp toward R · 2008: -10.4pp · 2024: -19.2pp
- All cycles
- 2024: R+19.2 2020: R+15.8 2016: R+20.7 2012: R+15.6 2008: R+10.4
Not yet ingested
- Civics
- —
Market trends
- HPI YoY
- ▼ -140.66%
- Current HPI
- 144.676
- Rent YoY
- —
- Metro
- —
- State GDP YoY
- ▲ 3.21%
- F500 in state
- 116
Industry mix (Fortune 500 HQ in CA)
| Industry | F500 HQs | Revenue |
|---|---|---|
| Technology | 27 | $1,492B |
|
||
| Financial Services | 3 | $174B |
|
||
| Retail | 3 | $44B |
|
||
| Insurance | 3 | $26B |
|
||
| Media / Entertainment | 2 | $115B |
|
||
| Pharmaceuticals / Biotech | 2 | $62B |
|
||
Price history
1 event — show timeline
- 2026-03-10 Listed $450,000 SMLS
Cash-flow waterfall
monthlySold comps — $/sqft
last 12 mo · ≤1 miLoading sold comps…