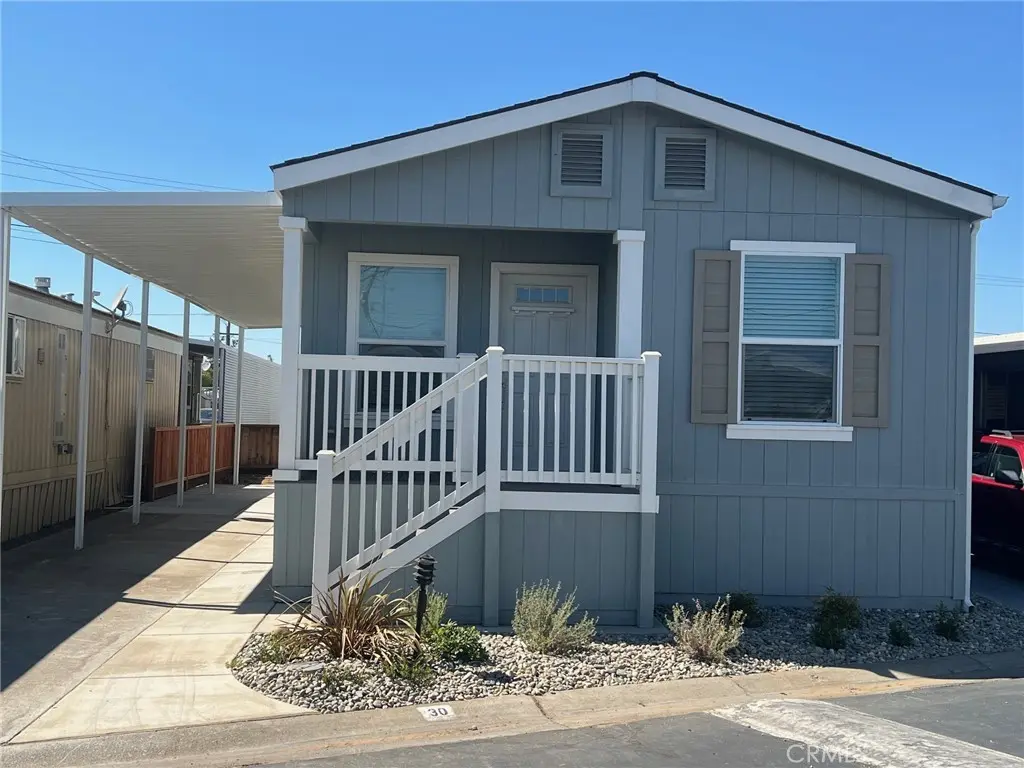
30 Otsego St · Oakley, CA
Flood risk 4/10 · Minor
- FEMA flood zone
- X (unshaded)
- Chance of flooding over 30 yrs
- 0.22%
- Est. flood insurance / yr
- $507 – $1,088
Fire risk 5/10 · Moderate
- Est. fire insurance / yr
- $659 – $1,223
Heat risk 6/10 · Moderate
- Hot days now (above 101°F)
- 7 days/yr
- Hot days in 30 yrs
- 14 days/yr
Wind risk 1/10 · Minimal
- Chance of severe wind over 30 yrs
- —
Air-quality risk 9/10 · Severe
- Unhealthy air days now
- 17 days/yr
- Unhealthy air days in 30 yrs
- 18 days/yr
Risk factors via First Street. Map © Google.
Why this score? — see what drove the C grade
The composite is a weighted blend of 9 inputs, each scored 0–100. Each bar is that input's sub-score; the figure is the points it added to the 100-point composite (weight × sub-score).
- Cash flow +26.1/30.0
- DSCR +8.8/10.0
- 1% rule +6.9/10.0
- Condition / age +4.0/5.0
- Schools +3.8/10.0
- Rent growth +3.4/5.0
- Livability +3.0/5.0
- ARV discount +0.0/15.0
- Appreciation +0.0/10.0
$199,000
🖨 Deal sheet 📄 Offer letter ✓ Due diligence
Listing remarks
Striking NEW 2 bed / 2 bath home located in the desirable Eagle City Mobile Home Park. This beautiful home features modern touches with stainless steel kitchen appliances, recessed LED can lights, and beautiful custom cabinets. Other fabulous features include double pane windows, a laundry room with washer and dryer hookups, and a spacious carport for your vehicle. Enjoy the nearby parks, shopping areas and great restaurants. Have it all with this beautiful home, book an appointment today! A brand new Clayton Fairpoint 54 x 20 serial#: SAC039591CA A/B.
Key facts
- Custom cabinets
- Laundry room
- Double pane windows
Tags
Neighborhood map
What this means for you Summary
Snapshot
- This is a 2-bed/2.0-bath manufactured listed at $199k. Condition is rated good.
Deal economics
- At list price, monthly cash flow is $499 ($6k/yr) — positive.
- The deal already cash-flows at list — no discount required.
- Meets the 1% rule at list price ($2k rent vs $199k).
- Cap rate 9.3% vs local median 3.3% in Oakley — top-decile yield for the area; either an underpriced asset or a hidden risk that comps aren't pricing in. Stress-test before assuming the spread holds.
Location & tenants
- Location reads 60/100 on livability (#608 in CA) — a middle-class / working-renter tenant base. Strengths: employment A+, housing A+, crime A; Watch: schools D-, amenities F, commute F.
- Antioch Unified (suburban): math 29% / reading 55% proficiency, ranked #200 of 517 in CA (top 39%) — families likely to look elsewhere, expect single-tenant / working-renter base with shorter leases.
- Market conditions: Rents rising (+3.7%/yr); 234 active listings in the ZIP; 5 comparable units currently listed for rent nearby; rentals leasing fast (median 2d on market — plan ~1-2 weeks tenant-placement turnaround); high-income renter base; 2,169 units permitted in Contra Costa County in 2024 (896 in 5+ unit buildings).
Forward outlook
- Local home prices are declining (-3.0%/yr); year-one equity from $1k of loan paydown is wiped out by about $6k of value loss. Plan a longer hold.
- Contra Costa County population projected at +26% by 2050 — long-run rental-demand tailwind backs the buy-and-hold thesis.
- At projected returns (-3.0% appreciation + 3.7% rent growth), your $56k cash investment doubles in ~10 years — after that, you're playing with house money.
Negotiation context
- Only 9 days on market — expect competitive offers; lowballing is unlikely to land.
Risks & watch-outs
- Climate carrying-cost: moderate wildfire risk; extreme-heat days projected 7→14/yr by 2055 (HVAC capex compounding) — expect insurance premiums to compound above CPI over the hold.
Questions for the listing agent
- Is there a deadline driving the sale (1031 exchange, divorce, estate, relocation)? That informs how much negotiation room exists.
- Schools are D-rated, which usually means shorter tenancies and higher turnover. Who's the typical renter profile here, and what's been the actual vacancy rate?
- What's the average days-on-market for RENTAL listings here right now (not sales)? A rising rental-DOM trend means longer vacancies and softer asking-rent achievability than the comps imply.
- What's the recent tenant-quality profile in this submarket — average credit score on applications, eviction rate, late-payment / NSF rate, and stable-employment percentage? A property-management company in the area should have these aggregated.
- How much new for-sale + rental construction is in the pipeline within 1–3 miles? Heavy new supply typically softens prices + rents 12–24 months out; constrained supply supports both.
Investment metrics
- 1% rule
- 1.19% ✓
- Cap rate
- 9.30%
- Cash-on-cash
- 10.74%
- DSCR
- 1.48
- GRM
- 7.0
CMA / ARV
- ARV (median comp)
- $159,843
- List price
- $199,000
- Delta
- 37.01%
- Verdict
- OVERPRICED
- Comps
- 20 within 1.0 mi
Show comp detail 5 sales within ~0.75 mi
| Address | Dist | Beds/Ba | Sqft | Sold | Price | $/sf | Match |
|---|---|---|---|---|---|---|---|
| 14 Geneseo St | 0.03mi | 2/2.0 | 1,020 (+5%) | 6mo | $184,950 | $181 | 86 |
| 69 Oneida St | 0.06mi | 2/2.0 | 960 (-1%) | 21mo | $180,000 | $188 | 78 |
| 24 Otsego St | 0.03mi | 2/2.0 | 1,080 (+11%) | 11mo | $199,500 | $185 | 71 |
| 19 Otsego St | 0.02mi | 2/2.0 | 1,100 (+13%) | 14mo | $215,000 | $195 | 66 |
| 105 Ontario St | 0.04mi | 3/2.0 (+1) | 1,040 (+7%) | 24mo | $190,000 | $183 | 62 |
Match score weights: distance 35% · size 25% · config 20% · recency 20%. Top-matched comps best support the ARV.
Projected returns pro-forma
-3.0% appreciation · 3.68% rent growth · sell at horizon
- IRR
- 0.5%
- Equity multiple
- 1.02×
- Total profit
- $1,177
- Equity at exit
- $29,672
- IRR
- 10.9%
- Equity multiple
- 1.88×
- Total profit
- $48,857
- Equity at exit
- $17,206
Cash invested: $55,720 (down + closing). Projections, not guarantees.
Landlord ↔ Tenant lean methodology
- Overall (STATE)
- 18 Strongly Tenant-Friendly
- State California
- 18 Strongly Tenant-Friendly · D+13
- County
- — inherits STATE
- City
- — inherits STATE
ZIP-level market 94561
- Rents YoY
- 3.7%
- Active inventory
- 234
- Price-to-rent
- 7.0×
Monthly cashflow live
- Estimated rent
- $2,372 high interval (Pro) →
- Mortgage (P&I)
- −$1,044
- Tax est. 1.5%
- −$249 /mo · $2,985/yr
- Insurance
- −$83
- HOA
- −$0
- Vacancy / Maint / Mgmt
- −$498
- Net cashflow
- $499
Break-even live
UW: 25.0% down · 7.5% · 30yr · 1.5% tax · 5.0% vac · 8.0% maint · 8.0% mgmt
Financing live
Cash to close
- Down payment
- $49,750
- Closing costs
- $5,970
- Reserves months
- —
- Total cash needed
- —
Loan-product check · same deal, 3 products live
Conventional
25% down · 7.5% · 30yr
- Down + closing
- —
- Monthly P&I
- —
- Monthly cashflow
- —
- DSCR
- —
- Eligible?
- —
Personal DTI + credit; lowest rate.
DSCR
20% down · 8.5% · 30yr
- Down + closing
- —
- Monthly P&I
- —
- Monthly cashflow
- —
- DSCR
- —
- Eligible?
- —
No personal income docs; deal must DSCR.
Hard money
10% down · 12.0% · 12mo
- Down + closing
- —
- Monthly P&I
- —
- Monthly cashflow
- —
- DSCR
- —
- Eligible?
- —
Short-term bridge; refi at stabilization.
Rent comps 5 comps
| Address | Beds | Baths | Sqft | Rent | $/sqft | DOM | Units | Dist |
|---|---|---|---|---|---|---|---|---|
| 49 Carol Ln Oakley, CA | 1.0–3.0 | 1.0–2.0 | 686 | $2,134 | $3.11 | 1d | 1 | 0.27mi |
| 69 Carol Ln Oakley, CA | 1.0–3.0 | 1.0–2.0 | 802 | $1,813 | $2.26 | 1d | 9 | 0.28mi |
| 4290 Mehaffey Way Oakley, CA | 2.0 | 2.0 | 750 | $2,295 | $3.06 | 1d | 1 | 0.92mi |
| 3560 E 18th St Antioch, CA | 1.0–3.0 | 1.0–2.0 | 828 | $1,954 | $2.36 | 3d | 1 | 1.33mi |
| 3560 E 18th St Antioch, CA | 1.0–3.0 | 1.0–2.0 | 828 | $1,772 | $2.14 | 1d | 9 | 1.33mi |
Listing history 15 events
-
2026-06-18days on market $199,000 Active 9 DOM
-
2026-06-17days on market $199,000 Active 8 DOM
-
2026-06-16days on market $199,000 Active 7 DOM
-
2026-06-15days on market $199,000 Active 6 DOM
-
2026-06-13days on market $199,000 Active 4 DOM
-
2026-06-13days on market $199,000 Active 3 DOM
-
2026-06-10pricedays on market $199,000 Active 1 DOM
-
2026-06-09days on market $219,000 Active 251 DOM
-
2026-06-08days on market $219,000 Active 250 DOM
-
2026-06-07days on market $219,000 Active 249 DOM
-
2026-06-04days on market $219,000 Active 246 DOM
-
2026-06-03days on market $219,000 Active 245 DOM
-
2026-06-02statusdays on market $219,000 Active 244 DOM
-
2026-03-12price $219,000
-
2025-09-16$234,900 Active
ⓘ Source: listings_history table (triggers on properties + properties_extension) + one-shot
backfill from property_details.listing_events for pre-trigger history.
Climate risk First Street
- Flood 4/10 Moderate FEMA zone X (unshaded) · 22% chance over 30 yrs
- Wildfire 5/10 Major
- Heat 6/10 Major 7 d/yr ≥101°F today · 14 d/yr by 30 yrs out
- Wind 1/10 Low
- Air quality 9/10 Extreme 17 unhealthy d/yr today · 18 by 30 yrs out
Nearby sold comps map
Loading sold comps map…
Walkable amenities ~0.75 mi
Loading nearby amenities…
Taxation est. · year 1
- Rental income
- $28,463
- − Mortgage interest
- −$11,147
- − Property taxes
- −$2,985
- − Insurance
- −$995
- − Repairs & maintenance
- −$2,277
- − Management
- −$2,277
- − Depreciation
- −$5,789
- Taxable income
- $2,993
- Est. tax owed @ 24.0%
- −$718
- After-tax cash flow
- $5,265/yr
For passive investors: Depreciation is non-cash, so a rental often shows a tax loss while cash-flowing — sheltering income. Rental losses are passive: they offset passive income freely, and up to $25,000/yr can offset ordinary (W-2) income if you actively participate and your MAGI is under $100k (phasing out to $0 by $150k); unused losses carry forward. On sale, claimed depreciation is recaptured at up to 25%, and gains may owe capital-gains tax (a 1031 exchange can defer both). Figures are a year-1 estimate at your 24.0% rate — not tax advice; consult a CPA.
Condition & rehab AI · 12 photos
This well-maintained mobile home in Eagle City Mobile Home Park is move-in ready with modern updates and a good condition score.
Value-add opportunities
- Both Paint exterior siding — Enhances curb appeal and value
- Both Replace carpet with hardwood flooring — Improves aesthetics and increases value
- Both Install smart home devices — Enhances convenience and adds modern appeal
Renovation cost estimate screening
Value-add ROI direction
- Both Paint exterior siding — Enhances curb appeal and value ↑
- Both Replace carpet with hardwood flooring — Improves aesthetics and increases value ↑
- Both Install smart home devices — Enhances convenience and adds modern appeal ↑
ⓘ Cost ranges are severity-bucket heuristics (US national rule-of-thumb). Get contractor quotes + a written scope before underwriting a rehab budget.
Schools (NCES district)
- District
- Antioch Unified
- NCES district ID
- 0602850
- Math proficiency
- 29% ▲ 12.00%
- Reading proficiency
- 55% ▲ 25.00%
- Median HH income
- $65,935
- Composite
- 37.57/100
- National rank
- #4386
- State rank
- #200 of 517 in CA
Livability — Oakley
- Score
- 60/100
- State rank
- #608
- US rank
- #19421
Category grades
Schools grade is shown separately in the Schools card above.
Census & demographics
- Census place
- Oakley, CA
- County
- Contra Costa County · 1,059,880 people
- City population
- 46,368
- Metro
- San Francisco-Oakland-Berkeley, CA
- Population (ZIP)
- 46,368
- Household income
- $134,678
- Rent vs Own
- Severe rent burden
- 614.0
Population outlook (Contra Costa County) Hauer SSP2
- Today (2025)
- 1,287,720 people
- By 2030
- 1,364,937 · +6.0%
- By 2040
- 1,506,209 · +17.0%
- By 2050
- 1,624,373 · +26.1%
- By 2075
- 1,853,193 · +43.9%
- By 2100
- 1,901,231 · +47.6%
Race, ethnicity, and origin ACS 2023
- Neighborhood character
- Diverse neighborhood (Simpson 0.69)
- Race & ethnicity
- White 43% Hispanic / Latino 34% Two or more races 15% Asian 9% Black 9%
- Hispanic origin (detail)
- Mexican 25% Puerto Rican 1%
- Common ancestry
- Italian 2% Russian 2% Slovak 2%
- Foreign-born
- 18% · Canada, China
- Languages at home
- 70% English-only · Spanish 21% Tagalog/Filipino 4% Other Indo-European 3%
Political lean MEDSL · Contra Costa
- 2024 margin
- Solid D (+38.0) · D 67.3% · R 29.4% · Other 3.3%
- 2008→2024 swing
- +0.2pp no change · 2008: 37.8pp · 2024: 38.0pp
- All cycles
- 2024: D+38.0 2020: D+45.3 2016: D+43.5 2012: D+33.7 2008: D+37.8
Not yet ingested
- Civics
- —
Market trends
- HPI YoY
- ▼ -249.42%
- Current HPI
- 301.9916
- Rent YoY
- ▲ 3.68%
- Metro
- San Francisco-Oakland-Berkeley, CA
- State GDP YoY
- ▲ 3.21%
- F500 in state
- 116
Industry mix (Fortune 500 HQ in CA)
| Industry | F500 HQs | Revenue |
|---|---|---|
| Technology | 27 | $1,492B |
|
||
| Financial Services | 3 | $174B |
|
||
| Retail | 3 | $44B |
|
||
| Insurance | 3 | $26B |
|
||
| Media / Entertainment | 2 | $115B |
|
||
| Pharmaceuticals / Biotech | 2 | $62B |
|
||
Price history
-6.8% since first listed2 events — show timeline
- 2026-03-12 Price Changed $219,000 CRMLS
- 2025-09-16 Listed $234,900 CRMLS
Cash-flow waterfall
monthlySold comps — $/sqft
last 12 mo · ≤1 miLoading sold comps…