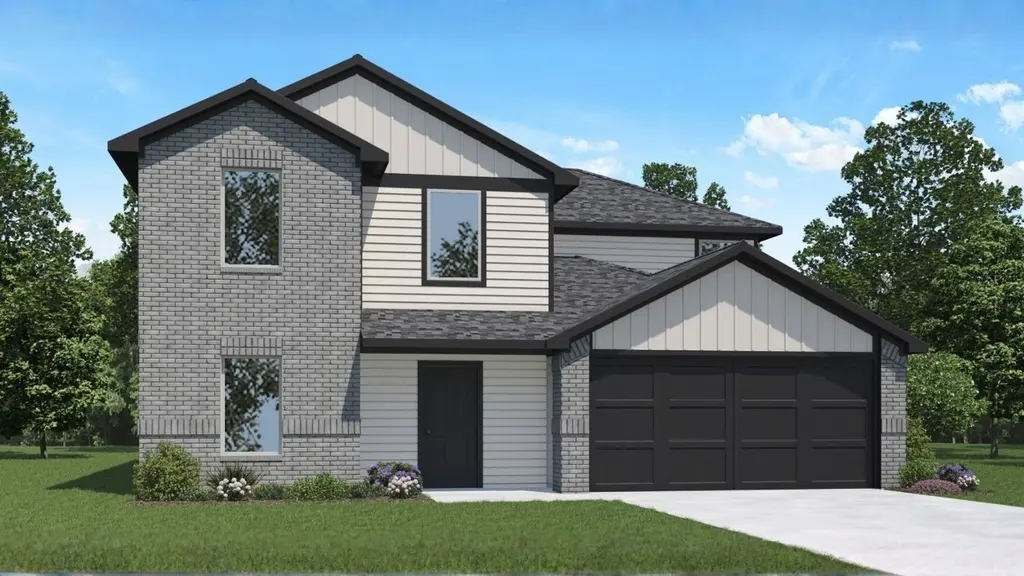
4529 Nevada Falls Dr · Conroe, TX
Flood risk No data
- FEMA flood zone
- —
- Chance of flooding over 30 yrs
- —
- Est. flood insurance / yr
- —
Fire risk No data
- Est. fire insurance / yr
- —
Heat risk No data
- Hot days now (above threshold)
- —
- Hot days in 30 yrs
- —
Wind risk No data
- Chance of severe wind over 30 yrs
- —
Air-quality risk No data
- Unhealthy air days now
- —
- Unhealthy air days in 30 yrs
- —
Risk factors via First Street. Map © Google.
Why this score? — see what drove the D grade
The composite is a weighted blend of 9 inputs, each scored 0–100. Each bar is that input's sub-score; the figure is the points it added to the 100-point composite (weight × sub-score).
- Cash flow +11.9/30.0
- ARV discount +11.7/15.0
- Schools +5.1/10.0
- Livability +3.7/5.0
- DSCR +3.5/10.0
- 1% rule +2.5/10.0
- Condition / age +2.5/5.0
- Rent growth +2.4/5.0
- Appreciation +0.0/10.0
$299,990
🖨 Deal sheet (PDF) 📄 Offer letter ✓ Due diligence
Listing remarks MLS
INCREDIBLE SIX BEDROOM NEW D.R. HORTON BUILT 2 STORY IN SILVERTHORNE! Fantastic Floorplan and Design! Extended Foyer Leads to Gourmet Island Kitchen with Tons of Cabinetry & Quartz Countertops! Spacious Living Room & Dining Area! Privately Located Primary Suite on First Floor Offers Lovely Bath with Dual Sinks, Large Shower, & ENORMOUS Walk-In Closet! Generously Sized Secondary Bedrooms! Useful Gameroom Upstairs! Convenient Utility Room! Tons of Incredible Features: LED Can Lighting, Vinyl Plank Wood-Look Flooring, Sprinkler System, Full Sod, Tankless Water Heater, PLUS MORE! Great Community with a Recreation Center, Playground, Pickleball Court, Walking Trails & Pool! Estimated Completion - Spring 2026!
Key facts
- Large shower
- Led can lighting
- 6,769 sq ft lot
Tags
Neighborhood map
What this means for you Summary
Snapshot
- This is a 6-bed/2.5-bath land listed at $300k.
Deal economics
- At list price, monthly cash flow is $-78 ($-936/yr) — negative.
- To cash-flow at today's rent, offer at most $286k (4.6% below list).
- To meet the 1% rule (rent ≥ 1% of price), the offer needs to be $225k (25.1% below list).
- Recommended offer: $225k (25.1% below list) — sets the bar for 1% rule.
- Cap rate 6.0% vs local median 3.1% in Conroe — top-decile yield for the area; either an underpriced asset or a hidden risk that comps aren't pricing in. Stress-test before assuming the spread holds.
Location & tenants
- Location reads 74/100 on livability (#169 in TX, #4,447 nationally) — a middle-class / working-renter tenant base. Strengths: cost of living A+, housing A+, amenities B; Watch: commute F, health & safety F.
- Conroe ISD (other): math 57% / reading 57% proficiency, ranked #69 of 826 in TX (top 8%) — acceptable for families but not a draw, mixed tenant base, ~2y average lease.
- Zoned schools: Patterson El (math 33% / reading 35%, grade F, #2,149 of 4,322 statewide, top 50%, 977 students, 74% FRL); Bozman Int (math 44% / reading 40%, grade D-, #572 of 1,662 statewide, top 36%, 988 students, 68% FRL); Conroe H S (math 32% / reading 51%, grade F, #767 of 1,632 statewide, top 47%, 4,915 students, 61% FRL) — zoned schools average 68% FRL vs 34% district-wide (33 pts higher); higher-poverty schools than district average — tighter screening recommended.
- Zoned-school proficiency averages 39% at this address vs 57% district-wide (-18 pts) — the specific schools serving this property underperform the Conroe ISD average; the district grade overstates school quality for this exact location.
- Market conditions: Rents soft (-0.3%/yr); 721 active listings in the ZIP; 1 comparable units currently listed for rent nearby; solid renter incomes; 13,259 units permitted in Montgomery County in 2024 (1,402 in 5+ unit buildings).
- This rent runs 36% of the median local income ($75k/yr) — at the standard rent-burdened threshold; future hikes will face affordability resistance.
Forward outlook
- Local home prices are declining (-3.0%/yr); year-one equity from $2k of loan paydown is wiped out by about $9k of value loss. Plan a longer hold.
- Montgomery County population projected at +65% by 2050 — long-run rental-demand tailwind backs the buy-and-hold thesis.
Negotiation context
- It's been on market 63 days — a 6% lower offer ($282k) is reasonable based on typical stale-listing flexibility.
Questions for the listing agent
- What do current leases actually rent for vs. the listed asking? Can we see a recent rent roll and the last 12 months of T-12 income?
- It's been on market 63 days. Have you received any prior offers? Is the seller open to a 25% concession, seller financing, or rate buy-down credit?
- What does the HOA fee cover, when was the last increase, and are there any pending special assessments or reserve-fund shortfalls?
- Why hasn't it sold? Are there any deal-killer items the seller is aware of (foundation, flood, title, zoning, code violations)?
- Is there a deadline driving the sale (1031 exchange, divorce, estate, relocation)? That informs how much negotiation room exists.
- Schools are D-rated, which usually means shorter tenancies and higher turnover. Who's the typical renter profile here, and what's been the actual vacancy rate?
- The area grade is low — what's the realistic commute time and amenity access for the typical tenant pool here? Any planned neighborhood developments (good or bad) we should know about?
- What's the average days-on-market for RENTAL listings here right now (not sales)? A rising rental-DOM trend means longer vacancies and softer asking-rent achievability than the comps imply.
- What's the recent tenant-quality profile in this submarket — average credit score on applications, eviction rate, late-payment / NSF rate, and stable-employment percentage? A property-management company in the area should have these aggregated.
- How much new for-sale + rental construction is in the pipeline within 1–3 miles? Heavy new supply typically softens prices + rents 12–24 months out; constrained supply supports both.
Investment metrics
- 1% rule
- 0.75% ✗
- Cap rate
- 5.98%
- Cash-on-cash
- -1.11%
- DSCR
- 0.95
- GRM
- 11.1
CMA / ARV
- ARV (median comp)
- $330,880
- List price
- $299,990
- Delta
- -9.34%
- Verdict
- FAIR
- Comps
- 15 within 1.0 mi
Projected returns pro-forma
-3.0% appreciation · 0.0% rent growth · sell at horizon
- IRR
- -21.2%
- Equity multiple
- 0.28×
- Total profit
- $-60,267
- Equity at exit
- $44,729
- IRR
- -22.6%
- Equity multiple
- -0.01×
- Total profit
- $-84,747
- Equity at exit
- $25,938
Cash invested: $83,997 (down + closing). Projections, not guarantees.
Landlord ↔ Tenant lean methodology
- Overall (STATE)
- 87 Strongly Landlord-Friendly
- State Texas
- 87 Strongly Landlord-Friendly · R+5
- County
- — inherits STATE
- City
- — inherits STATE
ZIP-level market 77303
- Home prices YoY
- -22.4%
- Rents YoY
- -0.3%
- Active inventory
- 721
- Price-to-rent
- 11.1×
Monthly cashflow live
- Estimated rent
- $2,248 medium interval (Pro) →
- Mortgage (P&I)
- −$1,573
- Tax from tax record
- −$68 /mo · $815/yr
- Insurance
- −$125
- HOA
- −$88
- Vacancy / Maint / Mgmt
- −$472
- Net cashflow
- $-78
Break-even live
Sensitivity live
| Price | -10% $92 | -5% $7 | +0% $-78 | +5% $-163 | +10% $-248 |
|---|---|---|---|---|---|
| Rent | -10% $-256 | -5% $-167 | +0% $-78 | +5% $11 | +10% $100 |
| Rate | -1.0pp $73 | -0.5pp $-2 | base $-78 | +0.5pp $-156 | +1.0pp $-235 |
UW: 25.0% down · 7.5% · 30yr · 1.5% tax · 5.0% vac · 8.0% maint · 8.0% mgmt
Financing live
Cash to close
- Down payment
- $74,998
- Closing costs
- $9,000
- Reserves months
- —
- Total cash needed
- —
Loan-product check · same deal, 3 products live
Conventional
25% down · 7.5% · 30yr
- Down + closing
- —
- Monthly P&I
- —
- Monthly cashflow
- —
- DSCR
- —
- Eligible?
- —
Personal DTI + credit; lowest rate.
DSCR
20% down · 8.5% · 30yr
- Down + closing
- —
- Monthly P&I
- —
- Monthly cashflow
- —
- DSCR
- —
- Eligible?
- —
No personal income docs; deal must DSCR.
Hard money
10% down · 12.0% · 12mo
- Down + closing
- —
- Monthly P&I
- —
- Monthly cashflow
- —
- DSCR
- —
- Eligible?
- —
Short-term bridge; refi at stabilization.
Rent comps 1 comps
| Address | Beds | Baths | Sqft | Rent | $/sqft | DOM | Units | Dist |
|---|---|---|---|---|---|---|---|---|
| 10005 Sterling Place Dr Conroe, TX | 5.0 | 2.5 | 2305 | $2,250 | $0.98 | 3d | 1 | 1.43mi |
HOA detail
- Monthly dues
- $88 · $1,056/yr
- Likely covers
- waterpool
Listing history 11 events
-
2026-06-15statusdays on market $299,990 Pending 63 DOM
-
2026-06-13days on market $299,990 Active 62 DOM
-
2026-06-09days on market $299,990 Active 58 DOM
-
2026-06-08days on market $299,990 Active 57 DOM
-
2026-06-07days on market $299,990 Active 56 DOM
-
2026-06-04days on market $299,990 Active 53 DOM
-
2026-06-03days on market $299,990 Active 52 DOM
-
2026-06-02days on market $299,990 Active 51 DOM
-
2026-06-01days on market $299,990 Active 50 DOM
-
2026-05-31days on market $299,990 Active 49 DOM
-
2026-04-12$299,990 Active 731-char remark
Show marketing remark (731 chars)
INCREDIBLE SIX BEDROOM NEW D.R. HORTON BUILT 2 STORY IN SILVERTHORNE! Fantastic Floorplan and Design! Extended Foyer Leads to Gourmet Island Kitchen with Tons of Cabinetry & Quartz Countertops! Spacious Living Room & Dining Area! Privately Located Primary Suite on First Floor Offers Lovely Bath with Dual Sinks, Large Shower, & ENORMOUS Walk-In Closet! Generously Sized Secondary Bedrooms! Useful Gameroom Upstairs! Convenient Utility Room! Tons of Incredible Features: LED Can Lighting, Vinyl Plank Wood-Look Flooring, Sprinkler System, Full Sod, Tankless Water Heater, PLUS MORE! Great Community with a Recreation Center, Playground, Pickleball Court, Walking Trails & Pool! Estimated Completion - Spring 2026!
ⓘ Source: listings_history table (triggers on properties + properties_extension) + one-shot
backfill from property_details.listing_events for pre-trigger history.
Tax reassessment forecast TX · Resets to sale price
- Current annual tax
- $815 · $68/mo
- Projected year-2 tax
- $5,490 · $457/mo
- Expected delta
- +$4,675/yr (+$390/mo · 573.7%)
ⓘ Screening estimate from a state-policy table — verify with the county assessor before closing.
Nearby sold comps map
Loading sold comps map…
Walkable amenities ~0.75 mi
Loading nearby amenities…
Taxation est. · year 1
- Rental income
- $26,979
- − Mortgage interest
- −$16,804
- − Property taxes
- −$815
- − Insurance
- −$1,500
- − Repairs & maintenance
- −$2,158
- − Management
- −$2,158
- − HOA
- −$1,056
- − Depreciation
- −$8,727
- Taxable loss
- −$6,240
- Est. tax savings @ 24.0%
- +$1,498
- After-tax cash flow
- $562/yr
For passive investors: Depreciation is non-cash, so a rental often shows a tax loss while cash-flowing — sheltering income. Rental losses are passive: they offset passive income freely, and up to $25,000/yr can offset ordinary (W-2) income if you actively participate and your MAGI is under $100k (phasing out to $0 by $150k); unused losses carry forward. On sale, claimed depreciation is recaptured at up to 25%, and gains may owe capital-gains tax (a 1031 exchange can defer both). Figures are a year-1 estimate at your 24.0% rate — not tax advice; consult a CPA.
Schools (NCES district)
- District
- Conroe ISD
- NCES district ID
- 4815000
- Math proficiency
- 57% ▼ -6.00%
- Reading proficiency
- 57% ▼ -1.00%
- Median HH income
- $71,541
- Composite
- 50.65/100
- National rank
- #1833
- State rank
- #69 of 826 in TX
Livability — Conroe
- Score
- 74/100
- State rank
- #169
- US rank
- #4447
Category grades
Schools grade is shown separately in the Schools card above.
Census & demographics
- Census place
- Conroe, TX
- County
- Montgomery County · 663,713 people
- Metro
- Houston-The Woodlands-Sugar Land, TX
- Population (ZIP)
- 28,854
- Household income
- $75,348
- Rent vs Own
- Severe rent burden
- 464.0
Population outlook (Montgomery County) Hauer SSP2
- Today (2025)
- 713,896 people
- By 2030
- 805,263 · +12.8%
- By 2040
- 992,708 · +39.1%
- By 2050
- 1,179,590 · +65.2%
- By 2075
- 1,628,084 · +128.1%
- By 2100
- 1,937,880 · +171.5%
Race, ethnicity, and origin ACS 2023
- Neighborhood character
- Diverse neighborhood (Simpson 0.56)
- Race & ethnicity
- White 54% Hispanic / Latino 38% Two or more races 17% Black 4%
- Hispanic origin (detail)
- Mexican 25%
- Common ancestry
- Lithuanian 1% Romanian 1% Slovak 1%
- Foreign-born
- 13% · Canada, Jamaica
- Languages at home
- 69% English-only · Spanish 31%
Political lean MEDSL · Montgomery
- 2024 margin
- Solid R (+45.5) · D 26.8% · R 72.3%
- 2008→2024 swing
- +7.2pp toward D · 2008: -52.7pp · 2024: -45.5pp
- All cycles
- 2024: R+45.5 2020: R+43.8 2016: R+51.4 2012: R+60.7 2008: R+52.7
Not yet ingested
- Civics
- —
Market trends
- HPI YoY
- ▼ -77.71%
- Current HPI
- 269.5367
- Rent YoY
- ▼ -0.31%
- Metro
- Houston-The Woodlands-Sugar Land, TX
- State GDP YoY
- ▲ 3.95%
- F500 in state
- 110
Industry mix (Fortune 500 HQ in TX)
| Industry | F500 HQs | Revenue |
|---|---|---|
| Energy | 16 | $1,198B |
|
||
| Technology | 5 | $198B |
|
||
| Engineering / Construction | 4 | $72B |
|
||
| Energy Services | 3 | $60B |
|
||
| Utilities | 3 | $41B |
|
||
| Healthcare | 2 | $330B |
|
||
Price history
1 event — show timeline
- 2026-04-12 Listed $299,990 HARMLS
Cash-flow waterfall
monthlySold comps — $/sqft
last 12 mo · ≤1 miLoading sold comps…