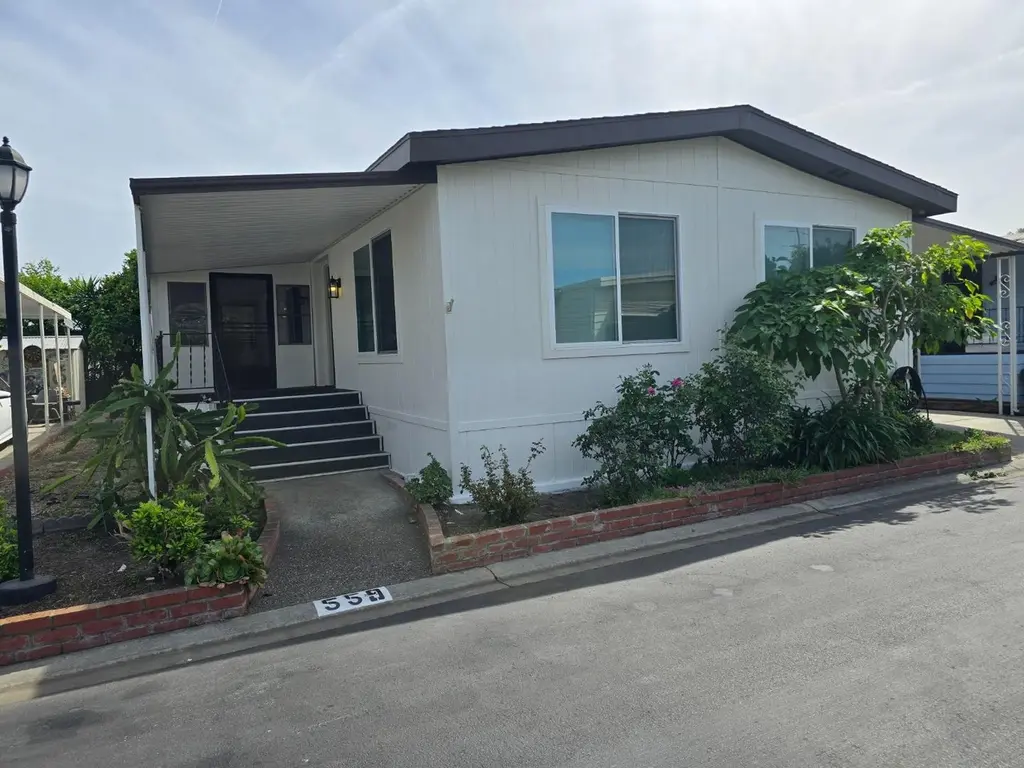
559 Mountain Home Dr #559 · San Jose, CA
Flood risk 8/10 · Major
- FEMA flood zone
- D
- Chance of flooding over 30 yrs
- 0.99%
- Est. flood insurance / yr
- $544 – $1,084
Fire risk 1/10 · Minimal
- Est. fire insurance / yr
- $659 – $1,223
Heat risk 5/10 · Moderate
- Hot days now (above 94°F)
- 7 days/yr
- Hot days in 30 yrs
- 14 days/yr
Wind risk 1/10 · Minimal
- Chance of severe wind over 30 yrs
- —
Air-quality risk 9/10 · Severe
- Unhealthy air days now
- 17 days/yr
- Unhealthy air days in 30 yrs
- 17 days/yr
Risk factors via First Street. Map © Google.
Why this score? — see what drove the D grade
The composite is a weighted blend of 9 inputs, each scored 0–100. Each bar is that input's sub-score; the figure is the points it added to the 100-point composite (weight × sub-score).
- Cash flow +16.0/30.0
- Schools +5.5/10.0
- DSCR +5.0/10.0
- 1% rule +4.4/10.0
- Livability +3.9/5.0
- Rent growth +3.3/5.0
- Condition / age +2.5/5.0
- ARV discount +0.0/15.0
- Appreciation +0.0/10.0
$429,900
🖨 Deal sheet (PDF) 📄 Offer letter ✓ Due diligence
Listing remarks MLS
Low $838 space rent, no property tax, $74 annual registration, and insured as a 1985 home at $811 annually due to the newer upgrades, including; remodeled guest bathroom, copper waterlines, outlets and light switches, energy-efficient LED lighting, Milgard Intrinsic Series low-profile double-pane windows & sliding door, furnace with American Standard A/C, Aprilaire whole house filtration, cellular shades throughout, Bosch stainless steel dishwasher, Samsung stainless steel microwave, washer and dryer (included without warranty), and freshly painted inside & out. Offering approx. 1,440 sq ft of living space, the home also includes a 176 sq ft. enclosed deck area with new carpet, paneling, paint, and window screens, providing flexible bonus space. Two sheds provide additional storage. A drainage system along the left side of the home helps direct water away from the property. The yard offers seasonal oranges and dragon fruit. Close to an abundance of guest & street parking, the clubhouse, pool, spa, and playground area. Located in the desirable Mountain Shadows Mobile Home Park, a family-friendly community near Highways 87 & 85, Almaden Expressway, light rail, bus stop, shopping, restaurants, Lucky Supermarket, and Home Depot. An exceptional value you won't want to miss!
Key facts
- New exterior paint
- Meaningful upgrades
- New interior paint
Tags
Neighborhood map
What this means for you Summary
Snapshot
- This is a 3-bed/2.0-bath manufactured listed at $430k.
Deal economics
- At list price, monthly cash flow is $146 ($2k/yr) — positive.
- The deal already cash-flows at list — no discount required.
- To meet the 1% rule (rent ≥ 1% of price), the offer needs to be $403k (6.2% below list).
- Recommended offer: $403k (6.2% below list) — sets the bar for 1% rule.
- Cap rate 6.9% vs local median 1.6% in San Jose — top-decile yield for the area; either an underpriced asset or a hidden risk that comps aren't pricing in. Stress-test before assuming the spread holds.
Location & tenants
- Location reads 78/100 on livability (#68 in CA, #2,559 nationally) — a middle-class / working-renter tenant base. Strengths: amenities A+, commute A+, employment A+; Watch: crime F, cost of living F.
- East Side Union High (urban): math 53% / reading 70% proficiency, ranked #69 of 517 in CA (top 13%) — acceptable for families but not a draw, mixed tenant base, ~2y average lease.
- Zoned schools: Shirakawa (George Sr.) Elementary (633 students, 49% FRL); Bridges Academy (287 students, 72% FRL); Evergreen Valley High (math 76% / reading 83%, grade A-, #45 of 1,170 statewide, top 4%, 2,767 students, 13% FRL).
- Zoned-school proficiency averages 80% at this address vs 62% district-wide (+18 pts) — the actual schools serving this property are materially stronger than the East Side Union High average implies; a family-tenant draw the district grade alone would hide.
- Market conditions: Rents rising (+3.4%/yr); 89 active listings in the ZIP; 31 comparable units currently listed for rent nearby; rentals leasing fast (median 1d on market — plan ~1-2 weeks tenant-placement turnaround); high-income renter base; 3,838 units permitted in Santa Clara County in 2024 (1,886 in 5+ unit buildings).
Forward outlook
- Local home prices are declining (-3.0%/yr); year-one equity from $3k of loan paydown is wiped out by about $13k of value loss. Plan a longer hold.
- Santa Clara County population projected at +24% by 2050 — long-run rental-demand tailwind backs the buy-and-hold thesis.
Negotiation context
- It's been on market 85 days — a 6% lower offer ($404k) is reasonable based on typical stale-listing flexibility.
- 3 sale attempts since 21y ago; this cycle's ask has dropped $29k (6%) from the opening price — seller is motivated, your offer sets the floor, not the list.
- Current owner paid $90k; list at $430k implies a 378% gain — meaningful room to come down on a strong offer.
Risks & watch-outs
- Watch-outs: flood insurance adds $68/mo.
- Climate carrying-cost: severe flood risk; extreme-heat days projected 7→14/yr by 2055 (HVAC capex compounding) — expect insurance premiums to compound above CPI over the hold.
Questions for the listing agent
- It's been on market 85 days. Have you received any prior offers? Is the seller open to a 6% concession, seller financing, or rate buy-down credit?
- Built in 1973 — when were the roof, HVAC, electrical panel, plumbing, and water heater last replaced?
- What's the actual annual flood-insurance premium (NFIP or private), and is the property in a SFHA with mandatory coverage?
- Why hasn't it sold? Are there any deal-killer items the seller is aware of (foundation, flood, title, zoning, code violations)?
- Is there a deadline driving the sale (1031 exchange, divorce, estate, relocation)? That informs how much negotiation room exists.
- Crime grade is F in this area — have there been break-ins, vandalism, or insurance claims at this property in the last 3 years? What carrier currently insures it and at what premium?
- The area grade is low — what's the realistic commute time and amenity access for the typical tenant pool here? Any planned neighborhood developments (good or bad) we should know about?
- What's the average days-on-market for RENTAL listings here right now (not sales)? A rising rental-DOM trend means longer vacancies and softer asking-rent achievability than the comps imply.
- What's the recent tenant-quality profile in this submarket — average credit score on applications, eviction rate, late-payment / NSF rate, and stable-employment percentage? A property-management company in the area should have these aggregated.
- How much new for-sale + rental construction is in the pipeline within 1–3 miles? Heavy new supply typically softens prices + rents 12–24 months out; constrained supply supports both.
Investment metrics
- 1% rule
- 0.94% ✗
- Cap rate
- 6.89%
- Cash-on-cash
- 2.14%
- DSCR
- 1.10
- GRM
- 8.9
CMA / ARV
- ARV (median comp)
- $357,518
- List price
- $429,900
- Delta
- 20.25%
- Verdict
- OVERPRICED
- Comps
- 20 within 1.0 mi
Show comp detail 12 sales within ~0.75 mi
| Address | Dist | Beds/Ba | Sqft | Sold | Price | $/sf | Match |
|---|---|---|---|---|---|---|---|
| 3300 Narvaez Ave #175 | 0.11mi | 3/2.0 | 1,490 (+4%) | 1mo | $325,000 | $218 | 88 |
| 126 Mountain Springs Dr #126 | 0.15mi | 2/2.0 (-1) | 1,440 (0%) | 2mo | $350,000 | $243 | 86 |
| 120 Mountain Spgs #120 | 0.14mi | 2/2.0 (-1) | 1,440 (0%) | 4mo | $225,000 | $156 | 85 |
| 146 Mountain Springs Dr #146 | 0.18mi | 2/2.0 (-1) | 1,440 (0%) | 6mo | $325,000 | $226 | 82 |
| 242 Mountain Springs Dr #242 | 0.26mi | 3/2.0 | 1,488 (+3%) | 3mo | $444,950 | $299 | 80 |
| 149 Mountain Springs Dr #149 | 0.18mi | 2/2.0 (-1) | 1,440 (0%) | 8mo | $220,000 | $153 | 80 |
| 543 Mountain Home Dr #543 | 0.04mi | 2/2.0 (-1) | 1,536 (+7%) | 7mo | $419,000 | $273 | 76 |
| 547 Mountain Home Dr #68 | 0.07mi | 3/3.0 | 1,560 (+8%) | 8mo | $455,000 | $292 | 72 |
| 236 Mountain Springs Dr #236 | 0.32mi | 3/2.0 | 1,488 (+3%) | 10mo | $450,000 | $302 | 71 |
| 255 Mountain Springs Dr #255 | 0.25mi | 3/2.0 | 1,584 (+10%) | 3mo | $525,000 | $331 | 69 |
| 3300 Narvaez Ave #53 | 0.18mi | 3/2.0 | 1,617 (+12%) | 11mo | $370,000 | $229 | 62 |
| 3637 Snell Ave #12 | 0.74mi | 3/2.0 | 1,440 (0%) | 9mo | $353,000 | $245 | 58 |
Match score weights: distance 35% · size 25% · config 20% · recency 20%. Top-matched comps best support the ARV.
Projected returns pro-forma
-3.0% appreciation · 3.36% rent growth · sell at horizon
- IRR
- -13.5%
- Equity multiple
- 0.51×
- Total profit
- $-58,765
- Equity at exit
- $64,099
- IRR
- -4.0%
- Equity multiple
- 0.73×
- Total profit
- $-32,683
- Equity at exit
- $37,170
Cash invested: $120,372 (down + closing). Projections, not guarantees.
Landlord ↔ Tenant lean methodology
- Overall (CITY)
- 0 Strongly Tenant-Friendly
- State California
- 18 Strongly Tenant-Friendly · D+13
- County
- — inherits STATE
- City San Jose
- 0 Strongly Tenant-Friendly · D+24
ZIP-level market 95136
- Rents YoY
- 3.4%
- Active inventory
- 89
- Price-to-rent
- 8.9×
Monthly cashflow live
- Estimated rent
- $4,032 high interval (Pro) →
- Mortgage (P&I)
- −$2,254
- Tax est. 1.5%
- −$537 /mo · $6,448/yr
- Insurance
- −$179
- Flood insurance flood zone
- −$68 /mo · $814/yr
- HOA
- −$0
- Vacancy / Maint / Mgmt
- −$847
- Net cashflow
- $146
Break-even live
Sensitivity live
| Price | -10% $444 | -5% $295 | +0% $146 | +5% $-2 | +10% $-151 |
|---|---|---|---|---|---|
| Rent | -10% $-172 | -5% $-13 | +0% $146 | +5% $306 | +10% $465 |
| Rate | -1.0pp $363 | -0.5pp $256 | base $146 | +0.5pp $35 | +1.0pp $-78 |
UW: 25.0% down · 7.5% · 30yr · 1.5% tax · 5.0% vac · 8.0% maint · 8.0% mgmt
Financing live
Cash to close
- Down payment
- $107,475
- Closing costs
- $12,897
- Reserves months
- —
- Total cash needed
- —
Loan-product check · same deal, 3 products live
Conventional
25% down · 7.5% · 30yr
- Down + closing
- —
- Monthly P&I
- —
- Monthly cashflow
- —
- DSCR
- —
- Eligible?
- —
Personal DTI + credit; lowest rate.
DSCR
20% down · 8.5% · 30yr
- Down + closing
- —
- Monthly P&I
- —
- Monthly cashflow
- —
- DSCR
- —
- Eligible?
- —
No personal income docs; deal must DSCR.
Hard money
10% down · 12.0% · 12mo
- Down + closing
- —
- Monthly P&I
- —
- Monthly cashflow
- —
- DSCR
- —
- Eligible?
- —
Short-term bridge; refi at stabilization.
Rent comps 31 comps
| Address | Beds | Baths | Sqft | Rent | $/sqft | DOM | Units | Dist |
|---|---|---|---|---|---|---|---|---|
| 3157 Regency Ave #612 San Jose, CA | 2.0 | 2.5 | 1282 | $4,195 | $3.27 | 4d | 1 | 0.33mi |
| 3158 Regency Ave San Jose, CA | 2.0 | 2.5 | 1257 | $3,695 | $2.94 | 0d | 1 | 0.34mi |
| 318 Araglin Ct San Jose, CA | 2.0 | 2.0 | 1168 | $3,300 | $2.83 | 5d | 1 | 0.43mi |
| 3601 Copperfield Dr San Jose, CA | 1.0–3.0 | 1.0–3.0 | 1088 | $4,571 | $4.20 | 0d | 24 | 0.49mi |
| 2988 Grassina St #309 San Jose, CA | 2.0 | 2.0 | 1048 | $3,600 | $3.44 | 4d | 1 | 0.53mi |
| 778 Bend Ave San Jose, CA | 3.0 | 2.0 | 1688 | $4,375 | $2.59 | 46d | 1 | 0.58mi |
| 3200 Rubino Dr San Jose, CA | 1.0–2.0 | 1.0–2.0 | 928 | $3,720 | $4.01 | 0d | 1 | 0.59mi |
| 2070 Mary Helen Ln San Jose, CA | 3.0 | 4.0 | 1781 | $4,495 | $2.52 | 0d | 1 | 0.61mi |
| 2986 Lina St #7 San Jose, CA | 3.0 | 3.0 | 1813 | $5,500 | $3.03 | 18d | 1 | 0.66mi |
| 818 Foxworthy Ave San Jose, CA | 3.0 | 2.5 | 1589 | $4,700 | $2.96 | 19d | 1 | 0.67mi |
| 818 Foxworthy Ave San Jose, CA | 3.0 | 2.5 | 1589 | $4,700 | $2.96 | 22d | 1 | 0.67mi |
| 4162 Wessex Dr Unit Na San Jose, CA | 3.0 | 2.0 | 1200 | $4,250 | $3.54 | 22d | 1 | 0.71mi |
| 3024 Goodacre Pl San Jose, CA | 3.0 | 2.5 | 1431 | $2,200 | $1.54 | 46d | 1 | 0.72mi |
| 3115 Tuscolana Way #1595 San Jose, CA | 3.0 | 2.5 | 1580 | $4,430 | $2.80 | 18d | 1 | 0.77mi |
| 861 Branham Ln Unit 3 San Jose, CA | 2.0 | 1.5 | 1100 | $2,700 | $2.45 | 17d | 1 | 0.93mi |
| 244 Vista Roma Way San Jose, CA | 4.0 | 2.5 | 1800 | $4,400 | $2.44 | 0d | 1 | 0.99mi |
| 4000 Ellmar Oaks Dr San Jose, CA | 1.0–3.0 | 1.0–2.0 | 876 | $4,655 | $5.31 | 0d | 31 | 1.03mi |
| 4647 Powderborn Ct San Jose, CA | 3.0 | 2.5 | 1496 | $3,795 | $2.54 | 46d | 1 | 1.04mi |
| 1277 Babb Ct San Jose, CA | 2.0 | 2.0 | 1123 | $3,550 | $3.16 | 0d | 2 | 1.10mi |
| 45 Esfahan Dr San Jose, CA | 3.0 | 2.5 | 1794 | $4,395 | $2.45 | 0d | 1 | 1.12mi |
| 4778 Eagle Lake Dr San Jose, CA | 3.0 | 2.0 | 1508 | $4,595 | $3.05 | 0d | 1 | 1.15mi |
| 3129 Kenland Dr San Jose, CA | 3.0 | 2.0 | 1094 | $3,450 | $3.15 | 0d | 1 | 1.24mi |
| 287 Kenbrook Cir San Jose, CA | 2.0 | 2.0 | 1012 | $2,795 | $2.76 | 0d | 1 | 1.25mi |
| 334 Olive Hill Dr San Jose, CA | 2.0 | 3.0 | 1368 | $4,150 | $3.03 | 0d | 1 | 1.29mi |
| 1036 Cumberland Pl San Jose, CA | 2.0 | 2.0 | 1264 | $5,375 | $4.25 | 46d | 1 | 1.33mi |
| 262 Azevedo Cir #1603 San Jose, CA | 3.0 | 3.0 | 1620 | $3,720 | $2.30 | 0d | 1 | 1.33mi |
| 2212 Almaden Rd Unit B San Jose, CA | 2.0 | 2.0 | 1200 | $3,195 | $2.66 | 6d | 1 | 1.36mi |
| 200 Lewis Rd San Jose, CA | 1.0–3.0 | 1.0–2.0 | 867 | $2,821 | $3.25 | 0d | 1 | 1.38mi |
| 4300 The Woods Dr San Jose, CA | 3.0 | 1.0–3.5 | 918 | $4,155 | $4.53 | 0d | 1 | 1.41mi |
| 559 Manor Dr Unit NA San Jose, CA | 2.0 | 1.5 | 1200 | $3,300 | $2.75 | 46d | 1 | 1.42mi |
| 5230 Terner Way San Jose, CA | 1.0–2.0 | 1.0–2.0 | 914 | $3,801 | $4.16 | 0d | 5 | 1.49mi |
Listing history 23 events
-
2026-06-22days on market $429,900 Active 85 DOM
-
2026-06-21days on market $429,900 Active 84 DOM
-
2026-06-18days on market $429,900 Active 81 DOM
-
2026-06-17days on market $429,900 Active 80 DOM
-
2026-06-16days on market $429,900 Active 79 DOM
-
2026-06-15days on market $429,900 Active 78 DOM
-
2026-06-13days on market $429,900 Active 76 DOM
-
2026-06-13days on market $429,900 Active 75 DOM
-
2026-06-09days on market $429,900 Active 72 DOM
-
2026-06-08days on market $429,900 Active 71 DOM
-
2026-06-07pricedays on market $429,900 Active 70 DOM
-
2026-06-05days on market $439,000 Active 67 DOM
-
2026-06-03days on market $439,000 Active 66 DOM
-
2026-06-02days on market $439,000 Active 65 DOM
-
2026-06-01days on market $439,000 Active 64 DOM
-
2026-05-31days on market $439,000 Active 63 DOM
-
2026-05-01price $439,000 1313-char remark
Show marketing remark (1313 chars)
Low $838 space rent, no property tax, $74 annual registration, and insured as a 1985 home at $811 annually due to the newer upgrades, including; remodeled guest bathroom, copper waterlines, outlets and light switches, energy-efficient LED lighting, Milgard Intrinsic Series low-profile double-pane windows & sliding door, furnace with American Standard A/C, Aprilaire whole house filtration, cellular shades throughout, Bosch stainless steel dishwasher, Samsung stainless steel microwave, washer and dryer (included without warranty), and freshly painted inside & out. Offering approx. 1,440 sq ft of living space, the home also includes a 176 sq ft. enclosed deck area with new carpet, paneling, paint, and window screens, providing flexible bonus space. Two sheds provide additional storage. A drainage system along the left side of the home helps direct water away from the property. The yard offers seasonal oranges and dragon fruit. Close to an abundance of guest & street parking, the clubhouse, pool, spa, and playground area. Located in the desirable Mountain Shadows Mobile Home Park, a family-friendly community near Highways 87 & 85, Almaden Expressway, light rail, bus stop, shopping, restaurants, Lucky Supermarket, and Home Depot. An exceptional value you won't want to miss!
-
2026-03-29$459,000 Active 1313-char remark
Show marketing remark (1313 chars)
Low $838 space rent, no property tax, $74 annual registration, and insured as a 1985 home at $811 annually due to the newer upgrades, including; remodeled guest bathroom, copper waterlines, outlets and light switches, energy-efficient LED lighting, Milgard Intrinsic Series low-profile double-pane windows & sliding door, furnace with American Standard A/C, Aprilaire whole house filtration, cellular shades throughout, Bosch stainless steel dishwasher, Samsung stainless steel microwave, washer and dryer (included without warranty), and freshly painted inside & out. Offering approx. 1,440 sq ft of living space, the home also includes a 176 sq ft. enclosed deck area with new carpet, paneling, paint, and window screens, providing flexible bonus space. Two sheds provide additional storage. A drainage system along the left side of the home helps direct water away from the property. The yard offers seasonal oranges and dragon fruit. Close to an abundance of guest & street parking, the clubhouse, pool, spa, and playground area. Located in the desirable Mountain Shadows Mobile Home Park, a family-friendly community near Highways 87 & 85, Almaden Expressway, light rail, bus stop, shopping, restaurants, Lucky Supermarket, and Home Depot. An exceptional value you won't want to miss!
-
2005-11-23historical 238-char remark
Show marketing remark (238 chars)
1440 Sq. Ft. on Lg. Screened rm 8x30 + lg. porch. Fruit trees, back yard, 2 sheds Walk-thru Kit. w/ pantry. Sep. family rm. liv/din combo. Great open floor plan Lg. mas. b/r, Priced to sell, Very low rent $446. per mo. 2nd b/r good size
-
2005-11-16soldstatus $90,000 238-char remark
Show marketing remark (238 chars)
1440 Sq. Ft. on Lg. Screened rm 8x30 + lg. porch. Fruit trees, back yard, 2 sheds Walk-thru Kit. w/ pantry. Sep. family rm. liv/din combo. Great open floor plan Lg. mas. b/r, Priced to sell, Very low rent $446. per mo. 2nd b/r good size
-
2005-08-22$94,900 238-char remark
Show marketing remark (238 chars)
1440 Sq. Ft. on Lg. Screened rm 8x30 + lg. porch. Fruit trees, back yard, 2 sheds Walk-thru Kit. w/ pantry. Sep. family rm. liv/din combo. Great open floor plan Lg. mas. b/r, Priced to sell, Very low rent $446. per mo. 2nd b/r good size
ⓘ Source: listings_history table (triggers on properties + properties_extension) + one-shot
backfill from property_details.listing_events for pre-trigger history.
Climate risk First Street
- Flood 8/10 Severe FEMA zone D · 99% chance over 30 yrs
- Wildfire 1/10 Low
- Heat 5/10 Major 7 d/yr ≥94°F today · 14 d/yr by 30 yrs out
- Wind 1/10 Low
- Air quality 9/10 Extreme 17 unhealthy d/yr today · 17 by 30 yrs out
Nearby sold comps map
Loading sold comps map…
Walkable amenities ~0.75 mi
Loading nearby amenities…
Taxation est. · year 1
- Rental income
- $48,384
- − Mortgage interest
- −$24,081
- − Property taxes
- −$6,448
- − Insurance
- −$2,964
- − Repairs & maintenance
- −$3,871
- − Management
- −$3,871
- − Depreciation
- −$12,506
- Taxable loss
- −$5,357
- Est. tax savings @ 24.0%
- +$1,286
- After-tax cash flow
- $3,043/yr
For passive investors: Depreciation is non-cash, so a rental often shows a tax loss while cash-flowing — sheltering income. Rental losses are passive: they offset passive income freely, and up to $25,000/yr can offset ordinary (W-2) income if you actively participate and your MAGI is under $100k (phasing out to $0 by $150k); unused losses carry forward. On sale, claimed depreciation is recaptured at up to 25%, and gains may owe capital-gains tax (a 1031 exchange can defer both). Figures are a year-1 estimate at your 24.0% rate — not tax advice; consult a CPA.
Schools (NCES district)
- District
- East Side Union High
- NCES district ID
- 0611820
- Math proficiency
- 53% ▲ 12.00%
- Reading proficiency
- 70% ▲ 8.00%
- Median HH income
- $80,293
- Composite
- 55.15/100
- National rank
- #1278
- State rank
- #69 of 517 in CA
Livability — San Jose
- Score
- 78/100
- State rank
- #68
- US rank
- #2559
Category grades
Schools grade is shown separately in the Schools card above.
Census & demographics
- Census place
- San Jose, CA
- County
- Santa Clara County · 1,806,974 people
- City population
- 954,479
- Metro
- San Jose-Sunnyvale-Santa Clara, CA
- Population (ZIP)
- 48,056
- Household income
- $142,433
- Rent vs Own
- Severe rent burden
- 1653.0
Population outlook (Santa Clara County) Hauer SSP2
- Today (2025)
- 2,179,074 people
- By 2030
- 2,301,297 · +5.6%
- By 2040
- 2,528,195 · +16.0%
- By 2050
- 2,712,135 · +24.5%
- By 2075
- 2,998,701 · +37.6%
- By 2100
- 2,931,429 · +34.5%
Race, ethnicity, and origin ACS 2023
- Neighborhood character
- Highly diverse neighborhood (Simpson 0.72)
- Race & ethnicity
- Asian 36% White 29% Hispanic / Latino 26% Two or more races 15% Black 4%
- Hispanic origin (detail)
- Mexican 20%
- Common ancestry
- Scotch-Irish 1% Lithuanian 1% Russian 1%
- Foreign-born
- 38% · Vietnam, Canada, China
- Languages at home
- 47% English-only · Spanish 16% Vietnamese 12% Other Indo-European 7%
Political lean MEDSL · Santa Clara
- 2024 margin
- Solid D (+40.0) · D 68.1% · R 28.1% · Other 3.8%
- 2008→2024 swing
- -0.9pp no change · 2008: 40.9pp · 2024: 40.0pp
- All cycles
- 2024: D+40.0 2020: D+47.4 2016: D+52.5 2012: D+42.1 2008: D+40.9
Not yet ingested
- Civics
- —
Market trends
- HPI YoY
- ▼ -1427.80%
- Current HPI
- 336.6634
- Rent YoY
- ▲ 3.36%
- Metro
- San Jose-Sunnyvale-Santa Clara, CA
- State GDP YoY
- ▲ 3.21%
- F500 in state
- 116
Industry mix (Fortune 500 HQ in CA)
| Industry | F500 HQs | Revenue |
|---|---|---|
| Technology | 27 | $1,492B |
|
||
| Financial Services | 3 | $174B |
|
||
| Retail | 3 | $44B |
|
||
| Insurance | 3 | $26B |
|
||
| Media / Entertainment | 2 | $115B |
|
||
| Pharmaceuticals / Biotech | 2 | $62B |
|
||
Price history
+362.6% since first listed7 events — show timeline
- 2026-05-01 Price Changed $439,000 bridgeMLS, Bay East AOR, or Contra Costa AOR
- 2026-05-01 Price Changed $439,000 MLSListings
- 2026-03-29 Listed $459,000 MLSListings
- 2026-03-29 Listed $459,000 bridgeMLS, Bay East AOR, or Contra Costa AOR
- 2005-11-23 Listing Removed — MLSListings
- 2005-11-16 Sold (MLS) $90,000 MLSListings
- 2005-08-22 Listed $94,900 MLSListings
Cash-flow waterfall
monthlySold comps — $/sqft
last 12 mo · ≤1 miLoading sold comps…