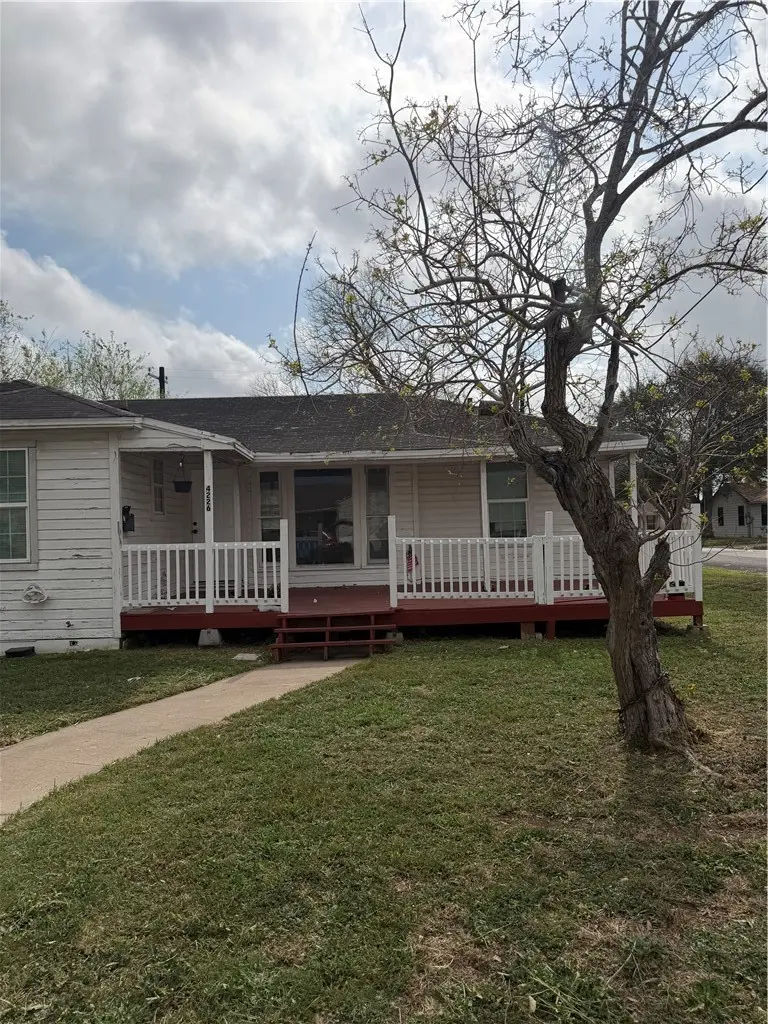
4226 Christie St · Corpus Christi, TX
Flood risk 4/10 · Minor
- FEMA flood zone
- X (unshaded)
- Chance of flooding over 30 yrs
- 0.22%
- Est. flood insurance / yr
- $507 – $1,088
Fire risk 1/10 · Minimal
- Est. fire insurance / yr
- $1,222 – $2,270
Heat risk 10/10 · Severe
- Hot days now (above 107°F)
- 7 days/yr
- Hot days in 30 yrs
- 26 days/yr
Wind risk 9/10 · Severe
- Chance of severe wind over 30 yrs
- 99.0%
Air-quality risk 1/10 · Minimal
- Unhealthy air days now
- 0 days/yr
- Unhealthy air days in 30 yrs
- 0 days/yr
Risk factors via First Street. Map © Google.
Why this score? — see what drove the B- grade
The composite is a weighted blend of 9 inputs, each scored 0–100. Each bar is that input's sub-score; the figure is the points it added to the 100-point composite (weight × sub-score).
- Cash flow +25.7/30.0
- ARV discount +15.0/15.0
- DSCR +8.5/10.0
- 1% rule +7.6/10.0
- Livability +3.9/5.0
- Rent growth +3.1/5.0
- Schools +2.8/10.0
- Condition / age +2.5/5.0
- Appreciation +0.0/10.0
$135,000
🖨 Deal sheet 📄 Offer letter ✓ Due diligence
Listing remarks
Investor Opportunity in Cuiper Subdivision with a Spacious Backyard! This 3-bedroom, 2-bath home in the desirable Cuiper subdivision offers incredible potential in an upper market area. Featuring a functional layout and solid bones, this property is ideal for investors or buyers ready to add their personal touch. Step outside and you’ll find a large backyard—perfect for entertaining, adding a patio, creating an outdoor oasis, or even future expansion. Opportunities like this with generous outdoor space are hard to come by. Whether you’re looking to flip, rent, or customize your next home, this property is full of possibilities and upside potential. Bring your vision and
Key facts
- Spacious backyard
- 7,714 sq ft lot
- Parking
Tags
Neighborhood map
What this means for you Summary
Snapshot
- This is a 3-bed/2.0-bath single-family listed at $135k.
Deal economics
- At list price, monthly cash flow is $322 ($4k/yr) — positive.
- The deal already cash-flows at list — no discount required.
- Meets the 1% rule at list price ($2k rent vs $135k).
- Cap rate 9.2% vs local median 3.6% in Corpus Christi — top-decile yield for the area; either an underpriced asset or a hidden risk that comps aren't pricing in. Stress-test before assuming the spread holds.
Location & tenants
- Location reads 78/100 on livability (#66 in TX, #2,404 nationally) — a middle-class / working-renter tenant base. Strengths: commute A+, cost of living A+, housing A+; Watch: crime F.
- Corpus Christi ISD (urban): math 31% / reading 35% proficiency, ranked #562 of 826 in TX (top 68%) — families likely to look elsewhere, expect single-tenant / working-renter base with shorter leases; 63% free/reduced lunch — lower-income household profile, screen leases tightly.
- Market conditions: Rents rising (+2.3%/yr); 417 active listings in the ZIP; 16 comparable units currently listed for rent nearby; rentals lingering (median 44d on market — plan ~5-8 weeks vacancy on turnover, expect pricing pressure); 50% of comp listings sitting > 30 days — soft ceiling on asking rent; 1,397 units permitted in Nueces County in 2024 (47 in 5+ unit buildings).
- This rent runs 37% of the median local income ($55k/yr) — at the standard rent-burdened threshold; future hikes will face affordability resistance.
Forward outlook
- Local home prices are declining (-3.0%/yr); year-one equity from $933 of loan paydown is wiped out by about $4k of value loss. Plan a longer hold.
- Nueces County population projected at +36% by 2050 — long-run rental-demand tailwind backs the buy-and-hold thesis.
Negotiation context
- Only 4 days on market — expect competitive offers; lowballing is unlikely to land.
- 3 sale attempts since 12y ago with the ask held roughly flat each time — persistent listings suggest the price (not the market) is what's stuck; bring a comps-based counter.
- Current owner paid $28k; list at $135k implies a 382% gain — meaningful room to come down on a strong offer.
Risks & watch-outs
- Watch-outs: built in 1947 — expect roof / HVAC / electrical / plumbing capex.
- Climate carrying-cost: severe wind risk, 99% chance of damaging wind over 30y; extreme-heat days projected 7→26/yr by 2055 (HVAC capex compounding) — expect insurance premiums to compound above CPI over the hold.
Questions for the listing agent
- Built in 1947 — when were the roof, HVAC, electrical panel, plumbing, and water heater last replaced?
- Is there a deadline driving the sale (1031 exchange, divorce, estate, relocation)? That informs how much negotiation room exists.
- Crime grade is F in this area — have there been break-ins, vandalism, or insurance claims at this property in the last 3 years? What carrier currently insures it and at what premium?
- What's the average days-on-market for RENTAL listings here right now (not sales)? A rising rental-DOM trend means longer vacancies and softer asking-rent achievability than the comps imply.
- What's the recent tenant-quality profile in this submarket — average credit score on applications, eviction rate, late-payment / NSF rate, and stable-employment percentage? A property-management company in the area should have these aggregated.
- How much new for-sale + rental construction is in the pipeline within 1–3 miles? Heavy new supply typically softens prices + rents 12–24 months out; constrained supply supports both.
Investment metrics
- 1% rule
- 1.26% ✓
- Cap rate
- 9.15%
- Cash-on-cash
- 10.22%
- DSCR
- 1.45
- GRM
- 6.6
CMA / ARV
- ARV (on-the-fly)
- $178,314
- Comps found
- 12
Show comp detail 12 sales within ~0.75 mi
| Address | Dist | Beds/Ba | Sqft | Sold | Price | $/sf | Match |
|---|---|---|---|---|---|---|---|
| 4305 Devon Dr | 0.26mi | 3/2.0 | 1,456 (-8%) | 7mo | $139,900 | $96 | 69 |
| 1553 Melbourne Dr | 0.54mi | 3/2.5 | 1,586 (+0%) | 12mo | $247,500 | $156 | 62 |
| 2521 Viola | 0.40mi | 3/2.0 | 1,452 (-8%) | 7mo | $223,000 | $154 | 62 |
| 1550 Melbourne Dr | 0.57mi | 3/2.0 | 1,516 (-4%) | 6mo | $229,000 | $151 | 62 |
| 4343 & 4345 Kilgore St | 0.27mi | 4/2.0 (+1) | 1,650 (+5%) | 16mo | $179,900 | $109 | 61 |
| 4426 Green Grove Dr | 0.42mi | 3/2.0 | 1,512 (-4%) | 16mo | $130,000 | $86 | 60 |
| 1650 Green Grove Dr | 0.42mi | 3/2.0 | 1,418 (-10%) | 4mo | $99,950 | $70 | 60 |
| 4026 W Vanderbilt Dr | 0.30mi | 4/3.0 (+1) | 1,412 (-10%) | 3mo | $159,900 | $113 | 57 |
| 2905 Houston St | 0.37mi | 4/3.0 (+1) | 1,788 (+13%) | 2mo | $269,900 | $151 | 50 |
| 1509 Devon Dr | 0.60mi | 4/2.0 (+1) | 1,754 (+11%) | 2mo | $89,500 | $51 | 46 |
| 4338 Cottage St | 0.64mi | 3/1.5 | 1,428 (-10%) | 8mo | $194,999 | $137 | 46 |
| 4642 Brookdale Dr | 0.58mi | 4/3.0 (+1) | 1,669 (+6%) | 18mo | $175,000 | $105 | 39 |
Match score weights: distance 35% · size 25% · config 20% · recency 20%. Top-matched comps best support the ARV.
Projected returns pro-forma
-3.0% appreciation · 2.32% rent growth · sell at horizon
- IRR
- -1.7%
- Equity multiple
- 0.94×
- Total profit
- $-2,453
- Equity at exit
- $20,129
- IRR
- 7.2%
- Equity multiple
- 1.53×
- Total profit
- $19,906
- Equity at exit
- $11,672
Cash invested: $37,800 (down + closing). Projections, not guarantees.
Landlord ↔ Tenant lean methodology
- Overall (STATE)
- 87 Strongly Landlord-Friendly
- State Texas
- 87 Strongly Landlord-Friendly · R+5
- County
- — inherits STATE
- City
- — inherits STATE
ZIP-level market 78415
- Rents YoY
- 2.3%
- Active inventory
- 417
- Price-to-rent
- 6.6×
Monthly cashflow live
- Estimated rent
- $1,700 high interval (Pro) →
- Mortgage (P&I)
- −$708
- Tax from tax record
- −$257 /mo · $3,086/yr
- Insurance
- −$56
- HOA
- −$0
- Vacancy / Maint / Mgmt
- −$357
- Net cashflow
- $322
Break-even live
UW: 25.0% down · 7.5% · 30yr · 1.5% tax · 5.0% vac · 8.0% maint · 8.0% mgmt
Financing live
Cash to close
- Down payment
- $33,750
- Closing costs
- $4,050
- Reserves months
- —
- Total cash needed
- —
Loan-product check · same deal, 3 products live
Conventional
25% down · 7.5% · 30yr
- Down + closing
- —
- Monthly P&I
- —
- Monthly cashflow
- —
- DSCR
- —
- Eligible?
- —
Personal DTI + credit; lowest rate.
DSCR
20% down · 8.5% · 30yr
- Down + closing
- —
- Monthly P&I
- —
- Monthly cashflow
- —
- DSCR
- —
- Eligible?
- —
No personal income docs; deal must DSCR.
Hard money
10% down · 12.0% · 12mo
- Down + closing
- —
- Monthly P&I
- —
- Monthly cashflow
- —
- DSCR
- —
- Eligible?
- —
Short-term bridge; refi at stabilization.
Rent comps 16 comps
| Address | Beds | Baths | Sqft | Rent | $/sqft | DOM | Units | Dist |
|---|---|---|---|---|---|---|---|---|
| 4241 Green Grove Dr Corpus Christi, TX | 3.0 | 2.0 | 1345 | $1,700 | $1.26 | 43d | 1 | 0.31mi |
| 4005 Green Grove Dr Corpus Christi, TX | 3.0 | 2.0 | 1406 | $1,695 | $1.21 | 43d | 1 | 0.37mi |
| 1522 Cambridge Dr Corpus Christi, TX | 3.0 | 1.5 | 1278 | $1,600 | $1.25 | 43d | 1 | 0.56mi |
| 1446 Annapolis Dr Corpus Christi, TX | 3.0 | 2.0 | 1500 | $1,700 | $1.13 | 43d | 1 | 0.63mi |
| 2041 Harvard St Corpus Christi, TX | 3.0 | 2.0 | 1230 | $1,400 | $1.14 | 13d | 1 | 0.67mi |
| 225 Watson St Corpus Christi, TX | 3.0 | 1.0 | 1472 | $1,295 | $0.88 | 43d | 1 | 0.73mi |
| 1405 Annapolis Dr Corpus Christi, TX | 3.0 | 1.5 | 1502 | $2,000 | $1.33 | 13d | 1 | 0.73mi |
| 4818 Kendall Dr Corpus Christi, TX | 2.0 | 1.0 | 1169 | $1,250 | $1.07 | 13d | 1 | 0.79mi |
| 4322 Kostoryz Rd Corpus Christi, TX | 2.0 | 1.5 | 1100 | $1,259 | $1.14 | 43d | 1 | 0.81mi |
| 1837 Horne Rd Corpus Christi, TX | 3.0 | 2.0 | 1226 | $1,800 | $1.47 | 43d | 1 | 0.93mi |
| 1410 Ray Dr Corpus Christi, TX | 3.0 | 1.0 | 1224 | $1,600 | $1.31 | 13d | 1 | 1.05mi |
| 3314 Casa de Palmas Dr Corpus Christi, TX | 3.0 | 2.0 | 1869 | $2,300 | $1.23 | 13d | 1 | 1.11mi |
| 2901 S Staples St Unit B Corpus Christi, TX | 2.0 | 1.0 | 2236 | $900 | $0.40 | 43d | 1 | 1.16mi |
| 2709 Milo St Corpus Christi, TX | 3.0 | 2.0 | 1122 | $1,700 | $1.52 | 13d | 1 | 1.25mi |
| 1722 Trenton Dr Corpus Christi, TX | 4.0 | 2.0 | 1432 | $2,100 | $1.47 | 13d | 1 | 1.34mi |
| 1618 Birch Pl Corpus Christi, TX | 3.0 | 1.0 | 1558 | $1,500 | $0.96 | 13d | 1 | 1.36mi |
Listing history 6 events
-
2026-04-18status Pending
-
2026-04-13$135,000 Active
-
2025-09-19historical $1,450
-
2025-08-06$1,450
-
2014-11-22$60,000
-
2001-11-12soldstatus $28,000
ⓘ Source: listings_history table (triggers on properties + properties_extension) + one-shot
backfill from property_details.listing_events for pre-trigger history.
Tax reassessment forecast TX · Resets to sale price
- Current annual tax
- $3,086 · $257/mo
- Projected year-2 tax
- $3,086 · $257/mo
- Expected delta
- $0/yr ($0/mo · 0.0%)
ⓘ Screening estimate from a state-policy table — verify with the county assessor before closing.
Climate risk First Street
- Flood 4/10 Moderate FEMA zone X (unshaded) · 22% chance over 30 yrs
- Wildfire 1/10 Low
- Heat 10/10 Extreme 7 d/yr ≥107°F today · 26 d/yr by 30 yrs out
- Wind 9/10 Extreme 99% chance of damaging wind over 30 yrs
- Air quality 1/10 Low 0 unhealthy d/yr today · 0 by 30 yrs out
Nearby sold comps map
Loading sold comps map…
Walkable amenities ~0.75 mi
Loading nearby amenities…
Taxation est. · year 1
- Rental income
- $20,403
- − Mortgage interest
- −$7,562
- − Property taxes
- −$3,086
- − Insurance
- −$675
- − Repairs & maintenance
- −$1,632
- − Management
- −$1,632
- − Depreciation
- −$3,927
- Taxable income
- $1,888
- Est. tax owed @ 24.0%
- −$453
- After-tax cash flow
- $3,409/yr
For passive investors: Depreciation is non-cash, so a rental often shows a tax loss while cash-flowing — sheltering income. Rental losses are passive: they offset passive income freely, and up to $25,000/yr can offset ordinary (W-2) income if you actively participate and your MAGI is under $100k (phasing out to $0 by $150k); unused losses carry forward. On sale, claimed depreciation is recaptured at up to 25%, and gains may owe capital-gains tax (a 1031 exchange can defer both). Figures are a year-1 estimate at your 24.0% rate — not tax advice; consult a CPA.
Schools (NCES district)
- District
- Corpus Christi ISD
- NCES district ID
- 4815270
- Math proficiency
- 31% ▼ -18.00%
- Reading proficiency
- 35% ▼ -7.00%
- Median HH income
- $45,672
- Composite
- 28.27/100
- National rank
- #6793
- State rank
- #562 of 826 in TX
Livability — Corpus Christi
- Score
- 78/100
- State rank
- #66
- US rank
- #2404
Category grades
Schools grade is shown separately in the Schools card above.
Census & demographics
- Census place
- Corpus Christi, TX
- County
- Nueces County · 296,836 people
- City population
- 296,836
- Metro
- Corpus Christi, TX
- Population (ZIP)
- 43,080
- Household income
- $54,990
- Rent vs Own
- Severe rent burden
- 1730.0
Population outlook (Nueces County) Hauer SSP2
- Today (2025)
- 418,037 people
- By 2030
- 447,123 · +7.0%
- By 2040
- 505,911 · +21.0%
- By 2050
- 567,522 · +35.8%
- By 2075
- 729,686 · +74.6%
- By 2100
- 847,087 · +102.6%
Race, ethnicity, and origin ACS 2023
- Neighborhood character
- Predominantly Hispanic (83%)
- Race & ethnicity
- Hispanic / Latino 83% Two or more races 41% White 12% Black 3%
- Hispanic origin (detail)
- Mexican 75%
- Foreign-born
- 9% · Canada
- Languages at home
- 59% English-only · Spanish 40%
Political lean MEDSL · Nueces
- 2024 margin
- R (+11.5) · D 43.8% · R 55.3%
- 2008→2024 swing
- -7.1pp toward R · 2008: -4.4pp · 2024: -11.5pp
- All cycles
- 2024: R+11.5 2020: R+2.9 2016: R+1.5 2012: R+3.2 2008: R+4.4
Not yet ingested
- Civics
- —
Market trends
- HPI YoY
- ▼ -173.20%
- Current HPI
- 158.011
- Rent YoY
- ▲ 2.32%
- Metro
- Corpus Christi, TX
- State GDP YoY
- ▲ 3.95%
- F500 in state
- 110
Industry mix (Fortune 500 HQ in TX)
| Industry | F500 HQs | Revenue |
|---|---|---|
| Energy | 16 | $1,198B |
|
||
| Technology | 5 | $198B |
|
||
| Engineering / Construction | 4 | $72B |
|
||
| Energy Services | 3 | $60B |
|
||
| Utilities | 3 | $41B |
|
||
| Healthcare | 2 | $330B |
|
||
Price history
+382.1% since first listed6 events — show timeline
- 2026-04-18 Pending — CBMLS
- 2026-04-13 Listed $135,000 CBMLS
- 2025-09-19 Rental Removed $1,450 BUILDIUM
- 2025-08-06 Listed for Rent $1,450 BUILDIUM
- 2014-11-22 Listed $60,000 CBMLS
- 2001-11-12 Sold (Public Records) $28,000 Public Records
Property tax history
+5.3%/yrLatest (2025): $3,086 · +10.0% YoY. Source: county tax records.
Cash-flow waterfall
monthlySold comps — $/sqft
last 12 mo · ≤1 miLoading sold comps…