294 Parsons · Kyle, TX
Flood risk 1/10 · Minimal
- FEMA flood zone
- X (unshaded)
- Chance of flooding over 30 yrs
- 0.0%
- Est. flood insurance / yr
- $507 – $1,088
Fire risk 4/10 · Minor
- Est. fire insurance / yr
- $1,222 – $2,270
Heat risk 8/10 · Major
- Hot days now (above 108°F)
- 6 days/yr
- Hot days in 30 yrs
- 19 days/yr
Wind risk 8/10 · Major
- Chance of severe wind over 30 yrs
- 80.0%
Air-quality risk 2/10 · Minimal
- Unhealthy air days now
- 0 days/yr
- Unhealthy air days in 30 yrs
- 1 days/yr
Risk factors via First Street. Map © Google.
Why this score? — see what drove the D grade
The composite is a weighted blend of 9 inputs, each scored 0–100. Each bar is that input's sub-score; the figure is the points it added to the 100-point composite (weight × sub-score).
- Cash flow +11.4/30.0
- ARV discount +9.0/15.0
- Livability +3.8/5.0
- Condition / age +3.8/5.0
- 1% rule +3.6/10.0
- Schools +3.5/10.0
- DSCR +3.3/10.0
- Rent growth +2.4/5.0
- Appreciation +0.0/10.0
$239,999
🖨 Deal sheet 📄 Offer letter ✓ Due diligence
Listing remarks
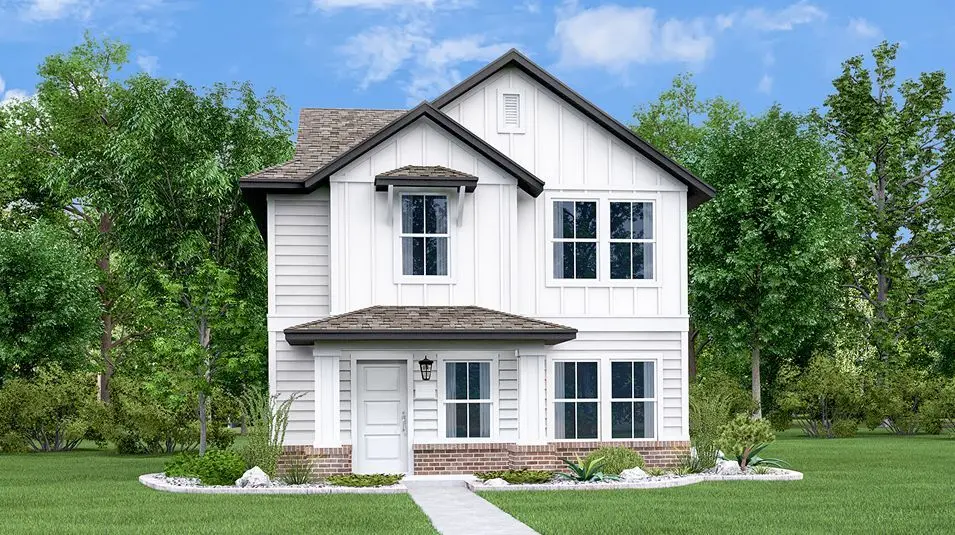
The Ridgeland - This two-story home is host to a spacious open floorplan shared between the family room, dining room and kitchen on the first level, while the second floor is occupied by three bedrooms – including the luxurious owner’s suite featuring a private bathroom. Photos are for illustrative purposes only. Estimated Completion September 2026. The completion date, prices and features may vary and are subject to change. Please verify with Lennar directly.
Key facts
- 3,815 sq ft lot
- Community pool
- Built 2026
Property features AI
Finance
- Financial info: List price $241,999
Exterior
- Home design: Single-family new construction, Ridgeland plan; Spec home
- Exterior features: Located at 294 Parsons, Kyle, TX 78640
Interior
- Bedrooms: 3 bedrooms
- Bathrooms: 2 full bathrooms and 1 half bathroom (2.5 total)
- Interior features: New construction Spec home (Ridgeland plan); Open living area of 1427
Neighborhood map
What this means for you Summary
Snapshot
- This is a 3-bed/2.5-bath single-family listed at $240k. Condition is rated good.
Deal economics
- At list price, monthly cash flow is $-85 ($-1k/yr) — negative.
- To cash-flow at today's rent, offer at most $228k (5.1% below list).
- To meet the 1% rule (rent ≥ 1% of price), the offer needs to be $207k (13.6% below list).
- Recommended offer: $207k (13.6% below list) — sets the bar for 1% rule.
- Cap rate 5.9% vs local median 3.3% in Kyle — top-decile yield for the area; either an underpriced asset or a hidden risk that comps aren't pricing in. Stress-test before assuming the spread holds.
Location & tenants
- Location reads 75/100 on livability (#138 in TX, #3,993 nationally) — a middle-class / working-renter tenant base. Strengths: housing A+, health & safety A+, employment A; Watch: schools D, amenities F, commute F.
- Hays CISD (rural): math 35% / reading 41% proficiency, ranked #390 of 826 in TX (top 47%) — families likely to look elsewhere, expect single-tenant / working-renter base with shorter leases.
- Market conditions: Rents soft (-0.3%/yr); 1801 active listings in the ZIP; 17 comparable units currently listed for rent nearby; rentals leasing fast (median 4d on market — plan ~1-2 weeks tenant-placement turnaround); solid renter incomes; 5,270 units permitted in Hays County in 2024 (1,464 in 5+ unit buildings).
Forward outlook
- Local home prices are declining (-3.0%/yr); year-one equity from $2k of loan paydown is wiped out by about $7k of value loss. Plan a longer hold.
- Hays County population projected at +93% by 2050 — long-run rental-demand tailwind backs the buy-and-hold thesis.
Negotiation context
- Only 8 days on market — expect competitive offers; lowballing is unlikely to land.
Risks & watch-outs
- Climate carrying-cost: severe wind risk, 80% chance of damaging wind over 30y; extreme-heat days projected 6→19/yr by 2055 (HVAC capex compounding) — expect insurance premiums to compound above CPI over the hold.
Questions for the listing agent
- What do current leases actually rent for vs. the listed asking? Can we see a recent rent roll and the last 12 months of T-12 income?
- What does the HOA fee cover, when was the last increase, and are there any pending special assessments or reserve-fund shortfalls?
- Is there a deadline driving the sale (1031 exchange, divorce, estate, relocation)? That informs how much negotiation room exists.
- Schools are D-rated, which usually means shorter tenancies and higher turnover. Who's the typical renter profile here, and what's been the actual vacancy rate?
- The area grade is low — what's the realistic commute time and amenity access for the typical tenant pool here? Any planned neighborhood developments (good or bad) we should know about?
- What's the average days-on-market for RENTAL listings here right now (not sales)? A rising rental-DOM trend means longer vacancies and softer asking-rent achievability than the comps imply.
- What's the recent tenant-quality profile in this submarket — average credit score on applications, eviction rate, late-payment / NSF rate, and stable-employment percentage? A property-management company in the area should have these aggregated.
- How much new for-sale + rental construction is in the pipeline within 1–3 miles? Heavy new supply typically softens prices + rents 12–24 months out; constrained supply supports both.
Investment metrics
- 1% rule
- 0.86% ✗
- Cap rate
- 5.87%
- Cash-on-cash
- -1.51%
- DSCR
- 0.93
- GRM
- 9.6
CMA / ARV
- ARV (on-the-fly)
- $248,298
- Comps found
- 12
Show comp detail 12 sales within ~0.75 mi
| Address | Dist | Beds/Ba | Sqft | Sold | Price | $/sf | Match |
|---|---|---|---|---|---|---|---|
| 136 Parsons | 0.06mi | 3/2.5 | 1,427 (0%) | 1mo | $239,999 | $168 | 97 |
| 108 Parsons | 0.08mi | 3/2.5 | 1,427 (0%) | 2mo | $248,990 | $174 | 95 |
| 173 Bugbee | 0.14mi | 3/2.5 | 1,427 (0%) | 2mo | $244,990 | $172 | 92 |
| 141 Bugbee | 0.17mi | 3/2.0 | 1,450 (+2%) | 2mo | $243,990 | $168 | 86 |
| 3290 Everett St | 0.22mi | 3/2.0 | 1,410 (-1%) | 3mo | $305,990 | $217 | 83 |
| 3345 Everett St | 0.23mi | 3/2.0 | 1,410 (-1%) | 3mo | $304,990 | $216 | 83 |
| 231 Bugbee | 0.11mi | 4/2.5 (+1) | 1,602 (+12%) | 3mo | $259,990 | $162 | 67 |
| 149 Bugbee | 0.16mi | 4/2.5 (+1) | 1,602 (+12%) | 2mo | $261,990 | $164 | 66 |
| 189 Bugbee | 0.13mi | 3/2.0 | 1,230 (-14%) | 4mo | $229,990 | $187 | 66 |
| 125 Bugbee | 0.18mi | 3/2.0 | 1,230 (-14%) | 3mo | $230,990 | $188 | 64 |
| 415 Keefer | 0.19mi | 2/1.5 (-1) | 1,228 (-14%) | 1mo | $205,990 | $168 | 58 |
| 190 Dreyer | 0.32mi | 3/2.0 | 1,622 (+14%) | 4mo | $316,990 | $195 | 57 |
Match score weights: distance 35% · size 25% · config 20% · recency 20%. Top-matched comps best support the ARV.
Projected returns pro-forma
-3.0% appreciation · 0.0% rent growth · sell at horizon
- IRR
- -22.3%
- Equity multiple
- 0.25×
- Total profit
- $-50,297
- Equity at exit
- $35,785
- IRR
- -27.0%
- Equity multiple
- -0.10×
- Total profit
- $-73,955
- Equity at exit
- $20,751
Cash invested: $67,200 (down + closing). Projections, not guarantees.
Landlord ↔ Tenant lean methodology
- Overall (STATE)
- 87 Strongly Landlord-Friendly
- State Texas
- 87 Strongly Landlord-Friendly · R+5
- County
- — inherits STATE
- City
- — inherits STATE
ZIP-level market 78640
- Home prices YoY
- -33.8%
- Rents YoY
- -0.3%
- Active inventory
- 1801
- Price-to-rent
- 9.6×
Monthly cashflow live
- Estimated rent
- $2,074 high interval (Pro) →
- Mortgage (P&I)
- −$1,259
- Tax est. 1.5%
- −$300 /mo · $3,600/yr
- Insurance
- −$100
- HOA
- −$65
- Vacancy / Maint / Mgmt
- −$436
- Net cashflow
- $-85
Break-even live
UW: 25.0% down · 7.5% · 30yr · 1.5% tax · 5.0% vac · 8.0% maint · 8.0% mgmt
Financing live
Cash to close
- Down payment
- $60,000
- Closing costs
- $7,200
- Reserves months
- —
- Total cash needed
- —
Loan-product check · same deal, 3 products live
Conventional
25% down · 7.5% · 30yr
- Down + closing
- —
- Monthly P&I
- —
- Monthly cashflow
- —
- DSCR
- —
- Eligible?
- —
Personal DTI + credit; lowest rate.
DSCR
20% down · 8.5% · 30yr
- Down + closing
- —
- Monthly P&I
- —
- Monthly cashflow
- —
- DSCR
- —
- Eligible?
- —
No personal income docs; deal must DSCR.
Hard money
10% down · 12.0% · 12mo
- Down + closing
- —
- Monthly P&I
- —
- Monthly cashflow
- —
- DSCR
- —
- Eligible?
- —
Short-term bridge; refi at stabilization.
Rent comps 17 comps
| Address | Beds | Baths | Sqft | Rent | $/sqft | DOM | Units | Dist |
|---|---|---|---|---|---|---|---|---|
| 397 Keefer Kyle, TX | 3.0 | 2.0 | 1450 | $1,850 | $1.28 | 1d | 1 | 0.17mi |
| 190 Tofalla Kyle, TX | 4.0 | 2.0 | 1774 | $2,200 | $1.24 | 23d | 1 | 0.31mi |
| 216 Jeffers Kyle, TX | 3.0 | 2.0 | 1622 | $2,095 | $1.29 | 23d | 1 | 0.41mi |
| 500 Jack Ryan Kyle, TX | 4.0 | 2.0 | 1622 | $2,200 | $1.36 | 17d | 1 | 0.53mi |
| 167 Rioja Unit (Main House) Kyle, TX | 3.0 | 2.5 | 1569 | $1,900 | $1.21 | 4d | 1 | 0.58mi |
| 167 Rioja Kyle, TX | 3.0 | 3.0 | 1569 | $2,300 | $1.47 | 43d | 1 | 0.58mi |
| 220 Barcelona Kyle, TX | 4.0 | 2.0 | 1774 | $2,200 | $1.24 | 3d | 1 | 0.65mi |
| 250 Barcelona Kyle, TX | 3.0 | 2.0 | 1278 | $1,899 | $1.49 | 12d | 1 | 0.67mi |
| 321 Barcelona Kyle, TX | 3.0 | 2.0 | 1276 | $2,600 | $2.04 | 17d | 1 | 0.70mi |
| 3875 Burnham Kyle, TX | 1.0–3.0 | 1.0–2.0 | 956 | $2,793 | $2.92 | 1d | 42 | 0.71mi |
| 252 Patagonia Kyle, TX | 3.0 | 2.5 | 1434 | $2,000 | $1.39 | 4d | 1 | 0.74mi |
| 541 Barcelona Kyle, TX | 3.0 | 2.0 | 1274 | $1,950 | $1.53 | 4d | 1 | 0.83mi |
| 201 Edwin Kyle, TX | 3.0 | 2.0 | 1333 | $1,950 | $1.46 | 16d | 1 | 0.95mi |
| 510 Kohlers Xing Kyle, TX | 1.0–3.0 | 1.0–2.0 | 977 | $1,731 | $1.77 | 43d | 1 | 0.99mi |
| 4300 Cromwell Dr Kyle, TX | 2.0 | 1.0–2.0 | 845 | $2,295 | $2.71 | 2d | 13 | 1.15mi |
| 4624 Cromwell Dr Kyle, TX | 2.0–3.0 | 2.0 | 1172 | $1,790 | $1.53 | 2d | 8 | 1.39mi |
| 1050 Wittenburg Kyle, TX | 2.0 | 1.0–2.0 | 880 | $1,685 | $1.91 | 1d | 19 | 1.44mi |
HOA detail
- Monthly dues
- $65 · $780/yr
Listing history 14 events
-
2026-06-18days on market $239,999 Active 8 DOM
-
2026-06-17days on market $239,999 Active 7 DOM
-
2026-06-16days on market $239,999 Active 6 DOM
-
2026-06-15days on market $239,999 Active 5 DOM
-
2026-06-13remarks 464-char remark
-
2026-06-13days on market $239,999 Active 3 DOM
-
2026-06-09days on market $239,999 Active 14 DOM
-
2026-06-08days on market $239,999 Active 13 DOM
-
2026-06-07days on market $239,999 Active 12 DOM
-
2026-06-05pricedays on market $239,999 Active 9 DOM
-
2026-06-03days on market $241,999 Active 8 DOM
-
2026-06-02days on market $241,999 Active 7 DOM
-
2026-06-01days on market $241,999 Active 6 DOM
-
2026-05-31days on market $241,999 Active 5 DOM
ⓘ Source: listings_history table (triggers on properties + properties_extension) + one-shot
backfill from property_details.listing_events for pre-trigger history.
Climate risk First Street
- Flood 1/10 Low FEMA zone X (unshaded) · 0% chance over 30 yrs
- Wildfire 4/10 Moderate
- Heat 8/10 Severe 6 d/yr ≥108°F today · 19 d/yr by 30 yrs out
- Wind 8/10 Severe 80% chance of damaging wind over 30 yrs
- Air quality 2/10 Low 0 unhealthy d/yr today · 1 by 30 yrs out
Nearby sold comps map
Loading sold comps map…
Walkable amenities ~0.75 mi
Loading nearby amenities…
Taxation est. · year 1
- Rental income
- $24,893
- − Mortgage interest
- −$13,444
- − Property taxes
- −$3,600
- − Insurance
- −$1,200
- − Repairs & maintenance
- −$1,991
- − Management
- −$1,991
- − HOA
- −$780
- − Depreciation
- −$6,982
- Taxable loss
- −$5,095
- Est. tax savings @ 24.0%
- +$1,223
- After-tax cash flow
- $206/yr
For passive investors: Depreciation is non-cash, so a rental often shows a tax loss while cash-flowing — sheltering income. Rental losses are passive: they offset passive income freely, and up to $25,000/yr can offset ordinary (W-2) income if you actively participate and your MAGI is under $100k (phasing out to $0 by $150k); unused losses carry forward. On sale, claimed depreciation is recaptured at up to 25%, and gains may owe capital-gains tax (a 1031 exchange can defer both). Figures are a year-1 estimate at your 24.0% rate — not tax advice; consult a CPA.
Condition & rehab AI · 2 photos
This two-story home is in good condition with a well-maintained exterior and landscaping. Painting the exterior and making interior updates would significantly increase its value.
Value-add opportunities
- Both Paint the exterior — Painting the exterior can enhance curb appeal and increase both resale and rental value.
- Both Landscaping improvements — Enhancing the landscaping can improve curb appeal and attract more potential buyers or renters.
- Both Interior updates — Updating the interior can increase the home's value by making it more attractive to potential buyers or renters.
Renovation cost estimate screening
Value-add ROI direction
- Both Paint the exterior — Painting the exterior can enhance curb appeal and increase both resale and rental value. ↑
- Both Landscaping improvements — Enhancing the landscaping can improve curb appeal and attract more potential buyers or renters. ↑
- Both Interior updates — Updating the interior can increase the home's value by making it more attractive to potential buyers or renters. ↑
ⓘ Cost ranges are severity-bucket heuristics (US national rule-of-thumb). Get contractor quotes + a written scope before underwriting a rehab budget.
Schools (NCES district)
- District
- Hays CISD
- NCES district ID
- 4800010
- Math proficiency
- 35% ▼ -15.00%
- Reading proficiency
- 41% ▼ -5.00%
- Median HH income
- $70,570
- Composite
- 34.78/100
- National rank
- #5118
- State rank
- #390 of 826 in TX
Livability — Kyle
- Score
- 75/100
- State rank
- #138
- US rank
- #3993
Category grades
Schools grade is shown separately in the Schools card above.
Census & demographics
- Census place
- Kyle, TX
- County
- Hays County · 280,138 people
- City population
- 77,531
- Metro
- Austin-Round Rock-Georgetown, TX
- Population (ZIP)
- 77,531
- Household income
- $90,075
- Rent vs Own
- Severe rent burden
- 2552.0
Population outlook (Hays County) Hauer SSP2
- Today (2025)
- 286,948 people
- By 2030
- 336,923 · +17.4%
- By 2040
- 441,894 · +54.0%
- By 2050
- 553,462 · +92.9%
- By 2075
- 838,261 · +192.1%
- By 2100
- 1,063,658 · +270.7%
Race, ethnicity, and origin ACS 2023
- Neighborhood character
- Diverse neighborhood (Simpson 0.56)
- Race & ethnicity
- Hispanic / Latino 55% White 36% Two or more races 29% Black 5% Native American 1%
- Hispanic origin (detail)
- Mexican 47% Puerto Rican 1%
- Common ancestry
- Italian 2% Slovak 2% Lithuanian 1%
- Foreign-born
- 13% · Canada
- Languages at home
- 63% English-only · Spanish 35%
Political lean MEDSL · Hays
- 2024 margin
- Lean D (+5.7) · D 52.1% · R 46.5% · Other 1.4%
- 2008→2024 swing
- +7.7pp toward D · 2008: -2.0pp · 2024: 5.7pp
- All cycles
- 2024: D+5.7 2020: D+10.8 2016: R+0.9 2012: R+10.4 2008: R+2.0
Not yet ingested
- Civics
- —
Market trends
- HPI YoY
- ▼ -92.64%
- Current HPI
- 181.7969
- Rent YoY
- ▼ -0.34%
- Metro
- Austin-Round Rock-Georgetown, TX
- State GDP YoY
- ▲ 3.95%
- F500 in state
- 110
Industry mix (Fortune 500 HQ in TX)
| Industry | F500 HQs | Revenue |
|---|---|---|
| Energy | 16 | $1,198B |
|
||
| Technology | 5 | $198B |
|
||
| Engineering / Construction | 4 | $72B |
|
||
| Energy Services | 3 | $60B |
|
||
| Utilities | 3 | $41B |
|
||
| Healthcare | 2 | $330B |
|
||
Cash-flow waterfall
monthlySold comps — $/sqft
last 12 mo · ≤1 miLoading sold comps…