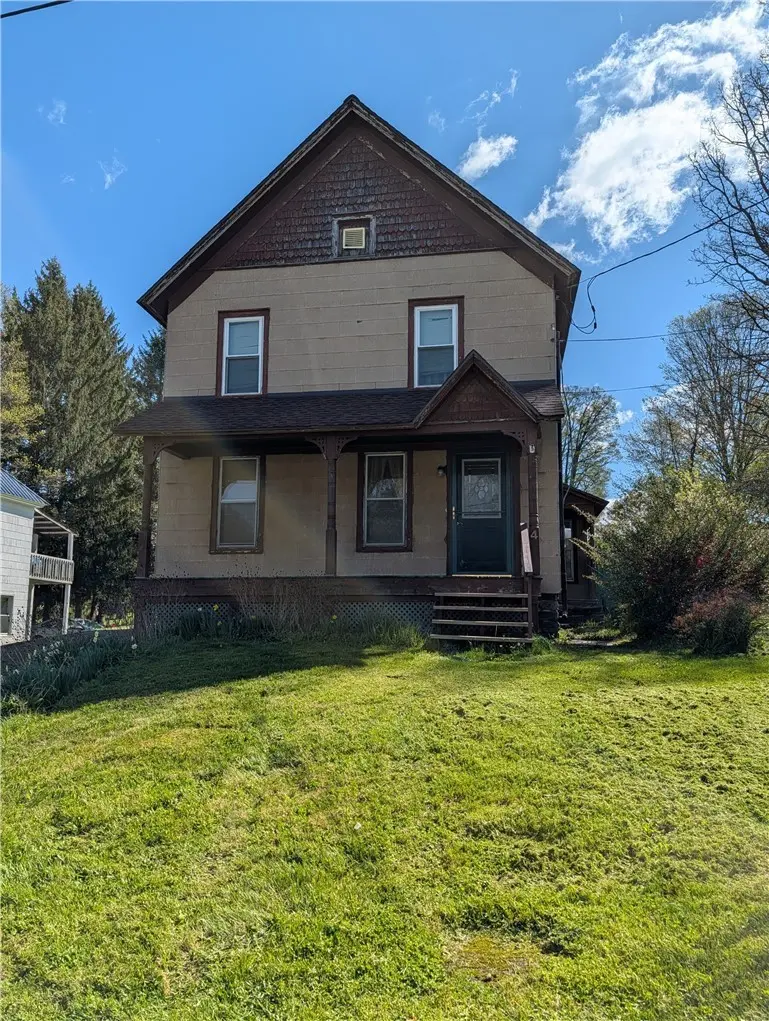
4 Franklin St · Oxford, NY
Flood risk 1/10 · Minimal
- FEMA flood zone
- X (unshaded)
- Chance of flooding over 30 yrs
- 0.0%
- Est. flood insurance / yr
- $473 – $860
Fire risk 3/10 · Minor
- Est. fire insurance / yr
- $691 – $1,283
Heat risk 3/10 · Minor
- Hot days now (above 92°F)
- 7 days/yr
- Hot days in 30 yrs
- 18 days/yr
Wind risk 2/10 · Minimal
- Chance of severe wind over 30 yrs
- 1.0%
Air-quality risk 2/10 · Minimal
- Unhealthy air days now
- 0 days/yr
- Unhealthy air days in 30 yrs
- 1 days/yr
Risk factors via First Street. Map © Google.
Why this score? — see what drove the B+ grade
The composite is a weighted blend of 9 inputs, each scored 0–100. Each bar is that input's sub-score; the figure is the points it added to the 100-point composite (weight × sub-score).
- Cash flow +28.8/30.0
- DSCR +10.0/10.0
- Appreciation +10.0/10.0
- 1% rule +8.0/10.0
- ARV discount +7.0/15.0
- Schools +3.3/10.0
- Livability +3.2/5.0
- Rent growth +2.5/5.0
- Condition / age +2.2/5.0
$84,900
🖨 Deal sheet (PDF) 📄 Offer letter ✓ Due diligence
Listing remarks
Sitting up high and proud! This older home is up on a knoll looking over a quiet village street. This home has 2 bedrooms and 1.5 baths (could easily be 2 full). House needs some TLC but newer roof (2 y/o). New water heater and newer appliances. Nice Big backyard with shed. Walking distance to all village amenities.
Key facts
- Big backyard
- Newer roof
- Newer appliances
Tags
Property features AI
Exterior
- Parking: No garage
- Utilities: Public water (connected); Sewer connected
- Home design: Two-story; Existing/resale property
- Construction: Frame construction; Stone foundation; Asphalt shingle roof; Built previously (existing)
- Exterior features: Gravel driveway; Rectangular lot (approx. 66 x 178)
Interior
- Kitchen: Free-standing range; Oven
- Bedrooms: Total rooms: 6
- Flooring: Carpet; Hardwood; Vinyl; Varies
- Bathrooms: 1 full bathroom; 1 half bathroom; 1 main-level bathroom
- Heating & cooling: Gas forced-air heating
- Interior features: Separate/formal dining room; Eat-in kitchen; Partial basement
- Laundry & utility: Washer and dryer (main level); Gas water heater
Neighborhood map
What this means for you Summary
Snapshot
- This is a 2-bed/1.5-bath single-family listed at $85k. Condition is rated fair.
Deal economics
- At list price, monthly cash flow is $285 ($3k/yr) — positive.
- The deal already cash-flows at list — no discount required.
- Meets the 1% rule at list price ($1k rent vs $85k).
- Recommended offer: $82k (3.0% below list) — sets the bar for market timing.
Location & tenants
- Location reads 64/100 on livability (#766 in NY) — a middle-class / working-renter tenant base. Strengths: cost of living A+, housing A+, crime A-; Watch: health & safety D, amenities F, commute F.
- Oxford Academy And Central School District (rural): math 36% / reading 42% proficiency, ranked #533 of 590 in NY (top 90%) — families likely to look elsewhere, expect single-tenant / working-renter base with shorter leases.
- Zoned schools: Oxford Academy Primary School (math 32% / reading 42%, grade F, #1,519 of 2,108 statewide, top 74%, 288 students, 54% FRL); Oxford Academy Middle School (math 27% / reading 42%, grade F, #483 of 729 statewide, top 68%, 234 students, 47% FRL); Oxford Academy High School (math 84%, 198 students, 42% FRL) — zoned schools at 48% FRL track the district average.
- Market conditions: 29 active listings in the ZIP; 151 units permitted in Chenango County in 2024 (96 in 5+ unit buildings).
Forward outlook
- In year one you build about $9k of equity ($587 loan paydown + $8k appreciation (10.0% local appreciation)).
- Chenango County population projected at -26% by 2050 — secular population decline; favor cash flow + early exit over multi-decade hold.
- At projected returns (10.0% appreciation + 3.0% rent growth), your $24k cash investment doubles in ~2 years — after that, you're playing with house money.
- By year 4, paydown + projected appreciation supports a ~$32k cash-out refi (75% LTV) — recoverable capital for the next deal without selling this one.
Negotiation context
- It's been on market 50 days — a 3% lower offer ($82k) is reasonable based on typical stale-listing flexibility.
- 2 sale attempts with the ask held roughly flat each time — persistent listings suggest the price (not the market) is what's stuck; bring a comps-based counter.
Risks & watch-outs
- Watch-outs: built in 1900 — expect roof / HVAC / electrical / plumbing capex.
Questions for the listing agent
- It's been on market 50 days. Have you received any prior offers? Is the seller open to a 3% concession, seller financing, or rate buy-down credit?
- Have any recent inspections been done? Can we get a copy of the seller's disclosures and any deferred-maintenance estimates?
- Built in 1900 — when were the roof, HVAC, electrical panel, plumbing, and water heater last replaced?
- Is there a deadline driving the sale (1031 exchange, divorce, estate, relocation)? That informs how much negotiation room exists.
- Schools are B-rated — typically a magnet for longer-tenancy family renters. What's the average tenant stay here, and is there a school-zone premium baked into asking?
- What's the average days-on-market for RENTAL listings here right now (not sales)? A rising rental-DOM trend means longer vacancies and softer asking-rent achievability than the comps imply.
- What's the recent tenant-quality profile in this submarket — average credit score on applications, eviction rate, late-payment / NSF rate, and stable-employment percentage? A property-management company in the area should have these aggregated.
- How much new for-sale + rental construction is in the pipeline within 1–3 miles? Heavy new supply typically softens prices + rents 12–24 months out; constrained supply supports both.
Investment metrics
- 1% rule
- 1.30% ✓
- Cap rate
- 10.33%
- Cash-on-cash
- 14.40%
- DSCR
- 1.64
- GRM
- 6.4
CMA / ARV
- ARV (on-the-fly)
- $83,875
- Comps found
- 5
Show comp detail 5 sales within ~0.75 mi
| Address | Dist | Beds/Ba | Sqft | Sold | Price | $/sf | Match |
|---|---|---|---|---|---|---|---|
| 11 Fairview St | 0.07mi | 3/1.5 (+1) | 1,400 (-8%) | 17mo | $169,600 | $121 | 64 |
| 36 Albany St | 0.08mi | 3/1.0 (+1) | 1,320 (-13%) | 9mo | $25,000 | $19 | 59 |
| 11 S Canal St | 0.58mi | 3/1.5 (+1) | 1,450 (-5%) | 12mo | $56,000 | $39 | 50 |
| 2 Mechanic St | 0.48mi | 3/1.0 (+1) | 1,650 (+8%) | 14mo | $126,500 | $77 | 46 |
| 16 Taylor St | 0.62mi | 3/1.5 (+1) | 1,365 (-10%) | 14mo | $74,900 | $55 | 37 |
Match score weights: distance 35% · size 25% · config 20% · recency 20%. Top-matched comps best support the ARV.
Projected returns pro-forma
10.0% appreciation · 3.0% rent growth · sell at horizon
- IRR
- 34.9%
- Equity multiple
- 3.71×
- Total profit
- $64,426
- Equity at exit
- $76,485
- IRR
- 30.1%
- Equity multiple
- 8.38×
- Total profit
- $175,469
- Equity at exit
- $164,942
Cash invested: $23,772 (down + closing). Projections, not guarantees.
Landlord ↔ Tenant lean methodology
- Overall (STATE)
- 15 Strongly Tenant-Friendly
- State New York
- 15 Strongly Tenant-Friendly · D+10
- County
- — inherits STATE
- City
- — inherits STATE
ZIP-level market 13830
- Home prices YoY
- 4.4%
- Active inventory
- 29
- Price-to-rent
- 6.4×
Monthly cashflow live
- Estimated rent
- $1,104 medium interval (Pro) →
- Mortgage (P&I)
- −$445
- Tax est. 1.5%
- −$106 /mo · $1,274/yr
- Insurance
- −$35
- HOA
- −$0
- Vacancy / Maint / Mgmt
- −$232
- Net cashflow
- $285
Break-even live
Sensitivity live
| Price | -10% $344 | -5% $315 | +0% $285 | +5% $256 | +10% $227 |
|---|---|---|---|---|---|
| Rent | -10% $198 | -5% $242 | +0% $285 | +5% $329 | +10% $373 |
| Rate | -1.0pp $328 | -0.5pp $307 | base $285 | +0.5pp $263 | +1.0pp $241 |
UW: 25.0% down · 7.5% · 30yr · 1.5% tax · 5.0% vac · 8.0% maint · 8.0% mgmt
Financing live
Cash to close
- Down payment
- $21,225
- Closing costs
- $2,547
- Reserves months
- —
- Total cash needed
- —
Loan-product check · same deal, 3 products live
Conventional
25% down · 7.5% · 30yr
- Down + closing
- —
- Monthly P&I
- —
- Monthly cashflow
- —
- DSCR
- —
- Eligible?
- —
Personal DTI + credit; lowest rate.
DSCR
20% down · 8.5% · 30yr
- Down + closing
- —
- Monthly P&I
- —
- Monthly cashflow
- —
- DSCR
- —
- Eligible?
- —
No personal income docs; deal must DSCR.
Hard money
10% down · 12.0% · 12mo
- Down + closing
- —
- Monthly P&I
- —
- Monthly cashflow
- —
- DSCR
- —
- Eligible?
- —
Short-term bridge; refi at stabilization.
Listing history 22 events
-
2026-06-21days on market $84,900 Active 50 DOM
-
2026-06-21days on market $84,900 Active 49 DOM
-
2026-06-18days on market $84,900 Active 47 DOM
-
2026-06-17days on market $84,900 Active 46 DOM
-
2026-06-16days on market $84,900 Active 45 DOM
-
2026-06-15days on market $84,900 Active 44 DOM
-
2026-06-13days on market $84,900 Active 42 DOM
-
2026-06-12days on market $84,900 Active 41 DOM
-
2026-06-09days on market $84,900 Active 38 DOM
-
2026-06-08days on market $84,900 Active 37 DOM
-
2026-06-07days on market $84,900 Active 36 DOM
-
2026-06-07days on market $84,900 Active 35 DOM
-
2026-06-04days on market $84,900 Active 32 DOM
-
2026-06-02days on market $84,900 Active 31 DOM
-
2026-06-01days on market $84,900 Active 30 DOM
-
2026-05-31days on market $84,900 Active 29 DOM
-
2026-05-02$84,900 Active
-
2026-02-10historical
-
2025-12-17price $82,900
-
2025-11-04price $84,900
-
2025-09-07price $89,900
-
2025-08-10$92,900 Active
ⓘ Source: listings_history table (triggers on properties + properties_extension) + one-shot
backfill from property_details.listing_events for pre-trigger history.
Climate risk First Street
- Flood 1/10 Low FEMA zone X (unshaded) · 0% chance over 30 yrs
- Wildfire 3/10 Moderate
- Heat 3/10 Moderate 7 d/yr ≥92°F today · 18 d/yr by 30 yrs out
- Wind 2/10 Low 100% chance of damaging wind over 30 yrs
- Air quality 2/10 Low 0 unhealthy d/yr today · 1 by 30 yrs out
Nearby sold comps map
Loading sold comps map…
Walkable amenities ~0.75 mi
Loading nearby amenities…
Taxation est. · year 1
- Rental income
- $13,246
- − Mortgage interest
- −$4,756
- − Property taxes
- −$1,274
- − Insurance
- −$424
- − Repairs & maintenance
- −$1,060
- − Management
- −$1,060
- − Depreciation
- −$2,470
- Taxable income
- $2,203
- Est. tax owed @ 24.0%
- −$529
- After-tax cash flow
- $2,895/yr
For passive investors: Depreciation is non-cash, so a rental often shows a tax loss while cash-flowing — sheltering income. Rental losses are passive: they offset passive income freely, and up to $25,000/yr can offset ordinary (W-2) income if you actively participate and your MAGI is under $100k (phasing out to $0 by $150k); unused losses carry forward. On sale, claimed depreciation is recaptured at up to 25%, and gains may owe capital-gains tax (a 1031 exchange can defer both). Figures are a year-1 estimate at your 24.0% rate — not tax advice; consult a CPA.
Condition & rehab AI · 1 photo
This older home on a knoll needs moderate renovations, including new siding, kitchen and bathroom renovations, and fresh paint, to improve its condition and value.
Repairs flagged
- Major Exterior siding — Weathered and in need of replacement
- Major Kitchen — No photos, but likely outdated and in need of renovation
- Major Bathroom — No photos, but likely outdated and in need of renovation
Value-add opportunities
- Both Paint interior walls and trim — Fresh paint can make a significant difference in appearance and value
- Both Replace exterior siding — New siding will improve curb appeal and increase value
- Both Renovate kitchen and bathroom — Up-to-date kitchens and bathrooms are highly sought after and can significantly boost value
Renovation cost estimate screening
| Repair item | Severity | Est. cost |
|---|---|---|
| Exterior siding · Weathered and in need of replacement | Major | $15,000–50,000 |
| Kitchen · No photos, but likely outdated and in need of renovation | Major | $15,000–50,000 |
| Bathroom · No photos, but likely outdated and in need of renovation | Major | $15,000–50,000 |
| Total estimated repair cost · 3 items | $45,000–150,000 |
Value-add ROI direction
- Both Paint interior walls and trim — Fresh paint can make a significant difference in appearance and value ↑
- Both Replace exterior siding — New siding will improve curb appeal and increase value ↑
- Both Renovate kitchen and bathroom — Up-to-date kitchens and bathrooms are highly sought after and can significantly boost value ↑
ⓘ Cost ranges are severity-bucket heuristics (US national rule-of-thumb). Get contractor quotes + a written scope before underwriting a rehab budget.
Schools (NCES district)
- District
- Oxford Academy And Central School District
- NCES district ID
- 3622260
- Math proficiency
- 36% ▼ -13.00%
- Reading proficiency
- 42% ▬ 0.00%
- Median HH income
- $45,916
- Composite
- 33.26/100
- National rank
- #5513
- State rank
- #533 of 590 in NY
Livability — Oxford
- Score
- 64/100
- State rank
- #766
- US rank
- #14698
Category grades
Schools grade is shown separately in the Schools card above.
Census & demographics
- Census place
- Oxford, NY
- Population (ZIP)
- 4,826
Population outlook (Chenango County) Hauer SSP2
- Today (2025)
- 45,669 people
- By 2030
- 43,484 · -4.8%
- By 2040
- 38,774 · -15.1%
- By 2050
- 34,000 · -25.6%
- By 2075
- 24,637 · -46.1%
- By 2100
- 16,452 · -64.0%
Race, ethnicity, and origin ACS 2023
- Neighborhood character
- Predominantly White (95%)
- Race & ethnicity
- White 95% Two or more races 2% Hispanic / Latino 2%
- Common ancestry
- Italian 5% Romanian 4% Iranian 2%
- Foreign-born
- 2% · Canada
- Languages at home
- 98% English-only · Spanish 1%
Political lean MEDSL · Chenango
- 2024 margin
- Strong R (+27.2) · D 36.4% · R 63.6%
- 2008→2024 swing
- -26.1pp toward R · 2008: -1.1pp · 2024: -27.2pp
- All cycles
- 2024: R+27.2 2020: R+23.3 2016: R+28.1 2012: R+3.4 2008: R+1.1
Not yet ingested
- Civics
- —
Market trends
- HPI YoY
- ▲ 13.35%
- Current HPI
- 318.8185
- Rent YoY
- —
- Metro
- —
- State GDP YoY
- ▲ 2.60%
- F500 in state
- 92
Industry mix (Fortune 500 HQ in NY)
| Industry | F500 HQs | Revenue |
|---|---|---|
| Financial Services | 10 | $950B |
|
||
| Consumer Goods | 9 | $162B |
|
||
| Insurance | 4 | $225B |
|
||
| Telecommunications | 2 | $144B |
|
||
| Pharmaceuticals | 2 | $112B |
|
||
| Media / Entertainment | 2 | $69B |
|
||
Price history
-8.6% since first listed6 events — show timeline
- 2026-05-02 Listed $84,900 UNYREIS
- 2026-02-10 Listing Removed — UNYREIS
- 2025-12-17 Price Changed $82,900 UNYREIS
- 2025-11-04 Price Changed $84,900 UNYREIS
- 2025-09-07 Price Changed $89,900 UNYREIS
- 2025-08-10 Listed $92,900 UNYREIS
Cash-flow waterfall
monthlySold comps — $/sqft
last 12 mo · ≤1 miLoading sold comps…