 6-Plex
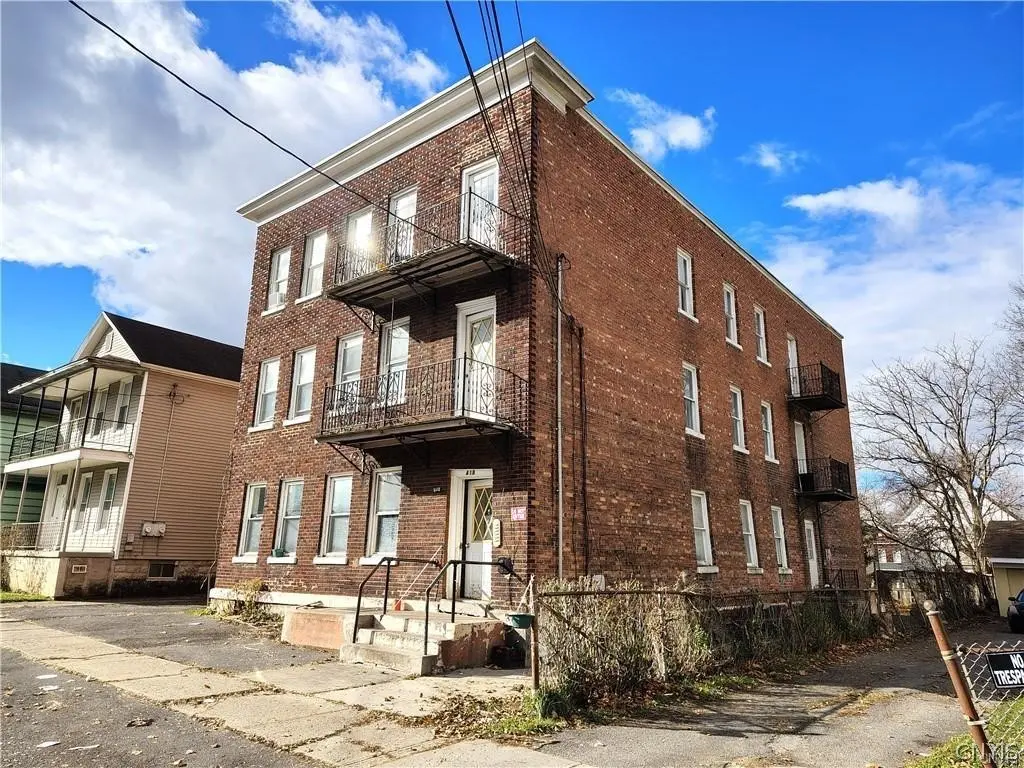
418 Bacon St · Utica, NY
Flood risk 1/10 · Minimal
- FEMA flood zone
- X (unshaded)
- Chance of flooding over 30 yrs
- 0.0%
- Est. flood insurance / yr
- $473 – $860
Fire risk 3/10 · Minor
- Est. fire insurance / yr
- $691 – $1,283
Heat risk 3/10 · Minor
- Hot days now (above 95°F)
- 7 days/yr
- Hot days in 30 yrs
- 17 days/yr
Wind risk 2/10 · Minimal
- Chance of severe wind over 30 yrs
- 1.0%
Air-quality risk 2/10 · Minimal
- Unhealthy air days now
- 0 days/yr
- Unhealthy air days in 30 yrs
- 1 days/yr
Risk factors via First Street. Map © Google.
Why this score? — see what drove the C- grade
The composite is a weighted blend of 9 inputs, each scored 0–100. Each bar is that input's sub-score; the figure is the points it added to the 100-point composite (weight × sub-score).
- Cash flow +15.0/30.0
- Appreciation +10.0/10.0
- ARV discount +7.5/15.0
- 1% rule +5.0/10.0
- DSCR +5.0/10.0
- Livability +4.0/5.0
- Schools +2.9/10.0
- Rent growth +2.5/5.0
- Condition / age +2.5/5.0
$169,900
🖨 Deal sheet 📄 Offer letter ✓ Due diligence
Multi-family units
County records classify this as Multi-Family (5+ Unit). Listing-text estimate: 6 units. confirmed
5+ unit building — per-unit beds/baths from public records are typically unavailable; the breakdown below (if shown) is an estimate from the listing text.
Listing remarks MLS
OPPERTUNITY IS KNOCKING!! This brick-built 6-unit property offers an impressive 7,900+ sqft of living space providing exceptional rental income potential. Each floor features two spacious 2-bedroom 1 bath apartments with eat-in kitchens & nicely sized living rooms making this an ideal multi-family investment. Several units have been refreshed with new flooring, fresh paint, and updated kitchens, creating a clean and appealing living experience for tenants. The building is efficiently set up with separate gas and electric utilities for each unit, minimizing owner expenses. A full basement provides ample space for storage and utilities, adding even more functionality to the property and small back yard for tenants to enjoy. Perfectly situated along the Utica bus line, this location offers unbeatable convenience—just minutes from restaurants, shopping, downtown Utica, and Route 5S. Whether you’re expanding your portfolio or seeking a high-yield opportunity, this property checks all the boxes. A little TLC will turn this rental property into an INCOME POWER HOUSE. ARV Value is 330k-350k. Don’t miss out on this rare investment gem!
Key facts
- Full basement
- Small back yard
- 4,800 sq ft lot
Tags
Neighborhood map
What this means for you Summary
Snapshot
- This is a 6 × 2-bed/1-bath units multifamily listed at $170k.
Deal economics
- At list price, monthly cash flow is $6k ($76k/yr) — positive. Per door: $1k/mo.
- The deal already cash-flows at list — no discount required.
- Meets the 1% rule at list price ($9k rent vs $170k).
- Recommended offer: $165k (3.0% below list) — sets the bar for market timing.
- Cap rate 51.1% vs local median 7.7% in Utica — top-decile yield for the area; either an underpriced asset or a hidden risk that comps aren't pricing in. Stress-test before assuming the spread holds.
Location & tenants
- Location reads 80/100 on livability (#104 in NY, #1,589 nationally) — a professional / high-income tenant draw. Strengths: commute A+, cost of living A+, housing A+; Watch: employment D, schools D-, crime F.
- Utica City School District (urban): math 33% / reading 38% proficiency, ranked #562 of 590 in NY (top 95%) — families likely to look elsewhere, expect single-tenant / working-renter base with shorter leases; 71% free/reduced lunch — lower-income household profile, screen leases tightly.
- Market conditions: 143 active listings in the ZIP; 204 units permitted in Oneida County in 2024 (68 in 5+ unit buildings).
- At $9,376/mo this rent would consume 214% of the median local household income ($53k/yr) (locally 2251% of renters already pay >50% of income on rent) — very limited rent-growth headroom before tenants either downsize or default.
Forward outlook
- In year one you build about $18k of equity ($1k loan paydown + $17k appreciation (10.0% local appreciation)).
- Oneida County population projected at -12% by 2050 — secular population decline; favor cash flow + early exit over multi-decade hold.
- At projected returns (10.0% appreciation + 3.0% rent growth), your $48k cash investment doubles in ~1 year — after that, you're playing with house money.
- By year 3, paydown + projected appreciation supports a ~$46k cash-out refi (75% LTV) — recoverable capital for the next deal without selling this one.
Negotiation context
- It's been on market 60 days — a 3% lower offer ($165k) is reasonable based on typical stale-listing flexibility.
- 3 sale attempts since 30y ago; this cycle's ask has dropped $20k (11%) from the opening price — seller is motivated, your offer sets the floor, not the list.
- Current owner paid $115k; 48% above their basis — modest negotiation headroom, anchor on the comps not their cost.
Risks & watch-outs
- Watch-outs: built in 1900 — expect roof / HVAC / electrical / plumbing capex.
Questions for the listing agent
- It's been on market 60 days. Have you received any prior offers? Is the seller open to a 3% concession, seller financing, or rate buy-down credit?
- Can we see the unit-by-unit rent roll, current vacancy, and any below-market leases? What's the average tenancy length?
- What capital expenditures (roof, boiler, parking lot, exteriors) have been made in the last 5 years, and what's planned in the next 2?
- Built in 1900 — when were the roof, HVAC, electrical panel, plumbing, and water heater last replaced?
- Is there a deadline driving the sale (1031 exchange, divorce, estate, relocation)? That informs how much negotiation room exists.
- Schools are D-rated, which usually means shorter tenancies and higher turnover. Who's the typical renter profile here, and what's been the actual vacancy rate?
- Crime grade is F in this area — have there been break-ins, vandalism, or insurance claims at this property in the last 3 years? What carrier currently insures it and at what premium?
- What's the average days-on-market for RENTAL listings here right now (not sales)? A rising rental-DOM trend means longer vacancies and softer asking-rent achievability than the comps imply.
- What's the recent tenant-quality profile in this submarket — average credit score on applications, eviction rate, late-payment / NSF rate, and stable-employment percentage? A property-management company in the area should have these aggregated.
- How much new apartment / multifamily construction is in the pipeline within 1–3 miles? Heavy new supply (>2% of stock underway) typically softens rents 12–24 months out; light construction supports rent growth.
Investment metrics
- 1% rule
- 5.52% ✓
- Cap rate
- 51.09%
- Cash-on-cash
- 160.00%
- DSCR
- 8.12
- GRM
- 1.5
CMA / ARV
- ARV (median comp)
- $521,726
- List price
- $169,900
- Delta
- -67.44%
- Verdict
- UNDERPRICED
- Comps
- 2 within 1.0 mi
Projected returns pro-forma
10.0% appreciation · 3.0% rent growth · sell at horizon
- IRR
- —
- Equity multiple
- 11.44×
- Total profit
- $496,581
- Equity at exit
- $153,059
- IRR
- —
- Equity multiple
- 25.06×
- Total profit
- $1,144,812
- Equity at exit
- $330,078
Cash invested: $47,572 (down + closing). Projections, not guarantees.
Landlord ↔ Tenant lean methodology
- Overall (STATE)
- 15 Strongly Tenant-Friendly
- State New York
- 15 Strongly Tenant-Friendly · D+10
- County
- — inherits STATE
- City
- — inherits STATE
ZIP-level market 13501
- Home prices YoY
- 5.6%
- Active inventory
- 143
- Price-to-rent
- 9.1×
Monthly cashflow live
- Estimated rent
- $9,376 high interval (Pro) →
- Mortgage (P&I)
- −$891
- Tax from tax record
- −$103 /mo · $1,230/yr
- Insurance
- −$71
- HOA
- −$0
- Vacancy / Maint / Mgmt
- −$1,969
- Net cashflow
- $6,343
Break-even live
6-unit breakdown (identical units grouped — click to expand)
| Units | Beds | Baths | Est. rent |
|---|---|---|---|
| 6× units | 2 | 1 | $9,378 |
| #1 | 2 | 1 | $1,563 |
| #2 | 2 | 1 | $1,563 |
| #3 | 2 | 1 | $1,563 |
| #4 | 2 | 1 | $1,563 |
| #5 | 2 | 1 | $1,563 |
| #6 | 2 | 1 | $1,563 |
| Total (6 units) | $9,376 | ||
UW: 25.0% down · 7.5% · 30yr · 1.5% tax · 5.0% vac · 8.0% maint · 8.0% mgmt
Financing live
Cash to close
- Down payment
- $42,475
- Closing costs
- $5,097
- Reserves months
- —
- Total cash needed
- —
Loan-product check · same deal, 3 products live
Conventional
25% down · 7.5% · 30yr
- Down + closing
- —
- Monthly P&I
- —
- Monthly cashflow
- —
- DSCR
- —
- Eligible?
- —
Personal DTI + credit; lowest rate.
DSCR
20% down · 8.5% · 30yr
- Down + closing
- —
- Monthly P&I
- —
- Monthly cashflow
- —
- DSCR
- —
- Eligible?
- —
No personal income docs; deal must DSCR.
Hard money
10% down · 12.0% · 12mo
- Down + closing
- —
- Monthly P&I
- —
- Monthly cashflow
- —
- DSCR
- —
- Eligible?
- —
Short-term bridge; refi at stabilization.
Listing history 23 events
-
2026-06-19days on market $169,900 Active 60 DOM
-
2026-06-18days on market $169,900 Active 59 DOM
-
2026-06-17days on market $169,900 Active 58 DOM
-
2026-06-16days on market $169,900 Active 57 DOM
-
2026-06-15price $169,900 Active 56 DOM
-
2026-06-15days on market $189,900 Active 56 DOM
-
2026-06-14days on market $189,900 Active 54 DOM
-
2026-06-13days on market $189,900 Active 53 DOM
-
2026-06-10days on market $189,900 Active 51 DOM
-
2026-06-09days on market $189,900 Active 50 DOM
-
2026-06-08days on market $189,900 Active 49 DOM
-
2026-06-07days on market $189,900 Active 48 DOM
-
2026-06-03days on market $189,900 Active 44 DOM
-
2026-06-02days on market $189,900 Active 43 DOM
-
2026-06-01days on market $189,900 Active 42 DOM
-
2026-05-31days on market $189,900 Active 41 DOM
-
2026-05-30days on market $189,900 Active 40 DOM
-
2026-04-20$189,900 Active 1168-char remark
Show marketing remark (1168 chars)
OPPERTUNITY IS KNOCKING!! This brick-built 6-unit property offers an impressive 7,900+ sqft of living space providing exceptional rental income potential. Each floor features two spacious 2-bedroom 1 bath apartments with eat-in kitchens & nicely sized living rooms making this an ideal multi-family investment. Several units have been refreshed with new flooring, fresh paint, and updated kitchens, creating a clean and appealing living experience for tenants. The building is efficiently set up with separate gas and electric utilities for each unit, minimizing owner expenses. A full basement provides ample space for storage and utilities, adding even more functionality to the property and small back yard for tenants to enjoy. Perfectly situated along the Utica bus line, this location offers unbeatable convenience—just minutes from restaurants, shopping, downtown Utica, and Route 5S. Whether you’re expanding your portfolio or seeking a high-yield opportunity, this property checks all the boxes. A little TLC will turn this rental property into an INCOME POWER HOUSE. ARV Value is 330k-350k. Don’t miss out on this rare investment gem!
-
2026-03-07price $227,500
-
2025-11-24$230,000 Active
-
2008-01-18soldstatus $115,000
-
1996-05-19soldstatus $37,500
-
1996-01-22$40,000
ⓘ Source: listings_history table (triggers on properties + properties_extension) + one-shot
backfill from property_details.listing_events for pre-trigger history.
Tax reassessment forecast NY · Partial reset (capped growth)
- Current annual tax
- $1,230 · $103/mo
- Projected year-2 tax
- $2,051 · $171/mo
- Expected delta
- +$821/yr (+$68/mo · 66.7%)
ⓘ Screening estimate from a state-policy table — verify with the county assessor before closing.
Climate risk First Street
- Flood 1/10 Low FEMA zone X (unshaded) · 0% chance over 30 yrs
- Wildfire 3/10 Moderate
- Heat 3/10 Moderate 7 d/yr ≥95°F today · 17 d/yr by 30 yrs out
- Wind 2/10 Low 100% chance of damaging wind over 30 yrs
- Air quality 2/10 Low 0 unhealthy d/yr today · 1 by 30 yrs out
Nearby sold comps map
Loading sold comps map…
Walkable amenities ~0.75 mi
Loading nearby amenities…
Taxation est. · year 1
- Rental income
- $112,512
- − Mortgage interest
- −$9,517
- − Property taxes
- −$1,230
- − Insurance
- −$850
- − Repairs & maintenance
- −$9,001
- − Management
- −$9,001
- − Depreciation
- −$4,943
- Taxable income
- $77,971
- Est. tax owed @ 24.0%
- −$18,713
- After-tax cash flow
- $57,400/yr
For passive investors: Depreciation is non-cash, so a rental often shows a tax loss while cash-flowing — sheltering income. Rental losses are passive: they offset passive income freely, and up to $25,000/yr can offset ordinary (W-2) income if you actively participate and your MAGI is under $100k (phasing out to $0 by $150k); unused losses carry forward. On sale, claimed depreciation is recaptured at up to 25%, and gains may owe capital-gains tax (a 1031 exchange can defer both). Figures are a year-1 estimate at your 24.0% rate — not tax advice; consult a CPA.
Schools (NCES district)
- District
- Utica City School District
- NCES district ID
- 3629370
- Math proficiency
- 33% ▼ -7.00%
- Reading proficiency
- 38% ▲ 2.00%
- Median HH income
- $31,834
- Composite
- 29.01/100
- National rank
- #6613
- State rank
- #562 of 590 in NY
Livability — Utica
- Score
- 80/100
- State rank
- #104
- US rank
- #1589
Category grades
Schools grade is shown separately in the Schools card above.
Census & demographics
- Census place
- Utica, NY
- County
- Oneida County · 89,710 people
- City population
- 72,968
- Metro
- Utica-Rome, NY
- Population (ZIP)
- 38,931
- Household income
- $52,548
- Rent vs Own
- Severe rent burden
- 2251.0
Population outlook (Oneida County) Hauer SSP2
- Today (2025)
- 225,223 people
- By 2030
- 220,384 · -2.1%
- By 2040
- 209,071 · -7.2%
- By 2050
- 197,920 · -12.1%
- By 2075
- 175,541 · -22.1%
- By 2100
- 148,491 · -34.1%
Race, ethnicity, and origin ACS 2023
- Neighborhood character
- Highly diverse neighborhood (Simpson 0.70)
- Race & ethnicity
- White 49% Two or more races 15% Hispanic / Latino 14% Black 14% Asian 14%
- Hispanic origin (detail)
- Puerto Rican 8% Dominican 4%
- Common ancestry
- American 8% Romanian 3% Lithuanian 1%
- Foreign-born
- 25% · Canada, Philippines, Vietnam
- Languages at home
- 62% English-only · Other Asian/Pacific 11% Russian/Polish/Slavic 10% Spanish 9%
Political lean MEDSL · Oneida
- 2024 margin
- Strong R (+21.3) · D 39.4% · R 60.6%
- 2008→2024 swing
- -15.2pp toward R · 2008: -6.1pp · 2024: -21.3pp
- All cycles
- 2024: R+21.3 2020: R+15.5 2016: R+21.1 2012: R+5.3 2008: R+6.1
Not yet ingested
- Civics
- —
Market trends
- HPI YoY
- ▲ 20.28%
- Current HPI
- 382.3726
- Rent YoY
- —
- Metro
- Utica-Rome, NY
- State GDP YoY
- ▲ 2.60%
- F500 in state
- 92
Industry mix (Fortune 500 HQ in NY)
| Industry | F500 HQs | Revenue |
|---|---|---|
| Financial Services | 10 | $950B |
|
||
| Consumer Goods | 9 | $162B |
|
||
| Insurance | 4 | $225B |
|
||
| Telecommunications | 2 | $144B |
|
||
| Pharmaceuticals | 2 | $112B |
|
||
| Media / Entertainment | 2 | $69B |
|
||
Price history
+374.8% since first listed6 events — show timeline
- 2026-04-20 Listed $189,900 CNYIS
- 2026-03-07 Price Changed $227,500 CNYIS
- 2025-11-24 Listed $230,000 CNYIS
- 2008-01-18 Sold (Public Records) $115,000 Public Records
- 1996-05-19 Sold (MLS) $37,500 CNYIS
- 1996-01-22 Listed $40,000 CNYIS
Property tax history
+0.5%/yrLatest (2025): $1,230 · -27.6% YoY. Source: county tax records.
Cash-flow waterfall
monthlySold comps — $/sqft
last 12 mo · ≤1 miLoading sold comps…