 🏗️ New Construction
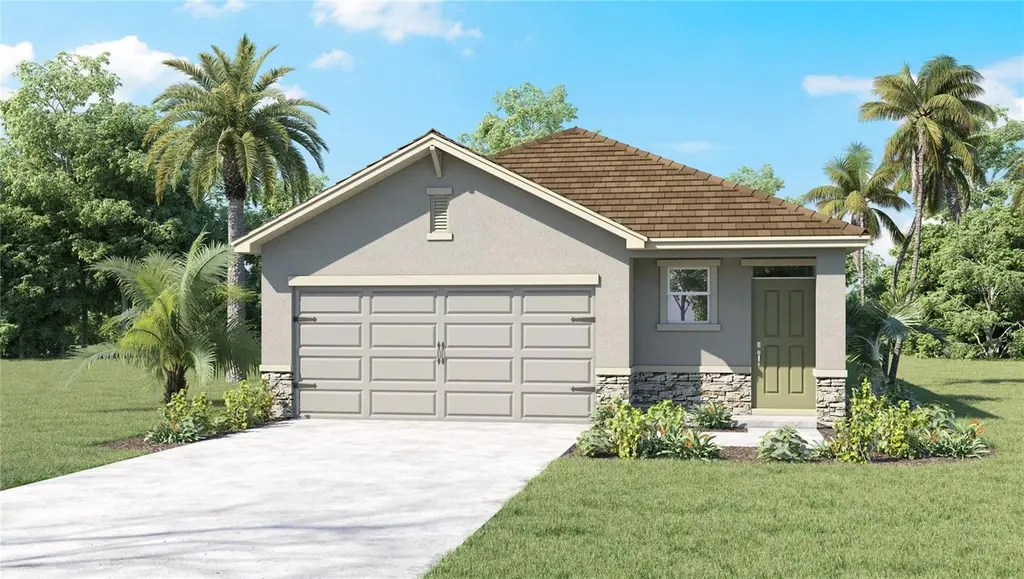
4513 Hidden Farm Dr · Plant City, FL
Flood risk No data
- FEMA flood zone
- —
- Chance of flooding over 30 yrs
- —
- Est. flood insurance / yr
- —
Fire risk No data
- Est. fire insurance / yr
- —
Heat risk No data
- Hot days now (above threshold)
- —
- Hot days in 30 yrs
- —
Wind risk No data
- Chance of severe wind over 30 yrs
- —
Air-quality risk No data
- Unhealthy air days now
- —
- Unhealthy air days in 30 yrs
- —
Risk factors via First Street. Map © Google.
Why this score? — see what drove the D grade
The composite is a weighted blend of 9 inputs, each scored 0–100. Each bar is that input's sub-score; the figure is the points it added to the 100-point composite (weight × sub-score).
- Cash flow +11.5/30.0
- ARV discount +7.5/15.0
- Schools +4.2/10.0
- Condition / age +4.2/5.0
- Livability +3.8/5.0
- 1% rule +3.4/10.0
- DSCR +3.4/10.0
- Rent growth +2.5/5.0
- Appreciation +0.0/10.0
$304,990
🖨 Deal sheet 📄 Offer letter ✓ Due diligence
Listing remarks
Under Construction. Farm at Varrea offers new homes in Plant City, located right off Midway Road, and less than 10 minutes from I-4. Easy access to the interstate provides a seamless commute to the large surrounding cities such as Tampa, Orlando, and Lakeland. Farm at Varrea, nestled among grand oak trees, provides a small-town, rural feel, yet allows homeowners to be immersed in all that Plant City can provide. Just 11 minutes away, you'll find Downtown Plant City with a main street bustling with unique shops, restaurants, and entertainment. Not only is the community in a prime location, but it sits in the center of the Strawberry Capital, where the famous Strawberry Festival is held annua
Key facts
- Prime location
- Smart home system
- 4,792 sq ft lot
Tags
Property features AI
Finance
- Other: Total monthly fees reported as $9; total annual fees reported as $108; Home warranty provided; Builder license number CBC039052
- Financial info: Other annual assessment: $2,589; Lease restrictions apply
- HOA & community: HOA managed by Access Management; Monthly HOA fee approximately $9; Association approval required; Association amenities: Basketball court; Community features: Clubhouse, Fitness center, Playground, Pool; Pets allowed with breed restrictions
Exterior
- Parking: Attached garage; 2-car garage
- Utilities: Public water; Public sewer; Underground utilities
- Home design: Single-family residence; New construction (projected completion: 2026-10-30); One story; Southeast-facing; Under construction
- Construction: Block and stucco construction; Shingle roof; Slab foundation; Built by D.R. Horton (model: Allex II)
- Exterior features: Sliding doors; Paved road access
Interior
- Kitchen: Dishwasher; Range; Microwave; Refrigerator
- Bedrooms: 3 bedrooms
- Flooring: Carpet; Ceramic tile
- Bathrooms: 2 full bathrooms; 1 half bathroom
- Heating & cooling: Central heating; Heat pump; Central air conditioning
- Interior features: Open floorplan; Blinds on windows
- Laundry & utility: Dedicated laundry room; Dryer
Neighborhood map
What this means for you Summary
Snapshot
- This is a 3-bed/2.5-bath single-family listed at $305k. Condition is rated good.
Deal economics
- At list price, monthly cash flow is $-101 ($-1k/yr) — negative.
- To cash-flow at today's rent, offer at most $290k (4.8% below list).
- To meet the 1% rule (rent ≥ 1% of price), the offer needs to be $255k (16.3% below list).
- Recommended offer: $255k (16.3% below list) — sets the bar for 1% rule.
Location & tenants
- Location reads 76/100 on livability (#227 in FL, #3,587 nationally) — a middle-class / working-renter tenant base. Strengths: amenities A+, cost of living A+, housing A+; Watch: employment C-, commute F.
- Hillsborough (suburban): math 47% / reading 50% proficiency, ranked #41 of 73 in FL (top 56%) — families likely to look elsewhere, expect single-tenant / working-renter base with shorter leases.
- Zoned schools: Plant City High School (math 38% / reading 40%, grade F, #312 of 667 statewide, top 48%, 2,474 students, 58% FRL).
- Market conditions: 307 active listings in the ZIP; 10 comparable units currently listed for rent nearby; rentals at typical pace (median 25d on market — plan ~3-4 weeks tenant-placement turnaround); 9,053 units permitted in Hillsborough County in 2024 (4,555 in 5+ unit buildings).
- This rent runs 42% of the median local income ($73k/yr) — at the standard rent-burdened threshold; future hikes will face affordability resistance.
Forward outlook
- Local home prices are declining (-3.0%/yr); year-one equity from $2k of loan paydown is wiped out by about $9k of value loss. Plan a longer hold.
- Hillsborough County population projected at +37% by 2050 — long-run rental-demand tailwind backs the buy-and-hold thesis.
Negotiation context
- It's been on market 32 days — a 3% lower offer ($296k) is reasonable based on typical stale-listing flexibility.
Questions for the listing agent
- What do current leases actually rent for vs. the listed asking? Can we see a recent rent roll and the last 12 months of T-12 income?
- It's been on market 32 days. Have you received any prior offers? Is the seller open to a 16% concession, seller financing, or rate buy-down credit?
- What does the HOA fee cover, when was the last increase, and are there any pending special assessments or reserve-fund shortfalls?
- Is there a deadline driving the sale (1031 exchange, divorce, estate, relocation)? That informs how much negotiation room exists.
- Schools are D-rated, which usually means shorter tenancies and higher turnover. Who's the typical renter profile here, and what's been the actual vacancy rate?
- The area grade is low — what's the realistic commute time and amenity access for the typical tenant pool here? Any planned neighborhood developments (good or bad) we should know about?
- What's the average days-on-market for RENTAL listings here right now (not sales)? A rising rental-DOM trend means longer vacancies and softer asking-rent achievability than the comps imply.
- What's the recent tenant-quality profile in this submarket — average credit score on applications, eviction rate, late-payment / NSF rate, and stable-employment percentage? A property-management company in the area should have these aggregated.
- How much new for-sale + rental construction is in the pipeline within 1–3 miles? Heavy new supply typically softens prices + rents 12–24 months out; constrained supply supports both.
Investment metrics
- 1% rule
- 0.84% ✗
- Cap rate
- 5.90%
- Cash-on-cash
- -1.42%
- DSCR
- 0.94
- GRM
- 10.0
CMA / ARV
No comps found within radius.
Projected returns pro-forma
-3.0% appreciation · 3.0% rent growth · sell at horizon
- IRR
- -18.6%
- Equity multiple
- 0.35×
- Total profit
- $-55,809
- Equity at exit
- $45,475
- IRR
- -11.0%
- Equity multiple
- 0.34×
- Total profit
- $-56,700
- Equity at exit
- $26,370
Cash invested: $85,397 (down + closing). Projections, not guarantees.
Landlord ↔ Tenant lean methodology
- Overall (STATE)
- 87 Strongly Landlord-Friendly
- State Florida
- 87 Strongly Landlord-Friendly · R+3
- County
- — inherits STATE
- City
- — inherits STATE
ZIP-level market 33565
- Home prices YoY
- -24.7%
- Active inventory
- 307
- Price-to-rent
- 10.0×
Monthly cashflow live
- Estimated rent
- $2,552 high interval (Pro) →
- Mortgage (P&I)
- −$1,599
- Tax est. 1.5%
- −$381 /mo · $4,575/yr
- Insurance
- −$127
- HOA
- −$9
- Vacancy / Maint / Mgmt
- −$536
- Net cashflow
- $-101
Break-even live
UW: 25.0% down · 7.5% · 30yr · 1.5% tax · 5.0% vac · 8.0% maint · 8.0% mgmt
Financing live
Cash to close
- Down payment
- $76,248
- Closing costs
- $9,150
- Reserves months
- —
- Total cash needed
- —
Loan-product check · same deal, 3 products live
Conventional
25% down · 7.5% · 30yr
- Down + closing
- —
- Monthly P&I
- —
- Monthly cashflow
- —
- DSCR
- —
- Eligible?
- —
Personal DTI + credit; lowest rate.
DSCR
20% down · 8.5% · 30yr
- Down + closing
- —
- Monthly P&I
- —
- Monthly cashflow
- —
- DSCR
- —
- Eligible?
- —
No personal income docs; deal must DSCR.
Hard money
10% down · 12.0% · 12mo
- Down + closing
- —
- Monthly P&I
- —
- Monthly cashflow
- —
- DSCR
- —
- Eligible?
- —
Short-term bridge; refi at stabilization.
Rent comps 10 comps
| Address | Beds | Baths | Sqft | Rent | $/sqft | DOM | Units | Dist |
|---|---|---|---|---|---|---|---|---|
| 4008 Westwood Fields Loop Plant City, FL | 3.0 | 2.0 | 1565 | $2,300 | $1.47 | 24d | 1 | 0.81mi |
| 4010 Westwood Fields Loop Plant City, FL | 3.0 | 2.0 | 1565 | $2,300 | $1.47 | 24d | 1 | 0.82mi |
| 4005 Westwood Fields Loop Unit 4005 Plant City, FL | 3.0 | 2.0 | 1565 | $2,500 | $1.60 | 24d | 1 | 0.84mi |
| 4027 Westwood Fields Loop Plant City, FL | 3.0 | 2.0 | 1565 | $3,200 | $2.04 | 22d | 1 | 0.84mi |
| 4025 Westwood Fields Loop Plant City, FL | 3.0 | 2.0 | 1565 | $2,425 | $1.55 | 22d | 1 | 0.85mi |
| 3546 Marigold Patch Ct Plant City, FL | 3.0 | 3.0 | 1673 | $2,200 | $1.32 | 24d | 1 | 0.87mi |
| 3546 Marigold Patch Ct Plant City, FL | 3.0 | 2.5 | 1681 | $2,200 | $1.31 | 22d | 1 | 0.87mi |
| 3551 Marigold Patch Ct Plant City, FL | 3.0 | 2.5 | 1681 | $2,200 | $1.31 | 3d | 1 | 0.90mi |
| 4316 E Knights Griffin Rd Plant City, FL | 3.0 | 2.0 | 1305 | $2,499 | $1.91 | 24d | 1 | 1.18mi |
| 2505 Williams Rd Plant City, FL | 3.0 | 2.0 | 2052 | $1,950 | $0.95 | 24d | 1 | 1.48mi |
HOA detail
- Monthly dues
- $9 · $108/yr
Listing history 17 events
-
2026-06-18days on market $304,990 Active 32 DOM
-
2026-06-17price $304,990 Active 31 DOM
-
2026-06-17days on market $329,990 Active 31 DOM
-
2026-06-16days on market $329,990 Active 30 DOM
-
2026-06-15days on market $329,990 Active 29 DOM
-
2026-06-13days on market $329,990 Active 27 DOM
-
2026-06-13days on market $329,990 Active 26 DOM
-
2026-06-09days on market $329,990 Active 23 DOM
-
2026-06-08days on market $329,990 Active 22 DOM
-
2026-06-07days on market $329,990 Active 21 DOM
-
2026-06-04days on market $329,990 Active 18 DOM
-
2026-06-03days on market $329,990 Active 17 DOM
-
2026-06-02days on market $329,990 Active 16 DOM
-
2026-06-01days on market $329,990 Active 15 DOM
-
2026-05-31days on market $329,990 Active 14 DOM
-
2026-05-21price $329,990
-
2026-05-17$331,165 Active
ⓘ Source: listings_history table (triggers on properties + properties_extension) + one-shot
backfill from property_details.listing_events for pre-trigger history.
Nearby sold comps map
Loading sold comps map…
Walkable amenities ~0.75 mi
Loading nearby amenities…
Taxation est. · year 1
- Rental income
- $30,619
- − Mortgage interest
- −$17,084
- − Property taxes
- −$4,575
- − Insurance
- −$1,525
- − Repairs & maintenance
- −$2,450
- − Management
- −$2,450
- − HOA
- −$108
- − Depreciation
- −$8,872
- Taxable loss
- −$6,445
- Est. tax savings @ 24.0%
- +$1,547
- After-tax cash flow
- $335/yr
For passive investors: Depreciation is non-cash, so a rental often shows a tax loss while cash-flowing — sheltering income. Rental losses are passive: they offset passive income freely, and up to $25,000/yr can offset ordinary (W-2) income if you actively participate and your MAGI is under $100k (phasing out to $0 by $150k); unused losses carry forward. On sale, claimed depreciation is recaptured at up to 25%, and gains may owe capital-gains tax (a 1031 exchange can defer both). Figures are a year-1 estimate at your 24.0% rate — not tax advice; consult a CPA.
Condition & rehab AI · 30 photos
This home is in excellent condition with a modern and well-maintained interior and exterior. It is move-in ready and has the potential for further value increases through minor upgrades and improvements.
Value-add opportunities
- Both Painting the exterior and interior walls — Fresh paint can enhance the curb appeal and interior aesthetics.
- Both Landscaping improvements — Enhanced landscaping can improve curb appeal and attract more potential buyers/tenants.
- Resale Upgrading the kitchen appliances — Modern appliances can increase the home's appeal to potential buyers.
- Both Adding smart home features — Smart home features can increase convenience and appeal to both buyers and tenants.
- Both Upgrading the flooring — Upgrading to higher-end flooring can increase the home's value and appeal to potential buyers/tenants.
Renovation cost estimate screening
Value-add ROI direction
- Both Painting the exterior and interior walls — Fresh paint can enhance the curb appeal and interior aesthetics. ↑
- Both Landscaping improvements — Enhanced landscaping can improve curb appeal and attract more potential buyers/tenants. ↑
- Resale Upgrading the kitchen appliances — Modern appliances can increase the home's appeal to potential buyers. ↑
- Both Adding smart home features — Smart home features can increase convenience and appeal to both buyers and tenants. ↑
- Both Upgrading the flooring — Upgrading to higher-end flooring can increase the home's value and appeal to potential buyers/tenants. ↑
ⓘ Cost ranges are severity-bucket heuristics (US national rule-of-thumb). Get contractor quotes + a written scope before underwriting a rehab budget.
Schools (NCES district)
- District
- Hillsborough
- NCES district ID
- 1200870
- Math proficiency
- 47% ▼ -8.00%
- Reading proficiency
- 50% ▼ -4.00%
- Median HH income
- $50,622
- Composite
- 41.6/100
- National rank
- #3435
- State rank
- #41 of 73 in FL
Livability — Plant City
- Score
- 76/100
- State rank
- #227
- US rank
- #3587
Category grades
Schools grade is shown separately in the Schools card above.
Census & demographics
- Census place
- Plant City, FL
- County
- Hillsborough County · 1,540,968 people
- City population
- 68,525
- Metro
- Tampa-St. Petersburg-Clearwater, FL
- Population (ZIP)
- 18,108
- Household income
- $73,414
- Rent vs Own
- Severe rent burden
- 152.0
Population outlook (Hillsborough County) Hauer SSP2
- Today (2025)
- 1,607,022 people
- By 2030
- 1,733,968 · +7.9%
- By 2040
- 1,979,565 · +23.2%
- By 2050
- 2,203,427 · +37.1%
- By 2075
- 2,667,893 · +66.0%
- By 2100
- 2,891,558 · +79.9%
Race, ethnicity, and origin ACS 2023
- Neighborhood character
- Predominantly White (71%)
- Race & ethnicity
- White 71% Hispanic / Latino 23% Two or more races 14% Black 2% Native American 1%
- Hispanic origin (detail)
- Mexican 16% Puerto Rican 2% Cuban 1%
- Common ancestry
- Romanian 2% Slovak 1% Iranian 1%
- Foreign-born
- 10% · Canada, Jamaica
- Languages at home
- 80% English-only · Spanish 19%
Political lean MEDSL · Hillsborough
- 2024 margin
- Toss-up / Even · D 47.8% · R 50.9% · Other 1.3%
- 2008→2024 swing
- -10.2pp toward R · 2008: 7.1pp · 2024: -3.1pp
- All cycles
- 2024: R+3.1 2020: D+6.9 2016: D+6.8 2012: D+6.7 2008: D+7.1
Not yet ingested
- Civics
- —
Market trends
- HPI YoY
- ▼ -114.17%
- Current HPI
- 347.2475
- Rent YoY
- —
- Metro
- Tampa-St. Petersburg-Clearwater, FL
- State GDP YoY
- ▲ 3.28%
- F500 in state
- 36
Industry mix (Fortune 500 HQ in FL)
| Industry | F500 HQs | Revenue |
|---|---|---|
| Industrial Technology | 2 | $29B |
|
||
| Insurance | 2 | $17B |
|
||
| Retail | 1 | $60B |
|
||
| Technology Distribution | 1 | $58B |
|
||
| Homebuilding | 1 | $35B |
|
||
| Technology Manufacturing | 1 | $35B |
|
||
Price history
-0.4% since first listed2 events — show timeline
- 2026-05-21 Price Changed $329,990 Stellar MLS as Distributed by MLS Grid
- 2026-05-17 Listed $331,165 Stellar MLS as Distributed by MLS Grid
Cash-flow waterfall
monthlySold comps — $/sqft
last 12 mo · ≤1 miLoading sold comps…