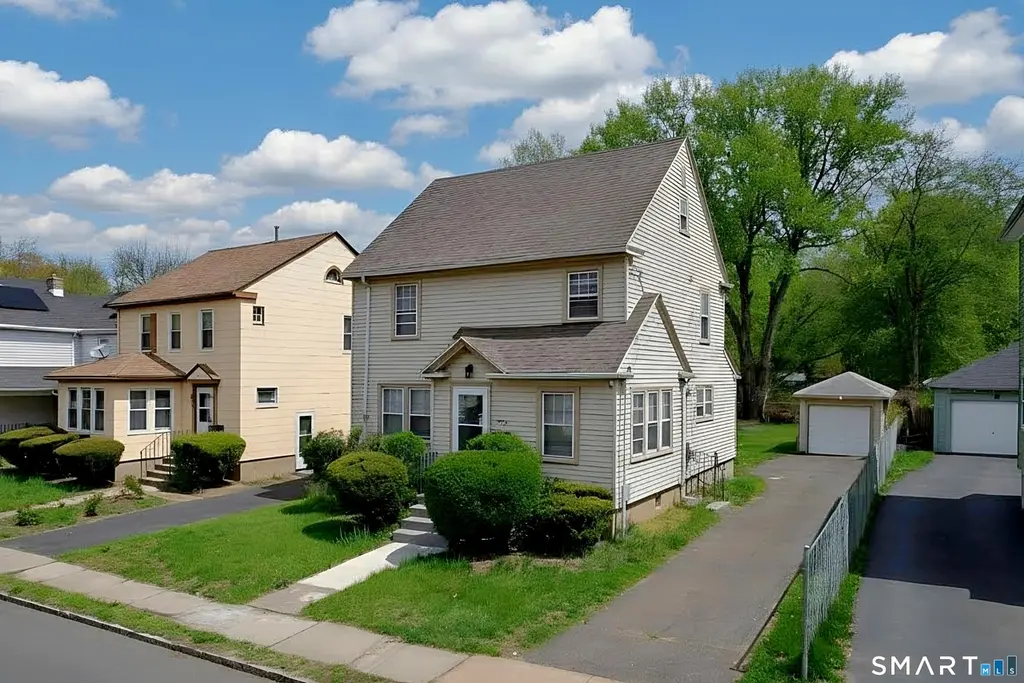
322 Hillside Ave · Hartford, CT
Flood risk 1/10 · Minimal
- FEMA flood zone
- X (unshaded)
- Chance of flooding over 30 yrs
- 0.0%
- Est. flood insurance / yr
- $473 – $860
Fire risk 1/10 · Minimal
- Est. fire insurance / yr
- $829 – $1,539
Heat risk 5/10 · Moderate
- Hot days now (above 97°F)
- 7 days/yr
- Hot days in 30 yrs
- 16 days/yr
Wind risk 6/10 · Moderate
- Chance of severe wind over 30 yrs
- 27.0%
Air-quality risk 3/10 · Minor
- Unhealthy air days now
- 3 days/yr
- Unhealthy air days in 30 yrs
- 4 days/yr
Risk factors via First Street. Map © Google.
Why this score? — see what drove the D grade
The composite is a weighted blend of 9 inputs, each scored 0–100. Each bar is that input's sub-score; the figure is the points it added to the 100-point composite (weight × sub-score).
- ARV discount +10.6/15.0
- Cash flow +9.0/30.0
- Appreciation +5.7/10.0
- Livability +3.8/5.0
- Rent growth +3.1/5.0
- 1% rule +2.7/10.0
- DSCR +2.5/10.0
- Condition / age +2.5/5.0
- Schools +1.4/10.0
$289,900
🖨 Deal sheet (PDF) 📄 Offer letter ✓ Due diligence
Listing remarks
Well-maintained and thoughtfully cared-for home, proudly owned by the same owners for over 30 years. Recent updates include a boiler conversion to natural gas, offering improved efficiency and convenience, as well as a newer asphalt roof less than two years old. The home features generously sized rooms throughout and a clean, dry basement with excellent potential to be finished for additional living space.
Key facts
- Newer asphalt roof
- Clean dry basement
- 6,534 sq ft lot
Tags
Property features AI
Exterior
- Parking: Detached garage; Private paved asphalt driveway; Off-street parking; Driveway parking; 2 total parking spaces; 1 garage space
- Utilities: Public water connected; Public sewer connected; Natural gas service; Storm windows; Thermopane windows
- Home design: Single-family home; Frame construction; Beige exterior; Asphalt shingle roof
- Construction: Concrete foundation; Vinyl siding
- Exterior features: Sidewalk; Garden area; Open lot
Interior
- Kitchen: Range hood
- Bedrooms: 3 bedrooms
- Bathrooms: 1 full bath; 1 half bath
- Heating & cooling: Hot water/radiator heating; Natural gas hot water
- Interior features: Cable available; Full basement with interior access and concrete floor; Attic accessible via hatch
- Laundry & utility: Washer included; Laundry room on lower level
Neighborhood map
What this means for you Summary
Snapshot
- This is a 3-bed/1.5-bath single-family listed at $290k.
Deal economics
- At list price, monthly cash flow is $-228 ($-3k/yr) — negative.
- To cash-flow at today's rent, offer at most $250k (13.9% below list).
- To meet the 1% rule (rent ≥ 1% of price), the offer needs to be $224k (22.9% below list).
- Recommended offer: $224k (22.9% below list) — sets the bar for 1% rule.
Location & tenants
- Location reads 76/100 on livability (#58 in CT, #3,553 nationally) — a middle-class / working-renter tenant base. Strengths: amenities A+, commute A+, health & safety A+; Watch: schools D-, crime F, employment F.
- Hartford School District (urban): math 13% / reading 21% proficiency, ranked #150 of 153 in CT (top 98%) — low school quality limits family demand, transient renter base, plan for 1-2y turnover; 84% free/reduced lunch — lower-income household profile, screen leases tightly.
- Market conditions: Rents rising (+2.4%/yr); 62 active listings in the ZIP; 13 comparable units currently listed for rent nearby; rentals leasing fast (median 5d on market — plan ~1-2 weeks tenant-placement turnaround); 1,867 units permitted in Capitol Planning Region in 2024 (1,399 in 5+ unit buildings).
- At $2,235/mo this rent would consume 58% of the median local household income ($46k/yr) (locally 3400% of renters already pay >50% of income on rent) — very limited rent-growth headroom before tenants either downsize or default.
Forward outlook
- In year one you build about $6k of equity ($2k loan paydown + $4k appreciation (1.4% local appreciation)).
- By year 6, paydown + projected appreciation supports a ~$33k cash-out refi (75% LTV) — recoverable capital for the next deal without selling this one.
Negotiation context
- It's been on market 50 days — a 3% lower offer ($281k) is reasonable based on typical stale-listing flexibility.
- 2 sale attempts with the ask held roughly flat each time — persistent listings suggest the price (not the market) is what's stuck; bring a comps-based counter.
- Current owner paid $70k; list at $290k implies a 314% gain — meaningful room to come down on a strong offer.
Risks & watch-outs
- Watch-outs: built in 1927 — expect roof / HVAC / electrical / plumbing capex.
- Climate carrying-cost: major wind risk, 27% chance of damaging wind over 30y; extreme-heat days projected 7→16/yr by 2055 (HVAC capex compounding) — expect insurance premiums to compound above CPI over the hold.
Questions for the listing agent
- What do current leases actually rent for vs. the listed asking? Can we see a recent rent roll and the last 12 months of T-12 income?
- It's been on market 50 days. Have you received any prior offers? Is the seller open to a 23% concession, seller financing, or rate buy-down credit?
- Built in 1927 — when were the roof, HVAC, electrical panel, plumbing, and water heater last replaced?
- Is there a deadline driving the sale (1031 exchange, divorce, estate, relocation)? That informs how much negotiation room exists.
- Schools are D-rated, which usually means shorter tenancies and higher turnover. Who's the typical renter profile here, and what's been the actual vacancy rate?
- Crime grade is F in this area — have there been break-ins, vandalism, or insurance claims at this property in the last 3 years? What carrier currently insures it and at what premium?
- The area grade is low — what's the realistic commute time and amenity access for the typical tenant pool here? Any planned neighborhood developments (good or bad) we should know about?
- What's the average days-on-market for RENTAL listings here right now (not sales)? A rising rental-DOM trend means longer vacancies and softer asking-rent achievability than the comps imply.
- What's the recent tenant-quality profile in this submarket — average credit score on applications, eviction rate, late-payment / NSF rate, and stable-employment percentage? A property-management company in the area should have these aggregated.
- How much new for-sale + rental construction is in the pipeline within 1–3 miles? Heavy new supply typically softens prices + rents 12–24 months out; constrained supply supports both.
Investment metrics
- 1% rule
- 0.77% ✗
- Cap rate
- 5.35%
- Cash-on-cash
- -3.38%
- DSCR
- 0.85
- GRM
- 10.8
CMA / ARV
- ARV (median comp)
- $311,670
- List price
- $289,900
- Delta
- -6.98%
- Verdict
- FAIR
- Comps
- 20 within 2.0 mi
Projected returns pro-forma
1.38% appreciation · 2.37% rent growth · sell at horizon
- IRR
- -1.2%
- Equity multiple
- 0.94×
- Total profit
- $-5,140
- Equity at exit
- $104,670
- IRR
- 3.2%
- Equity multiple
- 1.40×
- Total profit
- $32,353
- Equity at exit
- $143,619
Cash invested: $81,172 (down + closing). Projections, not guarantees.
Landlord ↔ Tenant lean methodology
- Overall (STATE)
- 27 Tenant-Leaning
- State Connecticut
- 27 Tenant-Leaning · D+7
- County
- — inherits STATE
- City
- — inherits STATE
ZIP-level market 06106
- Home prices YoY
- 0.4%
- Rents YoY
- 2.4%
- Active inventory
- 62
- Price-to-rent
- 10.8×
Monthly cashflow live
- Estimated rent
- $2,235 high interval (Pro) →
- Mortgage (P&I)
- −$1,520
- Tax from tax record
- −$353 /mo · $4,239/yr
- Insurance
- −$121
- HOA
- −$0
- Vacancy / Maint / Mgmt
- −$469
- Net cashflow
- $-228
Break-even live
Sensitivity live
| Price | -10% $-64 | -5% $-146 | +0% $-228 | +5% $-310 | +10% $-392 |
|---|---|---|---|---|---|
| Rent | -10% $-405 | -5% $-317 | +0% $-228 | +5% $-140 | +10% $-52 |
| Rate | -1.0pp $-82 | -0.5pp $-155 | base $-228 | +0.5pp $-303 | +1.0pp $-380 |
UW: 25.0% down · 7.5% · 30yr · 1.5% tax · 5.0% vac · 8.0% maint · 8.0% mgmt
Financing live
Cash to close
- Down payment
- $72,475
- Closing costs
- $8,697
- Reserves months
- —
- Total cash needed
- —
Loan-product check · same deal, 3 products live
Conventional
25% down · 7.5% · 30yr
- Down + closing
- —
- Monthly P&I
- —
- Monthly cashflow
- —
- DSCR
- —
- Eligible?
- —
Personal DTI + credit; lowest rate.
DSCR
20% down · 8.5% · 30yr
- Down + closing
- —
- Monthly P&I
- —
- Monthly cashflow
- —
- DSCR
- —
- Eligible?
- —
No personal income docs; deal must DSCR.
Hard money
10% down · 12.0% · 12mo
- Down + closing
- —
- Monthly P&I
- —
- Monthly cashflow
- —
- DSCR
- —
- Eligible?
- —
Short-term bridge; refi at stabilization.
Rent comps 13 comps
| Address | Beds | Baths | Sqft | Rent | $/sqft | DOM | Units | Dist |
|---|---|---|---|---|---|---|---|---|
| 452 Hillside Ave Hartford, CT | 4.0 | 1.0 | 1233 | $2,700 | $2.19 | 24d | 1 | 0.32mi |
| 3 Goshen St Hartford, CT | 3.0 | 1.0 | 1168 | $2,100 | $1.80 | 2d | 1 | 1.01mi |
| 109 Caya Ave West Hartford, CT | 2.0 | 1.5 | 1078 | $2,600 | $2.41 | 4d | 1 | 1.22mi |
| 100 Kane St Unit D11 West Hartford, CT | 2.0 | 2.0 | 1182 | $2,100 | $1.78 | 44d | 1 | 1.27mi |
| 167 Seymour St Hartford, CT | 3.0–4.0 | 1.0 | 1000 | $2,025 | $2.02 | 24d | 3 | 1.29mi |
| 158 Seymour St Hartford, CT | 3.0 | 1.0 | 1114 | $2,025 | $1.82 | 24d | 2 | 1.30mi |
| 106 Kane St West Hartford, CT | 1.0–2.0 | 1.0–2.0 | 966 | $2,300 | $2.38 | 4d | 18 | 1.31mi |
| 140 Kane St Unit C1 West Hartford, CT | 2.0 | 2.0 | 1062 | $1,900 | $1.79 | 4d | 1 | 1.31mi |
| 1 Park Rd West Hartford, CT | 2.0 | 1.0–2.0 | 913 | $3,647 | $3.99 | 4d | 18 | 1.32mi |
| 21 Gillette St West Hartford, CT | 3.0 | 1.0 | 1400 | $2,500 | $1.79 | 4d | 1 | 1.40mi |
| 57 Park St Hartford, CT | 3.0 | 1.0 | 915 | $1,900 | $2.08 | 2d | 2 | 1.46mi |
| 29 Crosby St West Hartford, CT | 2.0 | 1.0 | 1100 | $1,950 | $1.77 | 44d | 1 | 1.49mi |
| 19 Thomas St Unit 23 West Hartford, CT | 2.0 | 1.0 | 1252 | $2,100 | $1.68 | 12d | 1 | 1.50mi |
Listing history 18 events
-
2026-06-18days on market $289,900 Active 50 DOM
-
2026-06-17days on market $289,900 Active 49 DOM
-
2026-06-16days on market $289,900 Active 48 DOM
-
2026-06-15days on market $289,900 Active 47 DOM
-
2026-06-13days on market $289,900 Active 45 DOM
-
2026-06-13days on market $289,900 Active 44 DOM
-
2026-06-10days on market $289,900 Active 42 DOM
-
2026-06-09days on market $289,900 Active 41 DOM
-
2026-06-08days on market $289,900 Active 40 DOM
-
2026-06-07days on market $289,900 Active 39 DOM
-
2026-06-05statusdays on market $289,900 Active 36 DOM
-
2026-06-03days on market $289,900 Under Contract - Continue to Show 35 DOM
-
2026-06-02days on market $289,900 Under Contract - Continue to Show 34 DOM
-
2026-06-01days on market $289,900 Under Contract - Continue to Show 33 DOM
-
2026-05-31days on market $289,900 Under Contract - Continue to Show 32 DOM
-
2026-05-11price $289,900 409-char remark
-
2026-04-29$299,900 Active 409-char remark
-
1993-09-01soldstatus $70,000
ⓘ Source: listings_history table (triggers on properties + properties_extension) + one-shot
backfill from property_details.listing_events for pre-trigger history.
Tax reassessment forecast CT · Partial reset (capped growth)
- Current annual tax
- $4,239 · $353/mo
- Projected year-2 tax
- $5,221 · $435/mo
- Expected delta
- +$982/yr (+$82/mo · 23.2%)
ⓘ Screening estimate from a state-policy table — verify with the county assessor before closing.
Climate risk First Street
- Flood 1/10 Low FEMA zone X (unshaded) · 0% chance over 30 yrs
- Wildfire 1/10 Low
- Heat 5/10 Major 7 d/yr ≥97°F today · 16 d/yr by 30 yrs out
- Wind 6/10 Major 27% chance of damaging wind over 30 yrs
- Air quality 3/10 Moderate 3 unhealthy d/yr today · 4 by 30 yrs out
Nearby sold comps map
Loading sold comps map…
Walkable amenities ~0.75 mi
Loading nearby amenities…
Taxation est. · year 1
- Rental income
- $26,825
- − Mortgage interest
- −$16,239
- − Property taxes
- −$4,239
- − Insurance
- −$1,450
- − Repairs & maintenance
- −$2,146
- − Management
- −$2,146
- − Depreciation
- −$8,433
- Taxable loss
- −$7,828
- Est. tax savings @ 24.0%
- +$1,879
- After-tax cash flow
- $-861/yr
For passive investors: Depreciation is non-cash, so a rental often shows a tax loss while cash-flowing — sheltering income. Rental losses are passive: they offset passive income freely, and up to $25,000/yr can offset ordinary (W-2) income if you actively participate and your MAGI is under $100k (phasing out to $0 by $150k); unused losses carry forward. On sale, claimed depreciation is recaptured at up to 25%, and gains may owe capital-gains tax (a 1031 exchange can defer both). Figures are a year-1 estimate at your 24.0% rate — not tax advice; consult a CPA.
Schools (NCES district)
- District
- Hartford School District
- NCES district ID
- 0901920
- Math proficiency
- 13% ▼ -5.00%
- Reading proficiency
- 21% ▼ -6.00%
- Median HH income
- $30,521
- Composite
- 13.54/100
- National rank
- #9514
- State rank
- #150 of 153 in CT
Livability — Hartford
- Score
- 76/100
- State rank
- #58
- US rank
- #3553
Category grades
Schools grade is shown separately in the Schools card above.
Census & demographics
- Census place
- Hartford, CT
- County
- Hartford County · 754,208 people
- City population
- 121,162
- Metro
- Hartford-East Hartford-Middletown, CT
- Population (ZIP)
- 36,322
- Household income
- $46,304
- Rent vs Own
- Severe rent burden
- 3400.0
Population outlook (Capitol County) Hauer SSP2
- By 2040
- 1,063,519
Race, ethnicity, and origin ACS 2023
- Neighborhood character
- Diverse neighborhood (Simpson 0.58)
- Race & ethnicity
- Hispanic / Latino 60% Two or more races 25% Black 18% White 15% Asian 3%
- Hispanic origin (detail)
- Mexican 2% Puerto Rican 42% Dominican 6%
- Common ancestry
- Lithuanian 2% Russian 1% Romanian 1%
- Foreign-born
- 20% · Canada, Jamaica, China
- Languages at home
- 46% English-only · Spanish 47% Other Indo-European 3% Other Asian/Pacific 1%
Political lean MEDSL · Capitol
- 2024 margin
- Strong D (+21.9) · D 60.1% · R 38.2% · Other 1.7%
- All cycles
- 2024: D+21.9
Not yet ingested
- Civics
- —
Market trends
- HPI YoY
- ▲ 1.38%
- Current HPI
- 314.0899
- Rent YoY
- ▲ 2.37%
- Metro
- Hartford-East Hartford-Middletown, CT
- State GDP YoY
- ▲ 1.06%
- F500 in state
- 38
Industry mix (Fortune 500 HQ in CT)
| Industry | F500 HQs | Revenue |
|---|---|---|
| Industrial Machinery | 4 | $38B |
|
||
| Insurance | 3 | $71B |
|
||
| Financial Services | 2 | $25B |
|
||
| Transportation / Logistics | 2 | $18B |
|
||
| Healthcare | 1 | $247B |
|
||
| Telecommunications | 1 | $55B |
|
||
Price history
+314.1% since first listed5 events — show timeline
- 2026-06-04 Relisted — Smart MLS
- 2026-05-30 Contingent — Smart MLS
- 2026-05-11 Price Changed $289,900 Smart MLS
- 2026-04-29 Listed $299,900 Smart MLS
- 1993-09-01 Sold (Public Records) $70,000 Public Records
Property tax history
+2.8%/yrLatest (2025): $4,239 · +0.0% YoY. Source: county tax records.
Cash-flow waterfall
monthlySold comps — $/sqft
last 12 mo · ≤1 miLoading sold comps…