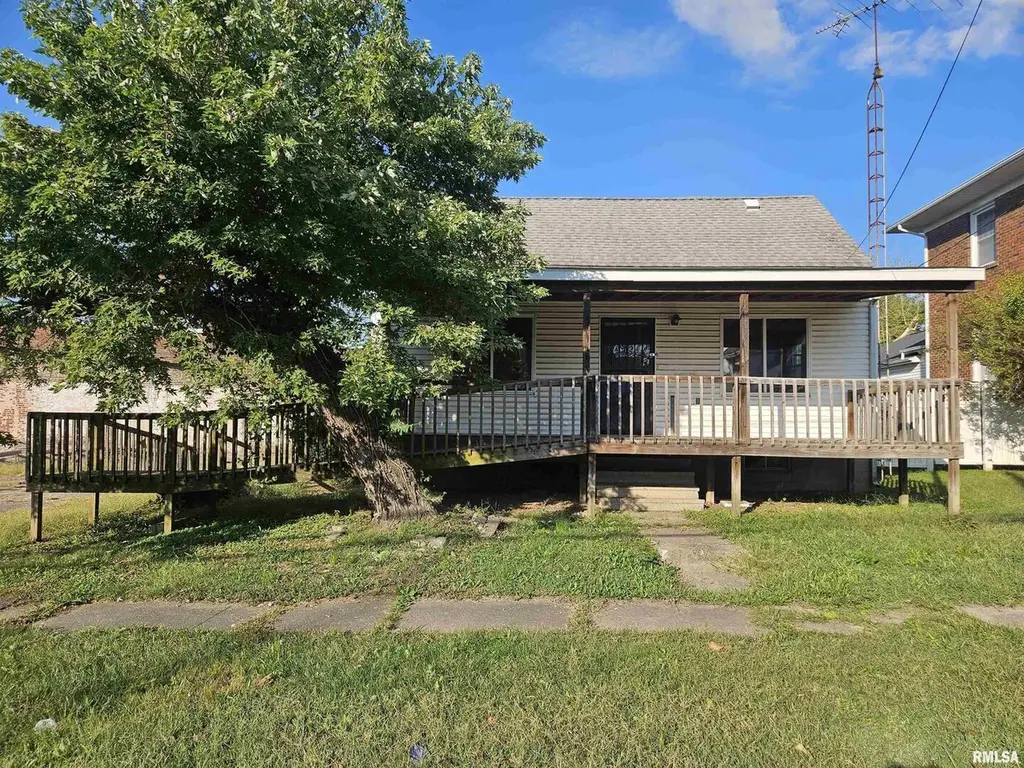
1105 Organ St · Eldorado, IL
Flood risk 1/10 · Minimal
- FEMA flood zone
- X (unshaded)
- Chance of flooding over 30 yrs
- 0.0%
- Est. flood insurance / yr
- $473 – $860
Fire risk 1/10 · Minimal
- Est. fire insurance / yr
- $804 – $1,492
Heat risk 5/10 · Moderate
- Hot days now (above 108°F)
- 7 days/yr
- Hot days in 30 yrs
- 21 days/yr
Wind risk 2/10 · Minimal
- Chance of severe wind over 30 yrs
- 3.0%
Air-quality risk 2/10 · Minimal
- Unhealthy air days now
- 0 days/yr
- Unhealthy air days in 30 yrs
- 1 days/yr
Risk factors via First Street. Map © Google.
Why this score? — see what drove the D grade
The composite is a weighted blend of 9 inputs, each scored 0–100. Each bar is that input's sub-score; the figure is the points it added to the 100-point composite (weight × sub-score).
- Cash flow +15.0/30.0
- ARV discount +7.5/15.0
- 1% rule +5.0/10.0
- DSCR +5.0/10.0
- Livability +3.2/5.0
- Rent growth +2.5/5.0
- Condition / age +2.5/5.0
- Schools +1.2/10.0
- Appreciation +0.0/10.0
$14,900
🖨 Deal sheet (PDF) 📄 Offer letter ✓ Due diligence
Listing remarks
Cozy 2 bedroom, 1 bath home with vinyl siding! This home has a large enclosed front porch and lots of storage in the kitchen. This property is now active in an online auction. All offers must be submitted through the property's listing page on auction.com. The sale will be subject to a 5 per cent buyer's premium pursuant to the Auction Terms and Conditions (minimums may apply). All auction bids will be processed subject to seller approval.
Key facts
- Vinyl siding
- Built 1920
- Listed 171 days
Tags
Neighborhood map
What this means for you Summary
Snapshot
- This is a 2-bed/1.0-bath other listed at $15k.
Deal economics
- At list price, monthly cash flow is $936 ($11k/yr) — positive.
- The deal already cash-flows at list — no discount required.
- Meets the 1% rule at list price ($1k rent vs $15k).
- Recommended offer: $13k (12.0% below list) — sets the bar for market timing.
- Cap rate 81.7% vs local median 9.5% in Eldorado — top-decile yield for the area; either an underpriced asset or a hidden risk that comps aren't pricing in. Stress-test before assuming the spread holds.
Location & tenants
- Location reads 65/100 on livability (#658 in IL) — a middle-class / working-renter tenant base. Strengths: cost of living A+, health & safety A+, housing B+; Watch: crime D-, amenities F, commute F.
- Eldorado CUSD 4 (town): math 11% / reading 19% proficiency, ranked #526 of 620 in IL (top 85%) — low school quality limits family demand, transient renter base, plan for 1-2y turnover.
- Zoned schools: Eldorado Elem School (math 8% / reading 7%, grade F, #1,627 of 2,056 statewide, top 81%, 545 students, 0% FRL); Eldorado Middle School (math 17% / reading 32%, grade F, #332 of 665 statewide, top 55%, 231 students, 0% FRL); Eldorado High School (math 8% / reading 17%, grade F, #506 of 693 statewide, top 74%, 301 students, 0% FRL) — zoned schools average 0% FRL vs 54% district-wide (54 pts lower); this property's tenant base skews higher-income than the district average.
- Market conditions: 45 active listings in the ZIP.
Forward outlook
- Local home prices are declining (-3.0%/yr); year-one equity from $103 of loan paydown is wiped out by about $447 of value loss. Plan a longer hold.
- Saline County population projected at -16% by 2050 — secular population decline; favor cash flow + early exit over multi-decade hold.
- At projected returns (-3.0% appreciation + 3.0% rent growth), your $4k cash investment doubles in ~1 year — after that, you're playing with house money.
Negotiation context
- It's been on market 171 days — a 12% lower offer ($13k) is reasonable based on typical stale-listing flexibility.
Risks & watch-outs
- Watch-outs: built in 1920 — expect roof / HVAC / electrical / plumbing capex.
- Climate carrying-cost: extreme-heat days projected 7→21/yr by 2055 (HVAC capex compounding) — expect insurance premiums to compound above CPI over the hold.
Questions for the listing agent
- It's been on market 171 days. Have you received any prior offers? Is the seller open to a 12% concession, seller financing, or rate buy-down credit?
- Built in 1920 — when were the roof, HVAC, electrical panel, plumbing, and water heater last replaced?
- Why hasn't it sold? Are there any deal-killer items the seller is aware of (foundation, flood, title, zoning, code violations)?
- Is there a deadline driving the sale (1031 exchange, divorce, estate, relocation)? That informs how much negotiation room exists.
- Schools are F-rated, which usually means shorter tenancies and higher turnover. Who's the typical renter profile here, and what's been the actual vacancy rate?
- Crime grade is D in this area — have there been break-ins, vandalism, or insurance claims at this property in the last 3 years? What carrier currently insures it and at what premium?
- The area grade is low — what's the realistic commute time and amenity access for the typical tenant pool here? Any planned neighborhood developments (good or bad) we should know about?
- What's the average days-on-market for RENTAL listings here right now (not sales)? A rising rental-DOM trend means longer vacancies and softer asking-rent achievability than the comps imply.
- What's the recent tenant-quality profile in this submarket — average credit score on applications, eviction rate, late-payment / NSF rate, and stable-employment percentage? A property-management company in the area should have these aggregated.
- How much new for-sale + rental construction is in the pipeline within 1–3 miles? Heavy new supply typically softens prices + rents 12–24 months out; constrained supply supports both.
Investment metrics
- 1% rule
- 8.83% ✓
- Cap rate
- 81.71%
- Cash-on-cash
- 269.33%
- DSCR
- 12.98
- GRM
- 0.9
CMA / ARV
- ARV (median comp)
- $43,422
- List price
- $14,900
- Delta
- -65.69%
- Verdict
- UNDERPRICED
- Comps
- 20 within 1.0 mi
Projected returns pro-forma
-3.0% appreciation · 3.0% rent growth · sell at horizon
- IRR
- —
- Equity multiple
- 14.72×
- Total profit
- $57,244
- Equity at exit
- $2,222
- IRR
- —
- Equity multiple
- 31.37×
- Total profit
- $126,721
- Equity at exit
- $1,288
Cash invested: $4,172 (down + closing). Projections, not guarantees.
Landlord ↔ Tenant lean methodology
- Overall (STATE)
- 43 Moderately Tenant-Leaning
- State Illinois
- 43 Moderately Tenant-Leaning · D+7
- County
- — inherits STATE
- City
- — inherits STATE
ZIP-level market 62930
- Active inventory
- 45
- Price-to-rent
- 0.9×
Monthly cashflow live
- Estimated rent
- $1,316 medium interval (Pro) →
- Mortgage (P&I)
- −$78
- Tax est. 1.5%
- −$19 /mo · $224/yr
- Insurance
- −$6
- HOA
- −$0
- Vacancy / Maint / Mgmt
- −$276
- Net cashflow
- $936
Break-even live
Sensitivity live
| Price | -10% $947 | -5% $942 | +0% $936 | +5% $931 | +10% $926 |
|---|---|---|---|---|---|
| Rent | -10% $832 | -5% $884 | +0% $936 | +5% $988 | +10% $1,040 |
| Rate | -1.0pp $944 | -0.5pp $940 | base $936 | +0.5pp $933 | +1.0pp $929 |
UW: 25.0% down · 7.5% · 30yr · 1.5% tax · 5.0% vac · 8.0% maint · 8.0% mgmt
Financing live
Cash to close
- Down payment
- $3,725
- Closing costs
- $447
- Reserves months
- —
- Total cash needed
- —
Loan-product check · same deal, 3 products live
Conventional
25% down · 7.5% · 30yr
- Down + closing
- —
- Monthly P&I
- —
- Monthly cashflow
- —
- DSCR
- —
- Eligible?
- —
Personal DTI + credit; lowest rate.
DSCR
20% down · 8.5% · 30yr
- Down + closing
- —
- Monthly P&I
- —
- Monthly cashflow
- —
- DSCR
- —
- Eligible?
- —
No personal income docs; deal must DSCR.
Hard money
10% down · 12.0% · 12mo
- Down + closing
- —
- Monthly P&I
- —
- Monthly cashflow
- —
- DSCR
- —
- Eligible?
- —
Short-term bridge; refi at stabilization.
Listing history 24 events
-
2026-06-12statusdays on market $14,900 Pending 171 DOM
-
2026-06-09pricedays on market $14,900 Active 170 DOM
-
2026-06-08days on market $19,900 Active 169 DOM
-
2026-06-07days on market $19,900 Active 168 DOM
-
2026-06-07days on market $19,900 Active 167 DOM
-
2026-06-04days on market $19,900 Active 164 DOM
-
2026-06-02days on market $19,900 Active 163 DOM
-
2026-06-01days on market $19,900 Active 162 DOM
-
2026-05-31days on market $19,900 Active 161 DOM
-
2026-05-31days on market $19,900 Active 160 DOM
-
2026-02-10price $19,900
-
2026-01-30status Active
-
2026-01-29historical
-
2026-01-08price $24,900
-
2026-01-07status Active
-
2026-01-07historical
-
2026-01-06status Active
-
2026-01-06historical
-
2026-01-05historical
-
2025-12-30status Active
-
2025-12-29historical
-
2025-12-05price
-
2025-11-04price
-
2025-09-30Active
ⓘ Source: listings_history table (triggers on properties + properties_extension) + one-shot
backfill from property_details.listing_events for pre-trigger history.
Climate risk First Street
- Flood 1/10 Low FEMA zone X (unshaded) · 0% chance over 30 yrs
- Wildfire 1/10 Low
- Heat 5/10 Major 7 d/yr ≥108°F today · 21 d/yr by 30 yrs out
- Wind 2/10 Low 3% chance of damaging wind over 30 yrs
- Air quality 2/10 Low 0 unhealthy d/yr today · 1 by 30 yrs out
Nearby sold comps map
Loading sold comps map…
Walkable amenities ~0.75 mi
Loading nearby amenities…
Taxation est. · year 1
- Rental income
- $15,788
- − Mortgage interest
- −$835
- − Property taxes
- −$224
- − Insurance
- −$74
- − Repairs & maintenance
- −$1,263
- − Management
- −$1,263
- − Depreciation
- −$433
- Taxable income
- $11,695
- Est. tax owed @ 24.0%
- −$2,807
- After-tax cash flow
- $8,430/yr
For passive investors: Depreciation is non-cash, so a rental often shows a tax loss while cash-flowing — sheltering income. Rental losses are passive: they offset passive income freely, and up to $25,000/yr can offset ordinary (W-2) income if you actively participate and your MAGI is under $100k (phasing out to $0 by $150k); unused losses carry forward. On sale, claimed depreciation is recaptured at up to 25%, and gains may owe capital-gains tax (a 1031 exchange can defer both). Figures are a year-1 estimate at your 24.0% rate — not tax advice; consult a CPA.
Schools (NCES district)
- District
- Eldorado CUSD 4
- NCES district ID
- 1713660
- Math proficiency
- 11% ▼ -10.00%
- Reading proficiency
- 19% ▼ -11.00%
- Median HH income
- $36,707
- Composite
- 12.47/100
- National rank
- #9627
- State rank
- #526 of 620 in IL
Livability — Eldorado
- Score
- 65/100
- State rank
- #658
- US rank
- #13492
Category grades
Schools grade is shown separately in the Schools card above.
Census & demographics
- Census place
- Eldorado, IL
- Population (ZIP)
- 5,763
Population outlook (Saline County) Hauer SSP2
- Today (2025)
- 23,915 people
- By 2030
- 23,262 · -2.7%
- By 2040
- 21,775 · -8.9%
- By 2050
- 20,098 · -16.0%
- By 2075
- 15,234 · -36.3%
- By 2100
- 10,302 · -56.9%
Race, ethnicity, and origin ACS 2023
- Neighborhood character
- Predominantly White (92%)
- Race & ethnicity
- White 92% Hispanic / Latino 3% Two or more races 3% Asian 2%
- Common ancestry
- Slovak 5% Lithuanian 1% Serbian 1%
- Foreign-born
- 3% · Canada, South Korea, Vietnam
- Languages at home
- 98% English-only · Spanish 2%
Political lean MEDSL · Saline
- 2024 margin
- Solid R (+49.0) · D 24.8% · R 73.8% · Other 1.3%
- 2008→2024 swing
- -40.1pp toward R · 2008: -8.9pp · 2024: -49.0pp
- All cycles
- 2024: R+49.0 2020: R+47.9 2016: R+50.7 2012: R+29.0 2008: R+8.9
Not yet ingested
- Civics
- —
Market trends
- HPI YoY
- ▼ -81.64%
- Current HPI
- 75.0826
- Rent YoY
- —
- Metro
- —
- State GDP YoY
- ▲ 1.59%
- F500 in state
- 60
Industry mix (Fortune 500 HQ in IL)
| Industry | F500 HQs | Revenue |
|---|---|---|
| Insurance | 4 | $201B |
|
||
| Consumer Goods | 4 | $87B |
|
||
| Industrial Machinery | 3 | $64B |
|
||
| Healthcare | 2 | $55B |
|
||
| Retail / Pharmacy | 1 | $148B |
|
||
| Agriculture / Food | 1 | $86B |
|
||
Price history
-20.1% since first listed14 events — show timeline
- 2026-02-10 Price Changed $19,900 MRED as Distributed by MLS Grid
- 2026-01-30 Relisted — MRED as Distributed by MLS Grid
- 2026-01-29 Listing Removed — MRED as Distributed by MLS Grid
- 2026-01-08 Price Changed $24,900 MRED as Distributed by MLS Grid
- 2026-01-07 Relisted — MRED as Distributed by MLS Grid
- 2026-01-07 Listing Removed — MRED as Distributed by MLS Grid
- 2026-01-06 Relisted — MRED as Distributed by MLS Grid
- 2026-01-06 Listing Removed — RMLSA as Distributed by MLS Grid
- 2026-01-05 Listing Removed — MRED as Distributed by MLS Grid
- 2025-12-30 Relisted — MRED as Distributed by MLS Grid
- 2025-12-29 Listing Removed — MRED as Distributed by MLS Grid
- 2025-12-05 Price Changed — RMLSA as Distributed by MLS Grid
- 2025-11-04 Price Changed — RMLSA as Distributed by MLS Grid
- 2025-09-30 Listed — RMLSA as Distributed by MLS Grid
Property tax history
+90.2%/yrLatest (2024): $1,118 · +0.0% YoY. Source: county tax records.
Cash-flow waterfall
monthlySold comps — $/sqft
last 12 mo · ≤1 miLoading sold comps…