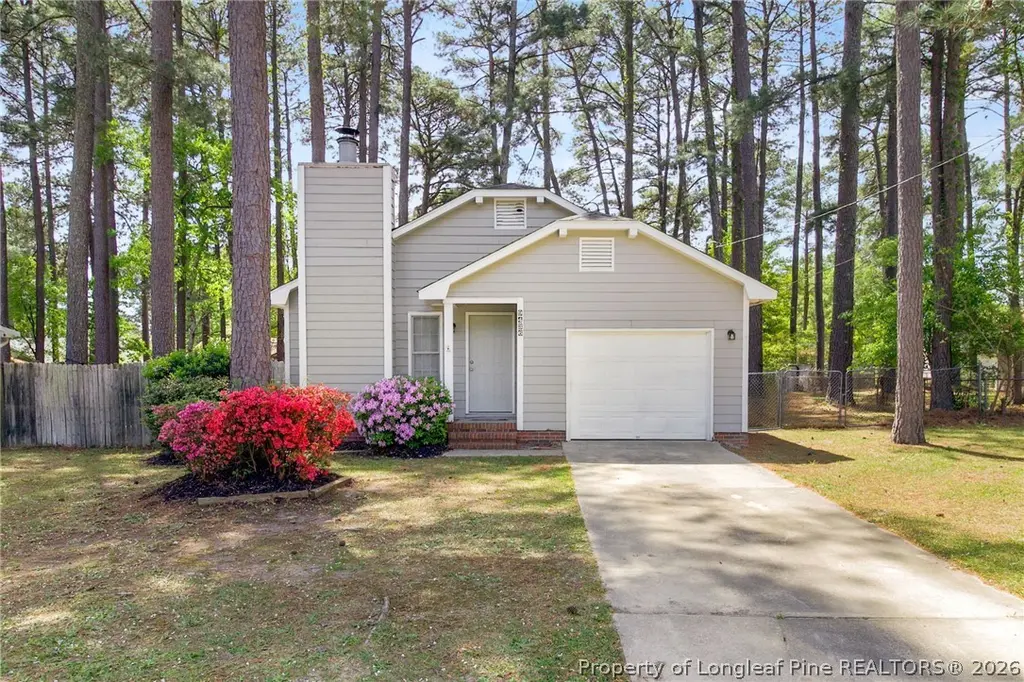
9436 Gooden Dr · Fayetteville, NC
Flood risk 1/10 · Minimal
- FEMA flood zone
- X (unshaded)
- Chance of flooding over 30 yrs
- 0.0%
- Est. flood insurance / yr
- $507 – $1,088
Fire risk 4/10 · Minor
- Est. fire insurance / yr
- $906 – $1,684
Heat risk 7/10 · Major
- Hot days now (above 106°F)
- 7 days/yr
- Hot days in 30 yrs
- 16 days/yr
Wind risk 6/10 · Moderate
- Chance of severe wind over 30 yrs
- 74.0%
Air-quality risk 1/10 · Minimal
- Unhealthy air days now
- 0 days/yr
- Unhealthy air days in 30 yrs
- 0 days/yr
Risk factors via First Street. Map © Google.
Why this score? — see what drove the D grade
The composite is a weighted blend of 9 inputs, each scored 0–100. Each bar is that input's sub-score; the figure is the points it added to the 100-point composite (weight × sub-score).
- Cash flow +13.0/30.0
- ARV discount +9.6/15.0
- DSCR +3.9/10.0
- Livability +3.8/5.0
- 1% rule +3.4/10.0
- Rent growth +3.3/5.0
- Schools +3.1/10.0
- Condition / age +2.5/5.0
- Appreciation +0.0/10.0
$189,000
🖨 Deal sheet (PDF) 📄 Offer letter ✓ Due diligence
Listing remarks
Charming home in Fayetteville with a convenient location near Fort Bragg for an easy commute! Features include updated flooring, refreshed cabinets, and a kitchen with stainless steel appliances. 2025 HVAC - Functional layout with good natural light throughout. Fenced backyard offers space for pets, outdoor use, or entertaining.
Key facts
- Refreshed cabinets
- Updated flooring
- Convenient location
Tags
Property features AI
Finance
- Other: Listing handled by Ashley Residential Group / EXP REALTY LLC
Exterior
- Parking: Attached garage (1 covered space, 1 garage space)
- Utilities: Public water; Public sewer
- Home design: Single Family Residence; One-story
- Construction: Crawl space foundation
- Exterior features: Subdivision: LAKE RIM NORTH; Zoned SF15 (Single Family Res 15)
Interior
- Kitchen: Refrigerator; Dishwasher; Microwave
- Flooring: Laminate flooring; Vinyl flooring
- Bathrooms: 1 full bathroom; 1 half bathroom
- Heating & cooling: Central air conditioning
- Interior features: Eat-in kitchen; Wood-burning fireplace; Crawl space basement
Neighborhood map
What this means for you Summary
Snapshot
- This is a 3-bed/2.0-bath single-family listed at $189k.
Deal economics
- At list price, monthly cash flow is $-10 ($-116/yr) — negative.
- To cash-flow at today's rent, offer at most $187k (0.9% below list).
- To meet the 1% rule (rent ≥ 1% of price), the offer needs to be $159k (16.0% below list).
- Recommended offer: $159k (16.0% below list) — sets the bar for 1% rule.
- Cap rate 6.2% vs local median 4.9% in Fayetteville — meaningfully above typical; check what's discounted (condition, days-on-market, listing class) to confirm the premium yield is real.
Location & tenants
- Location reads 75/100 on livability (#45 in NC, #4,031 nationally) — a middle-class / working-renter tenant base. Strengths: commute A+, cost of living A+, housing A+; Watch: crime F, employment D-.
- Cumberland County Schools (urban): math 32% / reading 41% proficiency, ranked #126 of 178 in NC (top 71%) — families likely to look elsewhere, expect single-tenant / working-renter base with shorter leases.
- Zoned schools: Lewis Chapel Middle (math 15% / reading 27%, grade F, #424 of 475 statewide, top 90%, 578 students, 100% FRL); Seventy-First High (math 45% / reading 44%, grade F, #352 of 535 statewide, top 68%, 1,366 students, 70% FRL) — zoned schools average 85% FRL vs 55% district-wide (30 pts higher); higher-poverty schools than district average — tighter screening recommended.
- Market conditions: Rents rising (+3.1%/yr); 435 active listings in the ZIP; 27 comparable units currently listed for rent nearby; rentals at typical pace (median 22d on market — plan ~3-4 weeks tenant-placement turnaround); 1,125 units permitted in Cumberland County in 2024 (104 in 5+ unit buildings).
- This rent runs 31% of the median local income ($62k/yr) — at the standard rent-burdened threshold; future hikes will face affordability resistance.
Forward outlook
- Local home prices are declining (-3.0%/yr); year-one equity from $1k of loan paydown is wiped out by about $6k of value loss. Plan a longer hold.
Negotiation context
- It's been on market 69 days — a 6% lower offer ($178k) is reasonable based on typical stale-listing flexibility.
- 3 sale attempts since 3y ago; this cycle's ask has dropped $14k (7%) from the opening price — seller is motivated, your offer sets the floor, not the list.
- Current owner paid $62k; list at $189k implies a 202% gain — meaningful room to come down on a strong offer.
Risks & watch-outs
- Climate carrying-cost: major wind risk, 74% chance of damaging wind over 30y; extreme-heat days projected 7→16/yr by 2055 (HVAC capex compounding) — expect insurance premiums to compound above CPI over the hold.
Questions for the listing agent
- What do current leases actually rent for vs. the listed asking? Can we see a recent rent roll and the last 12 months of T-12 income?
- It's been on market 69 days. Have you received any prior offers? Is the seller open to a 16% concession, seller financing, or rate buy-down credit?
- Why hasn't it sold? Are there any deal-killer items the seller is aware of (foundation, flood, title, zoning, code violations)?
- Is there a deadline driving the sale (1031 exchange, divorce, estate, relocation)? That informs how much negotiation room exists.
- Crime grade is F in this area — have there been break-ins, vandalism, or insurance claims at this property in the last 3 years? What carrier currently insures it and at what premium?
- The area grade is low — what's the realistic commute time and amenity access for the typical tenant pool here? Any planned neighborhood developments (good or bad) we should know about?
- What's the average days-on-market for RENTAL listings here right now (not sales)? A rising rental-DOM trend means longer vacancies and softer asking-rent achievability than the comps imply.
- What's the recent tenant-quality profile in this submarket — average credit score on applications, eviction rate, late-payment / NSF rate, and stable-employment percentage? A property-management company in the area should have these aggregated.
- How much new for-sale + rental construction is in the pipeline within 1–3 miles? Heavy new supply typically softens prices + rents 12–24 months out; constrained supply supports both.
Investment metrics
- 1% rule
- 0.84% ✗
- Cap rate
- 6.23%
- Cash-on-cash
- -0.22%
- DSCR
- 0.99
- GRM
- 9.9
CMA / ARV
- ARV (on-the-fly)
- $198,376
- Comps found
- 12
Show comp detail 12 sales within ~0.75 mi
| Address | Dist | Beds/Ba | Sqft | Sold | Price | $/sf | Match |
|---|---|---|---|---|---|---|---|
| 9558 Holbrook Ln | 0.03mi | 3/2.0 | 1,119 (+2%) | 5mo | $208,000 | $186 | 91 |
| 9380 Castle Falls Cir | 0.28mi | 3/2.0 | 1,091 (-0%) | 2mo | $197,500 | $181 | 85 |
| 804 Turkey Ridge Dr | 0.22mi | 3/2.0 | 1,121 (+2%) | 5mo | $208,000 | $186 | 82 |
| 9400 Gooden Dr | 0.14mi | 3/2.0 | 1,024 (-7%) | 2mo | $212,500 | $208 | 81 |
| 1332 Oak Knolls Dr | 0.30mi | 3/2.0 | 1,085 (-1%) | 6mo | $172,000 | $159 | 79 |
| 9561 Mountain Home Dr | 0.23mi | 3/2.0 | 1,075 (-2%) | 13mo | $210,000 | $195 | 75 |
| 916 Inglewood Ln | 0.11mi | 3/2.0 | 1,248 (+14%) | 1mo | $170,000 | $136 | 71 |
| 1108 Nan St | 0.69mi | 3/2.0 | 1,108 (+1%) | 0mo | $210,000 | $190 | 66 |
| 9433 Gooden Dr | 0.04mi | 3/2.0 | 1,250 (+14%) | 12mo | $205,000 | $164 | 65 |
| 9331 Castle Falls Cir | 0.35mi | 3/2.0 | 1,181 (+8%) | 11mo | $206,000 | $174 | 62 |
| 1308 Carolee Ct | 0.23mi | 3/2.0 | 1,241 (+13%) | 10mo | $225,000 | $181 | 58 |
| 7591 Shumont Dr | 0.65mi | 3/2.0 | 1,170 (+7%) | 13mo | $191,750 | $164 | 48 |
Match score weights: distance 35% · size 25% · config 20% · recency 20%. Top-matched comps best support the ARV.
Projected returns pro-forma
-3.0% appreciation · 3.11% rent growth · sell at horizon
- IRR
- -16.5%
- Equity multiple
- 0.41×
- Total profit
- $-31,066
- Equity at exit
- $28,181
- IRR
- -8.1%
- Equity multiple
- 0.49×
- Total profit
- $-27,127
- Equity at exit
- $16,341
Cash invested: $52,920 (down + closing). Projections, not guarantees.
Landlord ↔ Tenant lean methodology
- Overall (STATE)
- 85 Strongly Landlord-Friendly
- State North Carolina
- 85 Strongly Landlord-Friendly · R+3
- County
- — inherits STATE
- City
- — inherits STATE
ZIP-level market 28314
- Home prices YoY
- -15.7%
- Rents YoY
- 3.1%
- Active inventory
- 435
- Price-to-rent
- 9.9×
Monthly cashflow live
- Estimated rent
- $1,588 high interval (Pro) →
- Mortgage (P&I)
- −$991
- Tax from tax record
- −$194 /mo · $2,332/yr
- Insurance
- −$79
- HOA
- −$0
- Vacancy / Maint / Mgmt
- −$333
- Net cashflow
- $-10
Break-even live
Sensitivity live
| Price | -10% $97 | -5% $44 | +0% $-10 | +5% $-63 | +10% $-117 |
|---|---|---|---|---|---|
| Rent | -10% $-135 | -5% $-72 | +0% $-10 | +5% $53 | +10% $116 |
| Rate | -1.0pp $86 | -0.5pp $38 | base $-10 | +0.5pp $-59 | +1.0pp $-108 |
UW: 25.0% down · 7.5% · 30yr · 1.5% tax · 5.0% vac · 8.0% maint · 8.0% mgmt
Financing live
Cash to close
- Down payment
- $47,250
- Closing costs
- $5,670
- Reserves months
- —
- Total cash needed
- —
Loan-product check · same deal, 3 products live
Conventional
25% down · 7.5% · 30yr
- Down + closing
- —
- Monthly P&I
- —
- Monthly cashflow
- —
- DSCR
- —
- Eligible?
- —
Personal DTI + credit; lowest rate.
DSCR
20% down · 8.5% · 30yr
- Down + closing
- —
- Monthly P&I
- —
- Monthly cashflow
- —
- DSCR
- —
- Eligible?
- —
No personal income docs; deal must DSCR.
Hard money
10% down · 12.0% · 12mo
- Down + closing
- —
- Monthly P&I
- —
- Monthly cashflow
- —
- DSCR
- —
- Eligible?
- —
Short-term bridge; refi at stabilization.
Rent comps 27 comps
| Address | Beds | Baths | Sqft | Rent | $/sqft | DOM | Units | Dist |
|---|---|---|---|---|---|---|---|---|
| 9330 Castle Falls Cir Fayetteville, NC | 3.0 | 2.0 | 1120 | $1,600 | $1.43 | 22d | 1 | 0.34mi |
| 9329 Castle Falls Cir Fayetteville, NC | 3.0 | 2.0 | 1040 | $1,495 | $1.44 | 14d | 1 | 0.37mi |
| 4811 Cellner Dr Fayetteville, NC | 2.0–3.0 | 2.0 | 1100 | $1,375 | $1.25 | 14d | 5 | 0.37mi |
| 6909 Sunbeam Ct Fayetteville, NC | 2.0 | 2.0 | 840 | $900 | $1.07 | 14d | 1 | 0.84mi |
| 5101 ParcStone Ln Fayetteville, NC | 1.0–3.0 | 1.0–2.0 | 1029 | $1,755 | $1.71 | 14d | 12 | 0.87mi |
| 581 Abbotts Landing Dr Fayetteville, NC | 1.0–3.0 | 1.0–2.0 | 918 | $1,525 | $1.66 | 14d | 6 | 0.95mi |
| 1108 Patrick Dr Fayetteville, NC | 3.0 | 2.0 | 1132 | $1,800 | $1.59 | 24d | 1 | 0.96mi |
| 6916 Kizer Dr Fayetteville, NC | 3.0 | 2.0 | 1088 | $1,375 | $1.26 | 24d | 1 | 1.01mi |
| 1267 Exeter Ln Fayetteville, NC | 3.0 | 2.0 | 1228 | $1,545 | $1.26 | 14d | 1 | 1.07mi |
| 1274 Arailia Dr Fayetteville, NC | 3.0 | 2.0 | 1230 | $1,575 | $1.28 | 24d | 1 | 1.12mi |
| 1222 Kienast Dr Fayetteville, NC | 3.0 | 2.0 | 1122 | $1,250 | $1.11 | 22d | 1 | 1.12mi |
| 7311 Bass Dr Fayetteville, NC | 3.0 | 2.0 | 1220 | $1,495 | $1.23 | 24d | 1 | 1.14mi |
| 7895 Burwell Dr Fayetteville, NC | 3.0 | 2.0 | 1250 | $1,575 | $1.26 | 24d | 1 | 1.14mi |
| 8250 Cliffdale Rd Fayetteville, NC | 3.0–4.0 | 2.0–2.5 | 1405 | $1,875 | $1.33 | 24d | 4 | 1.15mi |
| 1338 Kienast Dr Fayetteville, NC | 3.0 | 2.0 | 1086 | $1,350 | $1.24 | 24d | 1 | 1.15mi |
| 7817 Laura Ann Ct Fayetteville, NC | 3.0 | 2.0 | 1161 | $1,950 | $1.68 | 14d | 1 | 1.17mi |
| 7805 Gallant Ridge Dr Fayetteville, NC | 3.0 | 2.0 | 1434 | $1,550 | $1.08 | 24d | 1 | 1.17mi |
| 1366 Worstead Dr Fayetteville, NC | 3.0 | 2.0 | 1079 | $1,650 | $1.53 | 14d | 1 | 1.19mi |
| 6764 Saint Julian Way Fayetteville, NC | 3.0 | 2.0 | 1216 | $1,775 | $1.46 | 24d | 1 | 1.20mi |
| 7903 Cliffdale Rd Fayetteville, NC | 1.0–2.0 | 1.0–2.0 | 900 | $1,350 | $1.50 | 14d | 2 | 1.26mi |
| 6794 Saint Julian Way Fayetteville, NC | 3.0 | 2.0 | 1345 | $1,800 | $1.34 | 24d | 1 | 1.29mi |
| 1690 Clairborne Dr Fayetteville, NC | 4.0 | 2.0 | 1486 | $1,900 | $1.28 | 14d | 1 | 1.33mi |
| 7023 Salinas Ct Fayetteville, NC | 3.0 | 2.0 | 1308 | $1,495 | $1.14 | 14d | 1 | 1.33mi |
| 7874 Barfield Dr Fayetteville, NC | 3.0 | 2.0 | 1406 | $1,600 | $1.14 | 24d | 1 | 1.35mi |
| 4050 Bardstown Ct Fayetteville, NC | 3.0 | 2.0 | 1450 | $1,495 | $1.03 | 14d | 1 | 1.42mi |
| 1328 Butterwood Cir Fayetteville, NC | 3.0 | 2.0 | 1302 | $1,395 | $1.07 | 24d | 1 | 1.48mi |
| 4010 Bardstown Ct Unit 202 Fayetteville, NC | 3.0 | 2.0 | 1450 | $1,495 | $1.03 | 24d | 1 | 1.49mi |
Listing history 26 events
-
2026-06-21days on market $189,000 Active 69 DOM
-
2026-06-18price $189,000 Active 66 DOM
-
2026-06-18days on market $195,000 Active 66 DOM
-
2026-06-17days on market $195,000 Active 65 DOM
-
2026-06-16days on market $195,000 Active 64 DOM
-
2026-06-15days on market $195,000 Active 63 DOM
-
2026-06-14days on market $195,000 Active 61 DOM
-
2026-06-13days on market $195,000 Active 60 DOM
-
2026-06-10days on market $195,000 Active 58 DOM
-
2026-06-09days on market $195,000 Active 57 DOM
-
2026-06-08days on market $195,000 Active 56 DOM
-
2026-06-07pricedays on market $195,000 Active 55 DOM
-
2026-06-03days on market $199,900 Active 51 DOM
-
2026-06-02days on market $199,900 Active 50 DOM
-
2026-06-01days on market $199,900 Active 49 DOM
-
2026-05-31days on market $199,900 Active 48 DOM
-
2026-05-30days on market $199,900 Active 47 DOM
-
2026-05-15price $199,900
-
2026-04-13$203,000 Active
-
2025-11-28historical $1,375
-
2025-11-11price $1,375
-
2025-10-16$1,500
-
2023-11-20historical $1,350
-
2023-10-20$1,350
-
2021-06-15soldstatus $62,500
-
1992-04-01soldstatus $63,500
ⓘ Source: listings_history table (triggers on properties + properties_extension) + one-shot
backfill from property_details.listing_events for pre-trigger history.
Tax reassessment forecast NC · Resets to sale price
- Current annual tax
- $2,332 · $194/mo
- Projected year-2 tax
- $2,332 · $194/mo
- Expected delta
- $0/yr ($0/mo · 0.0%)
ⓘ Screening estimate from a state-policy table — verify with the county assessor before closing.
Climate risk First Street
- Flood 1/10 Low FEMA zone X (unshaded) · 0% chance over 30 yrs
- Wildfire 4/10 Moderate
- Heat 7/10 Severe 7 d/yr ≥106°F today · 16 d/yr by 30 yrs out
- Wind 6/10 Major 74% chance of damaging wind over 30 yrs
- Air quality 1/10 Low 0 unhealthy d/yr today · 0 by 30 yrs out
Nearby sold comps map
Loading sold comps map…
Walkable amenities ~0.75 mi
Loading nearby amenities…
Taxation est. · year 1
- Rental income
- $19,057
- − Mortgage interest
- −$10,587
- − Property taxes
- −$2,332
- − Insurance
- −$945
- − Repairs & maintenance
- −$1,525
- − Management
- −$1,525
- − Depreciation
- −$5,498
- Taxable loss
- −$3,354
- Est. tax savings @ 24.0%
- +$805
- After-tax cash flow
- $689/yr
For passive investors: Depreciation is non-cash, so a rental often shows a tax loss while cash-flowing — sheltering income. Rental losses are passive: they offset passive income freely, and up to $25,000/yr can offset ordinary (W-2) income if you actively participate and your MAGI is under $100k (phasing out to $0 by $150k); unused losses carry forward. On sale, claimed depreciation is recaptured at up to 25%, and gains may owe capital-gains tax (a 1031 exchange can defer both). Figures are a year-1 estimate at your 24.0% rate — not tax advice; consult a CPA.
Schools (NCES district)
- District
- Cumberland County Schools
- NCES district ID
- 3700011
- Math proficiency
- 32% ▼ -2.00%
- Reading proficiency
- 41% ▼ -1.00%
- Median HH income
- $44,168
- Composite
- 31.0/100
- National rank
- #6096
- State rank
- #126 of 178 in NC
Livability — Fayetteville
- Score
- 75/100
- State rank
- #45
- US rank
- #4031
Category grades
Schools grade is shown separately in the Schools card above.
Census & demographics
- Census place
- Fayetteville, NC
- County
- Cumberland County · 265,314 people
- City population
- 226,118
- Metro
- Fayetteville, NC
- Population (ZIP)
- 55,834
- Household income
- $62,249
- Rent vs Own
- Severe rent burden
- 2511.0
Population outlook (Cumberland County) Hauer SSP2
- Today (2025)
- 330,855 people
- By 2030
- 333,523 · +0.8%
- By 2040
- 335,583 · +1.4%
- By 2050
- 335,325 · +1.4%
- By 2075
- 342,853 · +3.6%
- By 2100
- 340,698 · +3.0%
Race, ethnicity, and origin ACS 2023
- Neighborhood character
- Diverse neighborhood (Simpson 0.67)
- Race & ethnicity
- Black 49% White 25% Hispanic / Latino 16% Two or more races 11% Asian 3%
- Hispanic origin (detail)
- Mexican 5% Puerto Rican 6% Dominican 1%
- Common ancestry
- Slovak 1% Romanian 1% Lithuanian 1%
- Foreign-born
- 9% · Canada, South Korea
- Languages at home
- 84% English-only · Spanish 10% Korean 1% Other Asian/Pacific 1%
Political lean MEDSL · Cumberland
- 2024 margin
- D (+13.4) · D 56.1% · R 42.7% · Other 1.2%
- 2008→2024 swing
- -4.3pp toward R · 2008: 17.7pp · 2024: 13.4pp
- All cycles
- 2024: D+13.4 2020: D+16.6 2016: D+16.0 2012: D+19.7 2008: D+17.7
Not yet ingested
- Civics
- —
Market trends
- HPI YoY
- ▼ -43.20%
- Current HPI
- 231.873
- Rent YoY
- ▲ 3.11%
- Metro
- Fayetteville, NC
- State GDP YoY
- ▲ 3.28%
- F500 in state
- 26
Industry mix (Fortune 500 HQ in NC)
| Industry | F500 HQs | Revenue |
|---|---|---|
| Financial Services | 2 | $213B |
|
||
| Retail | 2 | $95B |
|
||
| Industrial Conglomerate | 1 | $38B |
|
||
| Metals / Steel | 1 | $35B |
|
||
| Utilities | 1 | $30B |
|
||
| Industrial Machinery | 1 | $19B |
|
||
Price history
+214.8% since first listed9 events — show timeline
- 2026-05-15 Price Changed $199,900 LPRMLS
- 2026-04-13 Listed $203,000 LPRMLS
- 2025-11-28 Rental Removed $1,375 APPFOLIO
- 2025-11-11 Price Changed $1,375 APPFOLIO
- 2025-10-16 Listed for Rent $1,500 APPFOLIO
- 2023-11-20 Rental Removed $1,350 TMLS
- 2023-10-20 Listed for Rent $1,350 TMLS
- 2021-06-15 Sold (Public Records) $62,500 Public Records
- 1992-04-01 Sold (Public Records) $63,500 Public Records
Property tax history
+6.0%/yrLatest (2025): $2,332 · +42.2% YoY. Source: county tax records.
Cash-flow waterfall
monthlySold comps — $/sqft
last 12 mo · ≤1 miLoading sold comps…