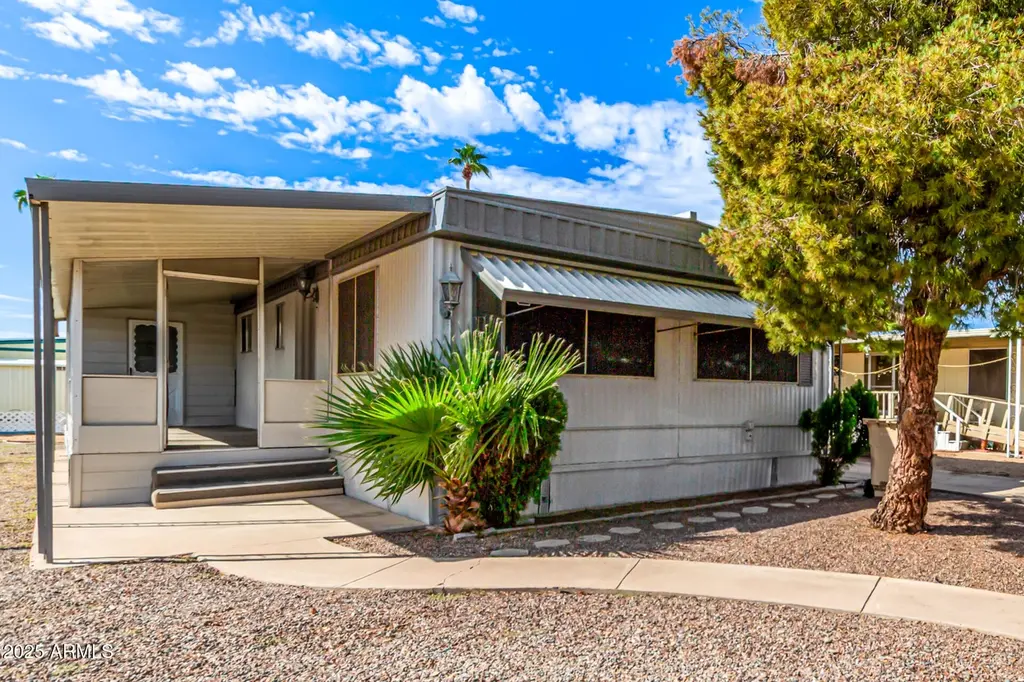
2650 W Union Hills Dr #112 · Phoenix, AZ
Flood risk 1/10 · Minimal
- FEMA flood zone
- X (shaded)
- Chance of flooding over 30 yrs
- 0.0%
- Est. flood insurance / yr
- $507 – $1,088
Fire risk 1/10 · Minimal
- Est. fire insurance / yr
- $610 – $1,132
Heat risk 8/10 · Major
- Hot days now (above 111°F)
- 5 days/yr
- Hot days in 30 yrs
- 13 days/yr
Wind risk 1/10 · Minimal
- Chance of severe wind over 30 yrs
- —
Air-quality risk 3/10 · Minor
- Unhealthy air days now
- 2 days/yr
- Unhealthy air days in 30 yrs
- 3 days/yr
Risk factors via First Street. Map © Google.
Why this score? — see what drove the B grade
The composite is a weighted blend of 9 inputs, each scored 0–100. Each bar is that input's sub-score; the figure is the points it added to the 100-point composite (weight × sub-score).
- Cash flow +30.0/30.0
- 1% rule +10.0/10.0
- DSCR +10.0/10.0
- ARV discount +6.5/15.0
- Schools +4.7/10.0
- Condition / age +4.0/5.0
- Livability +3.8/5.0
- Rent growth +1.8/5.0
- Appreciation +0.0/10.0
$48,000
🖨 Deal sheet (PDF) 📄 Offer letter ✓ Due diligence
Listing remarks MLS
Discover this adorable manufactured home in the sought-after Friendly Village of Orangewood! Offering 2 bedrooms, 2 bathrooms, and convenient carport parking. Inside, you'll find spacious living areas with wood-look flooring, large windows for abundant natural light, and neutral colors that go with any decor. The galley-style kitchen features ample cabinetry and counter space, as well as built-in appliances for a seamless cooking experience. The main bedroom is a true retreat, complete with a closet and a private ensuite for convenience. Enjoy your morning coffee on the covered patio and don't forget to visit this welcoming adult community's features, including the pool, spa, golf, media room, and clubhouse! Hurry up, this gem won't last!
Key facts
- Wood-look flooring
- Large windows
- Manufactured home
Tags
Neighborhood map
What this means for you Summary
Snapshot
- This is a 2-bed/2.0-bath manufactured listed at $48k. Condition is rated good.
Deal economics
- At list price, monthly cash flow is $808 ($10k/yr) — positive.
- The deal already cash-flows at list — no discount required.
- Meets the 1% rule at list price ($1k rent vs $48k).
- Recommended offer: $42k (12.0% below list) — sets the bar for market timing.
- Cap rate 26.5% vs local median 3.3% in Phoenix — top-decile yield for the area; either an underpriced asset or a hidden risk that comps aren't pricing in. Stress-test before assuming the spread holds.
Location & tenants
- Location reads 75/100 on livability (#16 in AZ, #3,924 nationally) — a middle-class / working-renter tenant base. Strengths: amenities A+, commute A+, housing A+; Watch: health & safety C-, crime F.
- Deer Valley Unified District (4246) (urban): math 50% / reading 55% proficiency, ranked #33 of 249 in AZ (top 13%) — acceptable for families but not a draw, mixed tenant base, ~2y average lease.
- Zoned schools: Park Meadows Elementary School (math 47% / reading 51%, grade D, #289 of 1,109 statewide, top 27%, 600 students, 54% FRL); Deer Valley Middle School (math 20% / reading 30%, grade F, #105 of 218 statewide, top 49%, 537 students, 65% FRL); Barry Goldwater High School (math 24% / reading 29%, grade F, #147 of 381 statewide, top 38%, 1,641 students, 52% FRL) — zoned schools average 57% FRL vs 21% district-wide (36 pts higher); higher-poverty schools than district average — tighter screening recommended.
- Zoned-school proficiency averages 34% at this address vs 52% district-wide (-19 pts) — the specific schools serving this property underperform the Deer Valley Unified District (4246) average; the district grade overstates school quality for this exact location.
- Market conditions: Rents soft (-2.8%/yr); 174 active listings in the ZIP; 39 comparable units currently listed for rent nearby; rentals at typical pace (median 17d on market — plan ~3-4 weeks tenant-placement turnaround); solid renter incomes; 36,011 units permitted in Maricopa County in 2024 (12,801 in 5+ unit buildings).
Forward outlook
- Local home prices are declining (-3.0%/yr); year-one equity from $332 of loan paydown is wiped out by about $1k of value loss. Plan a longer hold.
- Maricopa County population projected at +38% by 2050 — long-run rental-demand tailwind backs the buy-and-hold thesis.
- At projected returns (-3.0% appreciation + 0.0% rent growth), your $13k cash investment doubles in ~2 years — after that, you're playing with house money.
Negotiation context
- It's been on market 255 days — a 12% lower offer ($42k) is reasonable based on typical stale-listing flexibility.
Risks & watch-outs
- Climate carrying-cost: extreme-heat days projected 5→13/yr by 2055 (HVAC capex compounding) — expect insurance premiums to compound above CPI over the hold.
Questions for the listing agent
- It's been on market 255 days. Have you received any prior offers? Is the seller open to a 12% concession, seller financing, or rate buy-down credit?
- Built in 1971 — when were the roof, HVAC, electrical panel, plumbing, and water heater last replaced?
- Why hasn't it sold? Are there any deal-killer items the seller is aware of (foundation, flood, title, zoning, code violations)?
- Is there a deadline driving the sale (1031 exchange, divorce, estate, relocation)? That informs how much negotiation room exists.
- Crime grade is F in this area — have there been break-ins, vandalism, or insurance claims at this property in the last 3 years? What carrier currently insures it and at what premium?
- What's the average days-on-market for RENTAL listings here right now (not sales)? A rising rental-DOM trend means longer vacancies and softer asking-rent achievability than the comps imply.
- What's the recent tenant-quality profile in this submarket — average credit score on applications, eviction rate, late-payment / NSF rate, and stable-employment percentage? A property-management company in the area should have these aggregated.
- How much new for-sale + rental construction is in the pipeline within 1–3 miles? Heavy new supply typically softens prices + rents 12–24 months out; constrained supply supports both.
Investment metrics
- 1% rule
- 3.00% ✓
- Cap rate
- 26.49%
- Cash-on-cash
- 72.11%
- DSCR
- 4.21
- GRM
- 2.8
CMA / ARV
- ARV (median comp)
- $46,975
- List price
- $48,000
- Delta
- 2.18%
- Verdict
- FAIR
- Comps
- 8 within 1.0 mi
Show comp detail 7 sales within ~0.75 mi
| Address | Dist | Beds/Ba | Sqft | Sold | Price | $/sf | Match |
|---|---|---|---|---|---|---|---|
| 2650 W Union Hills Dr #366 | 0.08mi | 2/2.0 | 960 (0%) | 16mo | $73,900 | $77 | 83 |
| 2650 W Union Hills Dr #29 | 0.08mi | 2/2.0 | 896 (-7%) | 8mo | $42,500 | $47 | 79 |
| 2650 W Union Hills Dr #50 | 0.09mi | 2/2.0 | 868 (-10%) | 7mo | $40,500 | $47 | 74 |
| 2650 W Union Hills Dr #329 | 0.08mi | 2/2.0 | 896 (-7%) | 14mo | $72,000 | $80 | 74 |
| 2650 W Union Hills Dr #169 | 0.17mi | 2/2.0 | 1,056 (+10%) | 4mo | $65,000 | $62 | 72 |
| 2650 W Union Hills Dr #230 | 0.08mi | 2/2.0 | 1,040 (+8%) | 13mo | $26,000 | $25 | 71 |
| 2650 W Union Hills Dr #245 | 0.17mi | 1/1.0 (-1) | 840 (-12%) | 10mo | $35,000 | $42 | 54 |
Match score weights: distance 35% · size 25% · config 20% · recency 20%. Top-matched comps best support the ARV.
Projected returns pro-forma
-3.0% appreciation · 0.0% rent growth · sell at horizon
- IRR
- 68.4%
- Equity multiple
- 3.94×
- Total profit
- $39,459
- Equity at exit
- $7,157
- IRR
- 71.6%
- Equity multiple
- 7.28×
- Total profit
- $84,353
- Equity at exit
- $4,150
Cash invested: $13,440 (down + closing). Projections, not guarantees.
Landlord ↔ Tenant lean methodology
- Overall (STATE)
- 87 Strongly Landlord-Friendly
- State Arizona
- 87 Strongly Landlord-Friendly · R+3
- County
- — inherits STATE
- City
- — inherits STATE
ZIP-level market 85027
- Rents YoY
- -2.8%
- Active inventory
- 174
- Price-to-rent
- 2.8×
Monthly cashflow live
- Estimated rent
- $1,442 high interval (Pro) →
- Mortgage (P&I)
- −$252
- Tax est. 1.5%
- −$60 /mo · $720/yr
- Insurance
- −$20
- HOA
- −$0
- Vacancy / Maint / Mgmt
- −$303
- Net cashflow
- $808
Break-even live
Sensitivity live
| Price | -10% $841 | -5% $824 | +0% $808 | +5% $791 | +10% $775 |
|---|---|---|---|---|---|
| Rent | -10% $694 | -5% $751 | +0% $808 | +5% $865 | +10% $922 |
| Rate | -1.0pp $832 | -0.5pp $820 | base $808 | +0.5pp $795 | +1.0pp $783 |
UW: 25.0% down · 7.5% · 30yr · 1.5% tax · 5.0% vac · 8.0% maint · 8.0% mgmt
Financing live
Cash to close
- Down payment
- $12,000
- Closing costs
- $1,440
- Reserves months
- —
- Total cash needed
- —
Loan-product check · same deal, 3 products live
Conventional
25% down · 7.5% · 30yr
- Down + closing
- —
- Monthly P&I
- —
- Monthly cashflow
- —
- DSCR
- —
- Eligible?
- —
Personal DTI + credit; lowest rate.
DSCR
20% down · 8.5% · 30yr
- Down + closing
- —
- Monthly P&I
- —
- Monthly cashflow
- —
- DSCR
- —
- Eligible?
- —
No personal income docs; deal must DSCR.
Hard money
10% down · 12.0% · 12mo
- Down + closing
- —
- Monthly P&I
- —
- Monthly cashflow
- —
- DSCR
- —
- Eligible?
- —
Short-term bridge; refi at stabilization.
Rent comps 39 comps
| Address | Beds | Baths | Sqft | Rent | $/sqft | DOM | Units | Dist |
|---|---|---|---|---|---|---|---|---|
| 18410 N 27th Ave Phoenix, AZ | 1.0 | 1.0 | 600 | $1,051 | $1.75 | 26d | 1 | 0.28mi |
| 2929 W Yorkshire Dr Phoenix, AZ | 1.0–3.0 | 1.0–2.0 | 915 | $1,498 | $1.64 | 20d | 2 | 0.43mi |
| 18250 N 25th Ave Phoenix, AZ | 1.0–3.0 | 1.0–2.0 | 992 | $1,729 | $1.74 | 0d | 18 | 0.46mi |
| 3010 W Yorkshire Dr Phoenix, AZ | 1.0–3.0 | 1.0–2.0 | 975 | $1,444 | $1.48 | 3d | 80 | 0.56mi |
| 17840 N Black Canyon Hwy Phoenix, AZ | 1.0–2.0 | 1.0–2.0 | 880 | $1,655 | $1.88 | 4d | 19 | 0.58mi |
| 2039 W Union Hills Dr Unit 15-204 Phoenix, AZ | 2.0 | 1.0 | 1000 | $1,245 | $1.25 | 16d | 1 | 0.78mi |
| 2039 W Union Hills Dr Unit 15-001 Phoenix, AZ | 2.0 | 2.0 | 1100 | $1,345 | $1.22 | 16d | 1 | 0.78mi |
| 2039 W Union Hills Dr Unit 39-143 Phoenix, AZ | 2.0 | 2.0 | 1100 | $1,345 | $1.22 | 9d | 1 | 0.78mi |
| 2039 W Union Hills Dr Unit 39-117 Phoenix, AZ | 2.0 | 1.0 | 1000 | $1,000 | $1.00 | 9d | 1 | 0.78mi |
| 3144 W Charleston Ave Phoenix, AZ | 3.0 | 2.0 | 1085 | $1,845 | $1.70 | 18d | 1 | 0.79mi |
| 2020 W Union Hills Dr #254 Phoenix, AZ | 2.0 | 2.0 | 1049 | $1,650 | $1.57 | 45d | 1 | 0.82mi |
| 18626 N 34th Ave #2 Phoenix, AZ | 2.0 | 2.5 | 570 | $1,595 | $2.80 | 45d | 1 | 0.82mi |
| 19940 N 23rd Ave Phoenix, AZ | 4.0 | 1.0–2.0 | 812 | $1,366 | $1.68 | 0d | 61 | 0.85mi |
| 3411 W Morrow Dr #3 Phoenix, AZ | 2.0 | 1.5 | 1056 | $1,495 | $1.42 | 45d | 1 | 0.85mi |
| 20003 N 23rd Ave Phoenix, AZ | 1.0 | 1.0 | 620 | $1,132 | $1.83 | 23d | 1 | 0.96mi |
| 20003 N 23rd Ave Phoenix, AZ | 1.0 | 1.0 | 580 | $1,121 | $1.93 | 1d | 1 | 0.96mi |
| 20003 N 23rd Ave Phoenix, AZ | 2.0 | 2.0 | 860 | $1,522 | $1.77 | 45d | 1 | 0.96mi |
| 20003 N 23rd Ave Phoenix, AZ | 2.0 | 2.0 | 860 | $1,440 | $1.67 | 25d | 1 | 0.96mi |
| 2222 W Beardsley Rd Phoenix, AZ | 2.0 | 1.0–2.0 | 616 | $1,285 | $2.09 | 0d | 30 | 1.11mi |
| 18811 N 19th Ave Phoenix, AZ | 1.0–2.0 | 1.0–2.0 | 885 | $1,525 | $1.72 | 3d | 2 | 1.12mi |
| 18811 N 19th Ave Phoenix, AZ | 1.0–2.0 | 1.0–2.0 | 885 | $1,400 | $1.58 | 1d | 3 | 1.12mi |
| 20245 N 32nd Dr Phoenix, AZ | 1.0–2.0 | 1.0–2.0 | 834 | $1,530 | $1.83 | 0d | 11 | 1.13mi |
| 20231 N 21st Ln Phoenix, AZ | 1.0 | 1.0 | 770 | $995 | $1.29 | 26d | 1 | 1.16mi |
| 20808 N 27th Ave Phoenix, AZ | 1.0–3.0 | 1.0–2.0 | 962 | $1,560 | $1.62 | 1d | 15 | 1.19mi |
| 3202 W Bell Rd Phoenix, AZ | 1.0–2.0 | 1.0–2.0 | 719 | $1,299 | $1.81 | 0d | 33 | 1.21mi |
| 17216 N 33rd Ave Phoenix, AZ | 1.0–2.0 | 1.0–2.0 | 741 | $1,525 | $2.06 | 1d | 21 | 1.25mi |
| 3420 W Danbury Dr Unit C113 Phoenix, AZ | 2.0 | 2.0 | 896 | $1,485 | $1.66 | 0d | 1 | 1.31mi |
| 17609 N 19th Ave Unit 204 Phoenix, AZ | 2.0 | 2.0 | 935 | $1,199 | $1.28 | 45d | 1 | 1.32mi |
| 3420 W Danbury Dr Phoenix, AZ | 1.0–2.0 | 1.0–2.0 | 810 | $1,485 | $1.83 | 14d | 2 | 1.32mi |
| 3420 W Danbury Dr Phoenix, AZ | 1.0–2.0 | 1.0–2.0 | 810 | $1,485 | $1.83 | 26d | 2 | 1.32mi |
| 17609 N 19th Ave Apt 107 Phoenix, AZ | 2.0 | 2.0 | 935 | $1,325 | $1.42 | 4d | 1 | 1.33mi |
| 20601 N 33rd Ave Phoenix, AZ | 3.0 | 2.0 | 1085 | $2,100 | $1.94 | 26d | 1 | 1.33mi |
| 3434 W Danbury Dr Unit A114 Phoenix, AZ | 2.0 | 2.0 | 896 | $1,485 | $1.66 | 26d | 1 | 1.33mi |
| 17609 N 19th Ave Unit 209 Phoenix, AZ | 2.0 | 2.0 | 935 | $1,099 | $1.18 | 26d | 1 | 1.34mi |
| 17211 N 35th Ave Phoenix, AZ | 1.0–2.0 | 1.0–2.0 | 827 | $1,500 | $1.81 | 20d | 2 | 1.34mi |
| 17211 N 35th Ave Unit A213 Phoenix, AZ | 1.0 | 1.0 | 758 | $1,495 | $1.97 | 45d | 1 | 1.37mi |
| 17211 N 35th Ave Phoenix, AZ | 2.0 | 2.0 | 896 | $1,500 | $1.67 | 0d | 1 | 1.39mi |
| 2142 W Monona Dr Phoenix, AZ | 3.0 | 2.0 | 1092 | $1,790 | $1.64 | 23d | 1 | 1.42mi |
| 17425 N 19th Ave Phoenix, AZ | 1.0–2.0 | 1.0–2.0 | 776 | $1,327 | $1.71 | 0d | 38 | 1.46mi |
Listing history 17 events
-
2026-06-21days on market $48,000 Active 255 DOM
-
2026-06-18days on market $48,000 Active 252 DOM
-
2026-06-17days on market $48,000 Active 251 DOM
-
2026-06-16days on market $48,000 Active 250 DOM
-
2026-06-15days on market $48,000 Active 249 DOM
-
2026-06-13days on market $48,000 Active 247 DOM
-
2026-06-13days on market $48,000 Active 246 DOM
-
2026-06-09days on market $48,000 Active 243 DOM
-
2026-06-08days on market $48,000 Active 242 DOM
-
2026-06-07days on market $48,000 Active 241 DOM
-
2026-06-04days on market $48,000 Active 238 DOM
-
2026-06-03days on market $48,000 Active 237 DOM
-
2026-06-02days on market $48,000 Active 236 DOM
-
2026-06-01days on market $48,000 Active 235 DOM
-
2026-05-31days on market $48,000 Active 234 DOM
-
2026-01-31price $48,000 748-char remark
Show marketing remark (748 chars)
Discover this adorable manufactured home in the sought-after Friendly Village of Orangewood! Offering 2 bedrooms, 2 bathrooms, and convenient carport parking. Inside, you'll find spacious living areas with wood-look flooring, large windows for abundant natural light, and neutral colors that go with any decor. The galley-style kitchen features ample cabinetry and counter space, as well as built-in appliances for a seamless cooking experience. The main bedroom is a true retreat, complete with a closet and a private ensuite for convenience. Enjoy your morning coffee on the covered patio and don't forget to visit this welcoming adult community's features, including the pool, spa, golf, media room, and clubhouse! Hurry up, this gem won't last!
-
2025-10-06$53,000 Active 748-char remark
Show marketing remark (748 chars)
Discover this adorable manufactured home in the sought-after Friendly Village of Orangewood! Offering 2 bedrooms, 2 bathrooms, and convenient carport parking. Inside, you'll find spacious living areas with wood-look flooring, large windows for abundant natural light, and neutral colors that go with any decor. The galley-style kitchen features ample cabinetry and counter space, as well as built-in appliances for a seamless cooking experience. The main bedroom is a true retreat, complete with a closet and a private ensuite for convenience. Enjoy your morning coffee on the covered patio and don't forget to visit this welcoming adult community's features, including the pool, spa, golf, media room, and clubhouse! Hurry up, this gem won't last!
ⓘ Source: listings_history table (triggers on properties + properties_extension) + one-shot
backfill from property_details.listing_events for pre-trigger history.
Climate risk First Street
- Flood 1/10 Low FEMA zone X (shaded) · 0% chance over 30 yrs
- Wildfire 1/10 Low
- Heat 8/10 Severe 5 d/yr ≥111°F today · 13 d/yr by 30 yrs out
- Wind 1/10 Low
- Air quality 3/10 Moderate 2 unhealthy d/yr today · 3 by 30 yrs out
Nearby sold comps map
Loading sold comps map…
Walkable amenities ~0.75 mi
Loading nearby amenities…
Taxation est. · year 1
- Rental income
- $17,307
- − Mortgage interest
- −$2,689
- − Property taxes
- −$720
- − Insurance
- −$240
- − Repairs & maintenance
- −$1,385
- − Management
- −$1,385
- − Depreciation
- −$1,396
- Taxable income
- $9,493
- Est. tax owed @ 24.0%
- −$2,278
- After-tax cash flow
- $7,414/yr
For passive investors: Depreciation is non-cash, so a rental often shows a tax loss while cash-flowing — sheltering income. Rental losses are passive: they offset passive income freely, and up to $25,000/yr can offset ordinary (W-2) income if you actively participate and your MAGI is under $100k (phasing out to $0 by $150k); unused losses carry forward. On sale, claimed depreciation is recaptured at up to 25%, and gains may owe capital-gains tax (a 1031 exchange can defer both). Figures are a year-1 estimate at your 24.0% rate — not tax advice; consult a CPA.
Condition & rehab AI · 12 photos
This manufactured home in the Friendly Village of Orangewood is in good condition with minimal repairs needed. It offers a good investment opportunity with potential for both resale and rental value.
Value-add opportunities
- Both Paint exterior siding — Enhances curb appeal and value
- Both Clean gutters — Improves drainage and property value
Renovation cost estimate screening
Value-add ROI direction
- Both Paint exterior siding — Enhances curb appeal and value ↑
- Both Clean gutters — Improves drainage and property value ↑
ⓘ Cost ranges are severity-bucket heuristics (US national rule-of-thumb). Get contractor quotes + a written scope before underwriting a rehab budget.
Schools (NCES district)
- District
- Deer Valley Unified District (4246)
- NCES district ID
- 0407750
- Math proficiency
- 50% ▼ -9.00%
- Reading proficiency
- 55% ▼ -6.00%
- Median HH income
- $72,516
- Composite
- 47.0/100
- National rank
- #2346
- State rank
- #33 of 249 in AZ
Livability — Phoenix
- Score
- 75/100
- State rank
- #16
- US rank
- #3924
Category grades
Schools grade is shown separately in the Schools card above.
Census & demographics
- Census place
- Phoenix, AZ
- County
- Maricopa County · 4,537,380 people
- City population
- 1,500,198
- Metro
- Phoenix-Mesa-Chandler, AZ
- Population (ZIP)
- 39,487
- Household income
- $76,605
- Rent vs Own
- Severe rent burden
- 1533.0
Population outlook (Maricopa County) Hauer SSP2
- Today (2025)
- 4,979,203 people
- By 2030
- 5,378,229 · +8.0%
- By 2040
- 6,156,598 · +23.6%
- By 2050
- 6,872,376 · +38.0%
- By 2075
- 8,401,270 · +68.7%
- By 2100
- 9,247,439 · +85.7%
Race, ethnicity, and origin ACS 2023
- Neighborhood character
- Diverse neighborhood (Simpson 0.58)
- Race & ethnicity
- White 61% Hispanic / Latino 22% Two or more races 13% Asian 7% Black 2% Native American 2%
- Hispanic origin (detail)
- Mexican 18% Puerto Rican 1%
- Common ancestry
- Lithuanian 2% Romanian 2% Italian 2%
- Foreign-born
- 16% · Canada, China
- Languages at home
- 77% English-only · Spanish 10% Other Indo-European 4% Other Asian/Pacific 3%
Political lean MEDSL · Maricopa
- 2024 margin
- Toss-up / Even · D 47.7% · R 51.2% · Other 1.1%
- 2008→2024 swing
- +7.1pp toward D · 2008: -10.6pp · 2024: -3.5pp
- All cycles
- 2024: R+3.5 2020: D+2.2 2016: R+3.5 2012: R+12.0 2008: R+10.6
Not yet ingested
- Civics
- —
Market trends
- HPI YoY
- ▼ -248.58%
- Current HPI
- 356.8851
- Rent YoY
- ▼ -2.75%
- Metro
- Phoenix-Mesa-Chandler, AZ
- State GDP YoY
- ▲ 4.54%
- F500 in state
- 20
Industry mix (Fortune 500 HQ in AZ)
| Industry | F500 HQs | Revenue |
|---|---|---|
| Technology | 2 | $13B |
|
||
| Mining / Metals | 1 | $23B |
|
||
| Environmental Services | 1 | $16B |
|
||
| Metals / Steel | 1 | $14B |
|
||
| Technology Distribution | 1 | $9B |
|
||
| Homebuilding | 1 | $8B |
|
||
Price history
-9.4% since first listed2 events — show timeline
- 2026-01-31 Price Changed $48,000 ARMLS
- 2025-10-06 Listed $53,000 ARMLS
Cash-flow waterfall
monthlySold comps — $/sqft
last 12 mo · ≤1 miLoading sold comps…