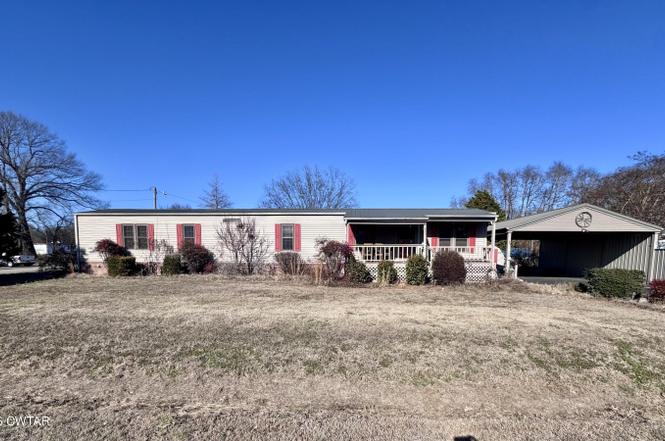
462 Jowers Rd · Martin, TN
Flood risk 1/10 · Minimal
- FEMA flood zone
- X (unshaded)
- Chance of flooding over 30 yrs
- 0.0%
- Est. flood insurance / yr
- $507 – $1,088
Fire risk 1/10 · Minimal
- Est. fire insurance / yr
- $949 – $1,763
Heat risk 6/10 · Moderate
- Hot days now (above 108°F)
- 7 days/yr
- Hot days in 30 yrs
- 21 days/yr
Wind risk 4/10 · Minor
- Chance of severe wind over 30 yrs
- 9.0%
Air-quality risk 1/10 · Minimal
- Unhealthy air days now
- 0 days/yr
- Unhealthy air days in 30 yrs
- 0 days/yr
Risk factors via First Street. Map © Google.
Why this score? — see what drove the C grade
The composite is a weighted blend of 9 inputs, each scored 0–100. Each bar is that input's sub-score; the figure is the points it added to the 100-point composite (weight × sub-score).
- Cash flow +27.4/30.0
- DSCR +9.6/10.0
- 1% rule +6.2/10.0
- ARV discount +4.8/15.0
- Livability +3.8/5.0
- Schools +3.0/10.0
- Rent growth +2.5/5.0
- Condition / age +2.5/5.0
- Appreciation +0.0/10.0
$125,000
🖨 Deal sheet 📄 Offer letter ✓ Due diligence
Listing remarks MLS
3 bedroom 3 bath home in the county .
Key facts
- Open floor plan
- Spacious backyard
- Detached carport
Tags
Neighborhood map
What this means for you Summary
Snapshot
- This is a 3-bed/2.0-bath manufactured listed at $125k.
Deal economics
- At list price, monthly cash flow is $367 ($4k/yr) — positive.
- The deal already cash-flows at list — no discount required.
- Meets the 1% rule at list price ($1k rent vs $125k).
- Recommended offer: $118k (6.0% below list) — sets the bar for market timing.
- Cap rate 9.8% vs local median 4.0% in Martin — top-decile yield for the area; either an underpriced asset or a hidden risk that comps aren't pricing in. Stress-test before assuming the spread holds.
Location & tenants
- Location reads 75/100 on livability (#15 in TN, #4,330 nationally) — a middle-class / working-renter tenant base. Strengths: cost of living A+, health & safety A+, housing B+; Watch: schools D+, commute F, employment F.
- Weakley County (rural): math 34% / reading 38% proficiency, ranked #32 of 139 in TN (top 23%) — families likely to look elsewhere, expect single-tenant / working-renter base with shorter leases.
- Market conditions: 85 active listings in the ZIP; 69 units permitted in Weakley County in 2024 (0 in 5+ unit buildings).
- This rent runs 32% of the median local income ($52k/yr) — at the standard rent-burdened threshold; future hikes will face affordability resistance.
Forward outlook
- Local home prices are declining (-3.0%/yr); year-one equity from $864 of loan paydown is wiped out by about $4k of value loss. Plan a longer hold.
- Weakley County population projected at -20% by 2050 — secular population decline; favor cash flow + early exit over multi-decade hold.
- At projected returns (-3.0% appreciation + 3.0% rent growth), your $35k cash investment doubles in ~10 years — after that, you're playing with house money.
Negotiation context
- It's been on market 79 days — a 6% lower offer ($118k) is reasonable based on typical stale-listing flexibility.
- 3 sale attempts since 4y ago with the ask held roughly flat each time — persistent listings suggest the price (not the market) is what's stuck; bring a comps-based counter.
- Current owner paid $100k; 25% above their basis — modest negotiation headroom, anchor on the comps not their cost.
Risks & watch-outs
- Climate carrying-cost: extreme-heat days projected 7→21/yr by 2055 (HVAC capex compounding) — expect insurance premiums to compound above CPI over the hold.
Questions for the listing agent
- It's been on market 79 days. Have you received any prior offers? Is the seller open to a 6% concession, seller financing, or rate buy-down credit?
- Why hasn't it sold? Are there any deal-killer items the seller is aware of (foundation, flood, title, zoning, code violations)?
- Is there a deadline driving the sale (1031 exchange, divorce, estate, relocation)? That informs how much negotiation room exists.
- Schools are D-rated, which usually means shorter tenancies and higher turnover. Who's the typical renter profile here, and what's been the actual vacancy rate?
- What's the average days-on-market for RENTAL listings here right now (not sales)? A rising rental-DOM trend means longer vacancies and softer asking-rent achievability than the comps imply.
- What's the recent tenant-quality profile in this submarket — average credit score on applications, eviction rate, late-payment / NSF rate, and stable-employment percentage? A property-management company in the area should have these aggregated.
- How much new for-sale + rental construction is in the pipeline within 1–3 miles? Heavy new supply typically softens prices + rents 12–24 months out; constrained supply supports both.
Investment metrics
- 1% rule
- 1.12% ✓
- Cap rate
- 9.81%
- Cash-on-cash
- 12.58%
- DSCR
- 1.56
- GRM
- 7.5
CMA / ARV
- ARV (on-the-fly)
- $117,808
- Comps found
- 1
Show comp detail 1 sale within ~0.75 mi
| Address | Dist | Beds/Ba | Sqft | Sold | Price | $/sf | Match |
|---|---|---|---|---|---|---|---|
| 462 Jowers Rd | 0.00mi | 3/3.0 | 1,592 (0%) | 1mo | $117,500 | $74 | 95 |
Match score weights: distance 35% · size 25% · config 20% · recency 20%. Top-matched comps best support the ARV.
Projected returns pro-forma
-3.0% appreciation · 3.0% rent growth · sell at horizon
- IRR
- 2.3%
- Equity multiple
- 1.09×
- Total profit
- $3,049
- Equity at exit
- $18,638
- IRR
- 11.8%
- Equity multiple
- 1.93×
- Total profit
- $32,505
- Equity at exit
- $10,808
Cash invested: $35,000 (down + closing). Projections, not guarantees.
Landlord ↔ Tenant lean methodology
- Overall (STATE)
- 87 Strongly Landlord-Friendly
- State Tennessee
- 87 Strongly Landlord-Friendly · R+13
- County
- — inherits STATE
- City
- — inherits STATE
ZIP-level market 38237
- Home prices YoY
- -16.5%
- Active inventory
- 85
- Price-to-rent
- 7.5×
Monthly cashflow live
- Estimated rent
- $1,397 medium interval (Pro) →
- Mortgage (P&I)
- −$656
- Tax from tax record
- −$29 /mo · $351/yr
- Insurance
- −$52
- HOA
- −$0
- Vacancy / Maint / Mgmt
- −$293
- Net cashflow
- $367
Break-even live
UW: 25.0% down · 7.5% · 30yr · 1.5% tax · 5.0% vac · 8.0% maint · 8.0% mgmt
Financing live
Cash to close
- Down payment
- $31,250
- Closing costs
- $3,750
- Reserves months
- —
- Total cash needed
- —
Loan-product check · same deal, 3 products live
Conventional
25% down · 7.5% · 30yr
- Down + closing
- —
- Monthly P&I
- —
- Monthly cashflow
- —
- DSCR
- —
- Eligible?
- —
Personal DTI + credit; lowest rate.
DSCR
20% down · 8.5% · 30yr
- Down + closing
- —
- Monthly P&I
- —
- Monthly cashflow
- —
- DSCR
- —
- Eligible?
- —
No personal income docs; deal must DSCR.
Hard money
10% down · 12.0% · 12mo
- Down + closing
- —
- Monthly P&I
- —
- Monthly cashflow
- —
- DSCR
- —
- Eligible?
- —
Short-term bridge; refi at stabilization.
Listing history 7 events
-
2026-04-10status Pending
-
2026-01-21$125,000 Active
-
2023-02-13soldstatus $100,000
-
2023-02-10soldstatus $100,000 37-char remark
Show marketing remark (317 chars)
Super Corner Lot! Move-In Ready with Appliances! 24' x 30' Carport - Modular Home (1988) - New Flooring - Permanent Foundation - 3 Outbuildings, 1 with Electricity - Hot water heater turned off at breaker - Whole Home Generac Generator- Propane Tank owned by by seller. Information deemed reliable but not guaranteed.
-
2023-02-10soldstatus $100,000 317-char remark
Show marketing remark (317 chars)
Super Corner Lot! Move-In Ready with Appliances! 24' x 30' Carport - Modular Home (1988) - New Flooring - Permanent Foundation - 3 Outbuildings, 1 with Electricity - Hot water heater turned off at breaker - Whole Home Generac Generator- Propane Tank owned by by seller. Information deemed reliable but not guaranteed.
-
2023-01-26$100,000 37-char remark
Show marketing remark (37 chars)
3 bedroom 3 bath home in the county .
-
2022-10-17$115,000 317-char remark
Show marketing remark (317 chars)
Super Corner Lot! Move-In Ready with Appliances! 24' x 30' Carport - Modular Home (1988) - New Flooring - Permanent Foundation - 3 Outbuildings, 1 with Electricity - Hot water heater turned off at breaker - Whole Home Generac Generator- Propane Tank owned by by seller. Information deemed reliable but not guaranteed.
ⓘ Source: listings_history table (triggers on properties + properties_extension) + one-shot
backfill from property_details.listing_events for pre-trigger history.
Tax reassessment forecast TN · Resets to sale price
- Current annual tax
- $351 · $29/mo
- Projected year-2 tax
- $888 · $74/mo
- Expected delta
- +$536/yr (+$45/mo · 152.8%)
ⓘ Screening estimate from a state-policy table — verify with the county assessor before closing.
Climate risk First Street
- Flood 1/10 Low FEMA zone X (unshaded) · 0% chance over 30 yrs
- Wildfire 1/10 Low
- Heat 6/10 Major 7 d/yr ≥108°F today · 21 d/yr by 30 yrs out
- Wind 4/10 Moderate 9% chance of damaging wind over 30 yrs
- Air quality 1/10 Low 0 unhealthy d/yr today · 0 by 30 yrs out
Nearby sold comps map
Loading sold comps map…
Walkable amenities ~0.75 mi
Loading nearby amenities…
Taxation est. · year 1
- Rental income
- $16,764
- − Mortgage interest
- −$7,002
- − Property taxes
- −$351
- − Insurance
- −$625
- − Repairs & maintenance
- −$1,341
- − Management
- −$1,341
- − Depreciation
- −$3,636
- Taxable income
- $2,468
- Est. tax owed @ 24.0%
- −$592
- After-tax cash flow
- $3,809/yr
For passive investors: Depreciation is non-cash, so a rental often shows a tax loss while cash-flowing — sheltering income. Rental losses are passive: they offset passive income freely, and up to $25,000/yr can offset ordinary (W-2) income if you actively participate and your MAGI is under $100k (phasing out to $0 by $150k); unused losses carry forward. On sale, claimed depreciation is recaptured at up to 25%, and gains may owe capital-gains tax (a 1031 exchange can defer both). Figures are a year-1 estimate at your 24.0% rate — not tax advice; consult a CPA.
Schools (NCES district)
- District
- Weakley County
- NCES district ID
- 4704470
- Math proficiency
- 34% ▼ -10.00%
- Reading proficiency
- 38% ▼ -2.00%
- Median HH income
- $35,389
- Composite
- 29.77/100
- National rank
- #6434
- State rank
- #32 of 139 in TN
Livability — Martin
- Score
- 75/100
- State rank
- #15
- US rank
- #4330
Category grades
Schools grade is shown separately in the Schools card above.
Census & demographics
- County
- Weakley County · 15,627 people
- City population
- 15,627
- Metro
- Martin, TN
- Population (ZIP)
- 15,627
- Household income
- $51,670
- Rent vs Own
- Severe rent burden
- 636.0
Population outlook (Weakley County) Hauer SSP2
- Today (2025)
- 31,862 people
- By 2030
- 30,688 · -3.7%
- By 2040
- 27,935 · -12.3%
- By 2050
- 25,485 · -20.0%
- By 2075
- 21,080 · -33.8%
- By 2100
- 18,214 · -42.8%
Race, ethnicity, and origin ACS 2023
- Neighborhood character
- Predominantly White (77%)
- Race & ethnicity
- White 77% Black 13% Two or more races 5% Hispanic / Latino 4% Asian 2%
- Common ancestry
- Slovak 2% Italian 1% Serbian 1%
- Foreign-born
- 4% · Canada, Vietnam, South Korea
- Languages at home
- 95% English-only · Spanish 2% Vietnamese 1% Other Indo-European 1%
Political lean MEDSL · Weakley
- 2024 margin
- Solid R (+58.4) · D 20.3% · R 78.7%
- 2008→2024 swing
- -27.2pp toward R · 2008: -31.1pp · 2024: -58.4pp
- All cycles
- 2024: R+58.4 2020: R+53.7 2016: R+51.4 2012: R+41.0 2008: R+31.1
Not yet ingested
- Civics
- —
Market trends
- HPI YoY
- ▼ -46.05%
- Current HPI
- 233.76
- Rent YoY
- —
- Metro
- Martin, TN
- State GDP YoY
- ▲ 2.78%
- F500 in state
- 22
Industry mix (Fortune 500 HQ in TN)
| Industry | F500 HQs | Revenue |
|---|---|---|
| Healthcare | 3 | $91B |
|
||
| Retail | 3 | $72B |
|
||
| Transportation / Logistics | 1 | $88B |
|
||
| Paper / Packaging | 1 | $19B |
|
||
| Insurance | 1 | $13B |
|
||
| Energy | 1 | $12B |
|
||
Price history
+8.7% since first listed7 events — show timeline
- 2026-04-10 Pending — CWTAR
- 2026-01-21 Listed $125,000 CWTAR
- 2023-02-13 Sold (Public Records) $100,000 Public Records
- 2023-02-10 Sold (MLS) $100,000 RRAR as distributed by MLS GRID
- 2023-02-10 Sold (MLS) $100,000 CWTAR
- 2023-01-26 Listed $100,000 CWTAR
- 2022-10-17 Listed $115,000 RRAR as distributed by MLS GRID
Property tax history
+9.3%/yrLatest (2025): $351 · +12.9% YoY. Source: county tax records.
Cash-flow waterfall
monthlySold comps — $/sqft
last 12 mo · ≤1 miLoading sold comps…