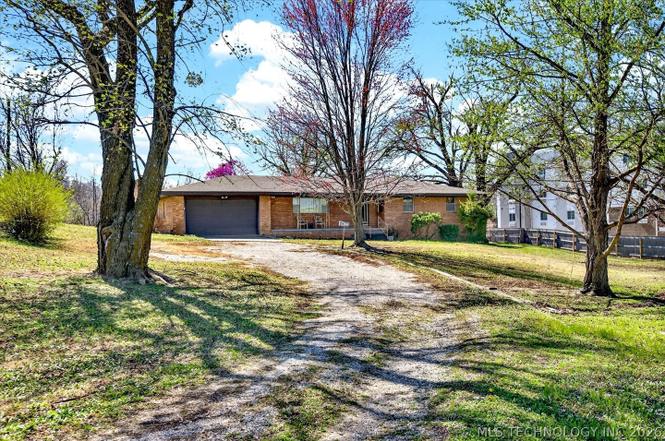
3939 Lakeview Dr · Bartlesville, OK
Flood risk 1/10 · Minimal
- FEMA flood zone
- X (unshaded)
- Chance of flooding over 30 yrs
- 0.0%
- Est. flood insurance / yr
- $507 – $1,088
Fire risk 6/10 · Moderate
- Est. fire insurance / yr
- $2,463 – $4,575
Heat risk 6/10 · Moderate
- Hot days now (above 111°F)
- 7 days/yr
- Hot days in 30 yrs
- 18 days/yr
Wind risk 2/10 · Minimal
- Chance of severe wind over 30 yrs
- 4.0%
Air-quality risk 2/10 · Minimal
- Unhealthy air days now
- 2 days/yr
- Unhealthy air days in 30 yrs
- 2 days/yr
Risk factors via First Street. Map © Google.
Why this score? — see what drove the C- grade
The composite is a weighted blend of 9 inputs, each scored 0–100. Each bar is that input's sub-score; the figure is the points it added to the 100-point composite (weight × sub-score).
- Cash flow +18.9/30.0
- ARV discount +12.7/15.0
- DSCR +5.9/10.0
- 1% rule +3.8/10.0
- Livability +3.2/5.0
- Schools +2.6/10.0
- Rent growth +2.5/5.0
- Condition / age +2.5/5.0
- Appreciation +0.0/10.0
$208,700
🖨 Deal sheet (PDF) 📄 Offer letter ✓ Due diligence
Listing remarks
Offered for the first time, this lovingly maintained single-owner home has been the setting for decades of family memories and is now ready for its next chapter. Pride of ownership shows throughout, with a home that has been carefully cared for and beautifully maintained over the years. One of the hidden gems of the property is the original hardwood flooring beneath the existing carpet, waiting to be uncovered and brought back to life. The home offers comfortable living spaces including a secondary family den featuring a cozy fireplace and striking brick accent wall—the perfect spot for relaxing evenings, movie nights, or gathering with family and friends. An additional space is carve
Key facts
- Brick accent wall
- Secondary family den
- Large corner lot
Tags
Property features AI
Finance
- HOA & community: Gutters noted as community feature
Exterior
- Parking: Attached garage with shelving and storage (2 car spaces)
- Security: Owned security system; Smoke detectors; No safety shelter
- Utilities: Electricity available; Natural gas available; Public water; Public sewer; Phone available
- Home design: Single-story home; Faces northeast; Crawlspace foundation
- Construction: Brick and wood frame construction; Asphalt/fiberglass roof; Built (year per public records)
- Exterior features: Covered patio and porch; Shed(s); Rain gutters; Chain link, partial privacy fencing; Corner lot with mature trees and wooded areas
Interior
- Kitchen: Dishwasher; Microwave; Oven; Range; Refrigerator; Plumbed for ice maker
- Flooring: Carpet; Tile; Wood
- Bathrooms: 1 full bathroom; 1 half bathroom
- Heating & cooling: Central heating (gas); Central air conditioning
- Interior features: Ceiling fans; Laminate countertops; Programmable thermostat; Insulated doors; Aluminum-framed windows; Electric oven/range connections; Plumbed for ice maker
- Laundry & utility: Washer hookup; Gas dryer hookup; Gas water heater
Neighborhood map
What this means for you Summary
Snapshot
- This is a 3-bed/1.0-bath single-family listed at $209k.
Deal economics
- At list price, monthly cash flow is $212 ($3k/yr) — positive.
- The deal already cash-flows at list — no discount required.
- To meet the 1% rule (rent ≥ 1% of price), the offer needs to be $184k (12.0% below list).
- Recommended offer: $184k (12.0% below list) — sets the bar for 1% rule.
- Cap rate 7.5% vs local median 4.7% in Bartlesville — top-decile yield for the area; either an underpriced asset or a hidden risk that comps aren't pricing in. Stress-test before assuming the spread holds.
Location & tenants
- Location reads 64/100 on livability (#175 in OK) — a middle-class / working-renter tenant base. Strengths: cost of living A+, housing A+; Watch: employment C-, crime D+, amenities F.
- Bartlesville (town): math 30% / reading 29% proficiency, ranked #59 of 270 in OK (top 22%) — low school quality limits family demand, transient renter base, plan for 1-2y turnover.
- Zoned schools: Ranch Heights Es (math 37% / reading 30%, grade F, #205 of 845 statewide, top 25%, 616 students, 0% FRL); Madison Ms (math 19% / reading 23%, grade F, #149 of 345 statewide, top 44%, 732 students, 0% FRL); Bartlesville Hs (math 38% / reading 45%, grade F, #23 of 447 statewide, top 5%, 1,642 students, 0% FRL) — zoned schools average 0% FRL vs 43% district-wide (43 pts lower); this property's tenant base skews higher-income than the district average.
- Market conditions: 234 active listings in the ZIP; 3 comparable units currently listed for rent nearby; rentals at typical pace (median 26d on market — plan ~3-4 weeks tenant-placement turnaround); 46 units permitted in Washington County in 2024 (0 in 5+ unit buildings).
- This rent runs 31% of the median local income ($72k/yr) — at the standard rent-burdened threshold; future hikes will face affordability resistance.
Forward outlook
- Local home prices are declining (-3.0%/yr); year-one equity from $1k of loan paydown is wiped out by about $6k of value loss. Plan a longer hold.
- Washington County population projected at +12% by 2050 — modest demand growth; plan on rents tracking national, not racing it.
Negotiation context
- It's been on market 74 days — a 6% lower offer ($196k) is reasonable based on typical stale-listing flexibility.
Risks & watch-outs
- Watch-outs: built in 1956 — expect roof / HVAC / electrical / plumbing capex.
- Climate carrying-cost: major wildfire risk; extreme-heat days projected 7→18/yr by 2055 (HVAC capex compounding) — expect insurance premiums to compound above CPI over the hold.
Questions for the listing agent
- It's been on market 74 days. Have you received any prior offers? Is the seller open to a 12% concession, seller financing, or rate buy-down credit?
- Built in 1956 — when were the roof, HVAC, electrical panel, plumbing, and water heater last replaced?
- Why hasn't it sold? Are there any deal-killer items the seller is aware of (foundation, flood, title, zoning, code violations)?
- Is there a deadline driving the sale (1031 exchange, divorce, estate, relocation)? That informs how much negotiation room exists.
- Schools are D-rated, which usually means shorter tenancies and higher turnover. Who's the typical renter profile here, and what's been the actual vacancy rate?
- Crime grade is D in this area — have there been break-ins, vandalism, or insurance claims at this property in the last 3 years? What carrier currently insures it and at what premium?
- What's the average days-on-market for RENTAL listings here right now (not sales)? A rising rental-DOM trend means longer vacancies and softer asking-rent achievability than the comps imply.
- What's the recent tenant-quality profile in this submarket — average credit score on applications, eviction rate, late-payment / NSF rate, and stable-employment percentage? A property-management company in the area should have these aggregated.
- How much new for-sale + rental construction is in the pipeline within 1–3 miles? Heavy new supply typically softens prices + rents 12–24 months out; constrained supply supports both.
Investment metrics
- 1% rule
- 0.88% ✗
- Cap rate
- 7.51%
- Cash-on-cash
- 4.35%
- DSCR
- 1.19
- GRM
- 9.5
CMA / ARV
- ARV (on-the-fly)
- $235,730
- Comps found
- 12
Show comp detail 12 sales within ~0.75 mi
| Address | Dist | Beds/Ba | Sqft | Sold | Price | $/sf | Match |
|---|---|---|---|---|---|---|---|
| 1801 Rolling Hills Pl | 0.59mi | 3/2.0 | 2,254 (+5%) | 1mo | $215,000 | $95 | 59 |
| 1613 Harned Dr | 0.61mi | 3/2.0 | 2,025 (-6%) | 2mo | $219,000 | $108 | 56 |
| 1410 Macklyn Ln | 0.69mi | 3/2.0 | 2,226 (+4%) | 2mo | $220,000 | $99 | 56 |
| 3717 Ravenwood Dr | 0.23mi | 4/3.5 (+1) | 2,402 (+12%) | 1mo | $180,000 | $75 | 53 |
| 1811 Putnam | 0.63mi | 3/2.0 | 1,976 (-8%) | 1mo | $250,100 | $127 | 53 |
| 1906 Rolling Hills Dr | 0.70mi | 4/2.0 (+1) | 2,057 (-4%) | 1mo | $255,400 | $124 | 51 |
| 1910 Roman St | 0.68mi | 3/2.0 | 1,969 (-8%) | 2mo | $289,000 | $147 | 49 |
| 1135 Meadow Ln | 0.63mi | 3/2.0 | 2,406 (+12%) | 1mo | $265,000 | $110 | 45 |
| 4610 Rolling Meadows Rd | 0.64mi | 4/2.5 (+1) | 2,301 (+7%) | 2mo | $235,000 | $102 | 45 |
| 1309 Harned Dr | 0.64mi | 4/2.5 (+1) | 2,353 (+10%) | 2mo | $310,000 | $132 | 41 |
| 1869 Putnam Dr | 0.67mi | 4/2.0 (+1) | 1,868 (-13%) | 1mo | $232,500 | $124 | 38 |
| 1222 Lariat Dr | 0.59mi | 4/2.5 (+1) | 2,452 (+14%) | 0mo | $265,000 | $108 | 37 |
Match score weights: distance 35% · size 25% · config 20% · recency 20%. Top-matched comps best support the ARV.
Projected returns pro-forma
-3.0% appreciation · 3.0% rent growth · sell at horizon
- IRR
- -9.6%
- Equity multiple
- 0.65×
- Total profit
- $-20,409
- Equity at exit
- $31,118
- IRR
- -0.2%
- Equity multiple
- 0.99×
- Total profit
- $-776
- Equity at exit
- $18,045
Cash invested: $58,436 (down + closing). Projections, not guarantees.
Landlord ↔ Tenant lean methodology
- Overall (STATE)
- 83 Strongly Landlord-Friendly
- State Oklahoma
- 83 Strongly Landlord-Friendly · R+20
- County
- — inherits STATE
- City
- — inherits STATE
ZIP-level market 74006
- Home prices YoY
- -33.2%
- Active inventory
- 234
- Price-to-rent
- 9.5×
Monthly cashflow live
- Estimated rent
- $1,837 medium interval (Pro) →
- Mortgage (P&I)
- −$1,094
- Tax from tax record
- −$57 /mo · $689/yr
- Insurance
- −$87
- HOA
- −$0
- Vacancy / Maint / Mgmt
- −$386
- Net cashflow
- $212
Break-even live
Sensitivity live
| Price | -10% $330 | -5% $271 | +0% $212 | +5% $153 | +10% $94 |
|---|---|---|---|---|---|
| Rent | -10% $67 | -5% $140 | +0% $212 | +5% $285 | +10% $357 |
| Rate | -1.0pp $317 | -0.5pp $265 | base $212 | +0.5pp $158 | +1.0pp $103 |
UW: 25.0% down · 7.5% · 30yr · 1.5% tax · 5.0% vac · 8.0% maint · 8.0% mgmt
Financing live
Cash to close
- Down payment
- $52,175
- Closing costs
- $6,261
- Reserves months
- —
- Total cash needed
- —
Loan-product check · same deal, 3 products live
Conventional
25% down · 7.5% · 30yr
- Down + closing
- —
- Monthly P&I
- —
- Monthly cashflow
- —
- DSCR
- —
- Eligible?
- —
Personal DTI + credit; lowest rate.
DSCR
20% down · 8.5% · 30yr
- Down + closing
- —
- Monthly P&I
- —
- Monthly cashflow
- —
- DSCR
- —
- Eligible?
- —
No personal income docs; deal must DSCR.
Hard money
10% down · 12.0% · 12mo
- Down + closing
- —
- Monthly P&I
- —
- Monthly cashflow
- —
- DSCR
- —
- Eligible?
- —
Short-term bridge; refi at stabilization.
Rent comps 3 comps
| Address | Beds | Baths | Sqft | Rent | $/sqft | DOM | Units | Dist |
|---|---|---|---|---|---|---|---|---|
| 3301 Sheridan Rd Bartlesville, OK | 3.0 | 3.0 | 2400 | $1,400 | $0.58 | 25d | 1 | 0.42mi |
| 3117 Stonewall Dr Bartlesville, OK | 4.0 | 3.0 | 1977 | $2,950 | $1.49 | 4d | 1 | 0.83mi |
| 5530 Colony Way Bartlesville, OK | 1.0–2.0 | 1.0–2.5 | 1176 | $1,399 | $1.19 | 25d | 4 | 1.34mi |
Listing history 3 events
-
2026-05-10price $208,700
-
2026-03-30price $218,000
-
2026-03-13$225,000 Active
ⓘ Source: listings_history table (triggers on properties + properties_extension) + one-shot
backfill from property_details.listing_events for pre-trigger history.
Tax reassessment forecast OK · Resets to sale price
- Current annual tax
- $689 · $57/mo
- Projected year-2 tax
- $1,878 · $157/mo
- Expected delta
- +$1,189/yr (+$99/mo · 172.6%)
ⓘ Screening estimate from a state-policy table — verify with the county assessor before closing.
Climate risk First Street
- Flood 1/10 Low FEMA zone X (unshaded) · 0% chance over 30 yrs
- Wildfire 6/10 Major
- Heat 6/10 Major 7 d/yr ≥111°F today · 18 d/yr by 30 yrs out
- Wind 2/10 Low 4% chance of damaging wind over 30 yrs
- Air quality 2/10 Low 2 unhealthy d/yr today · 2 by 30 yrs out
Nearby sold comps map
Loading sold comps map…
Walkable amenities ~0.75 mi
Loading nearby amenities…
Taxation est. · year 1
- Rental income
- $22,039
- − Mortgage interest
- −$11,690
- − Property taxes
- −$689
- − Insurance
- −$1,044
- − Repairs & maintenance
- −$1,763
- − Management
- −$1,763
- − Depreciation
- −$6,071
- Taxable loss
- −$982
- Est. tax savings @ 24.0%
- +$236
- After-tax cash flow
- $2,780/yr
For passive investors: Depreciation is non-cash, so a rental often shows a tax loss while cash-flowing — sheltering income. Rental losses are passive: they offset passive income freely, and up to $25,000/yr can offset ordinary (W-2) income if you actively participate and your MAGI is under $100k (phasing out to $0 by $150k); unused losses carry forward. On sale, claimed depreciation is recaptured at up to 25%, and gains may owe capital-gains tax (a 1031 exchange can defer both). Figures are a year-1 estimate at your 24.0% rate — not tax advice; consult a CPA.
Schools (NCES district)
- District
- Bartlesville
- NCES district ID
- 4003630
- Math proficiency
- 30% ▼ -13.00%
- Reading proficiency
- 29% ▼ -10.00%
- Median HH income
- $48,889
- Composite
- 25.69/100
- National rank
- #7389
- State rank
- #59 of 270 in OK
Livability — Bartlesville
- Score
- 64/100
- State rank
- #175
- US rank
- #13940
Category grades
Schools grade is shown separately in the Schools card above.
Census & demographics
- Census place
- Bartlesville, OK
- County
- Washington County · 41,935 people
- City population
- 41,935
- Metro
- Bartlesville, OK
- Population (ZIP)
- 27,911
- Household income
- $71,796
- Rent vs Own
- Severe rent burden
- 563.0
Population outlook (Washington County) Hauer SSP2
- Today (2025)
- 54,946 people
- By 2030
- 56,249 · +2.4%
- By 2040
- 58,867 · +7.1%
- By 2050
- 61,600 · +12.1%
- By 2075
- 69,355 · +26.2%
- By 2100
- 73,067 · +33.0%
Race, ethnicity, and origin ACS 2023
- Neighborhood character
- Predominantly White (74%)
- Race & ethnicity
- White 74% Two or more races 9% Native American 7% Hispanic / Latino 6% Asian 3% Black 3%
- Hispanic origin (detail)
- Mexican 5%
- Common ancestry
- Lithuanian 3% Slovak 2% Serbian 2%
- Foreign-born
- 5% · Canada, China, Vietnam
- Languages at home
- 93% English-only · Spanish 4% Vietnamese 1% Chinese 1%
Political lean MEDSL · Washington
- 2024 margin
- Solid R (+47.6) · D 25.0% · R 72.7% · Other 2.4%
- 2008→2024 swing
- -3.1pp toward R · 2008: -44.6pp · 2024: -47.6pp
- All cycles
- 2024: R+47.6 2020: R+48.0 2016: R+48.5 2012: R+47.8 2008: R+44.6
Not yet ingested
- Civics
- —
Market trends
- HPI YoY
- ▼ -118.35%
- Current HPI
- 237.9056
- Rent YoY
- —
- Metro
- Bartlesville, OK
- State GDP YoY
- ▲ 1.55%
- F500 in state
- 6
Industry mix (Fortune 500 HQ in OK)
| Industry | F500 HQs | Revenue |
|---|---|---|
| Energy | 3 | $48B |
|
||
Price history
-7.2% since first listed3 events — show timeline
- 2026-05-10 Price Changed $208,700 MLS Technology, Inc.
- 2026-03-30 Price Changed $218,000 MLS Technology, Inc.
- 2026-03-13 Listed $225,000 MLS Technology, Inc.
Property tax history
-0.1%/yrLatest (2025): $689 · -3.0% YoY. Source: county tax records.
Cash-flow waterfall
monthlySold comps — $/sqft
last 12 mo · ≤1 miLoading sold comps…