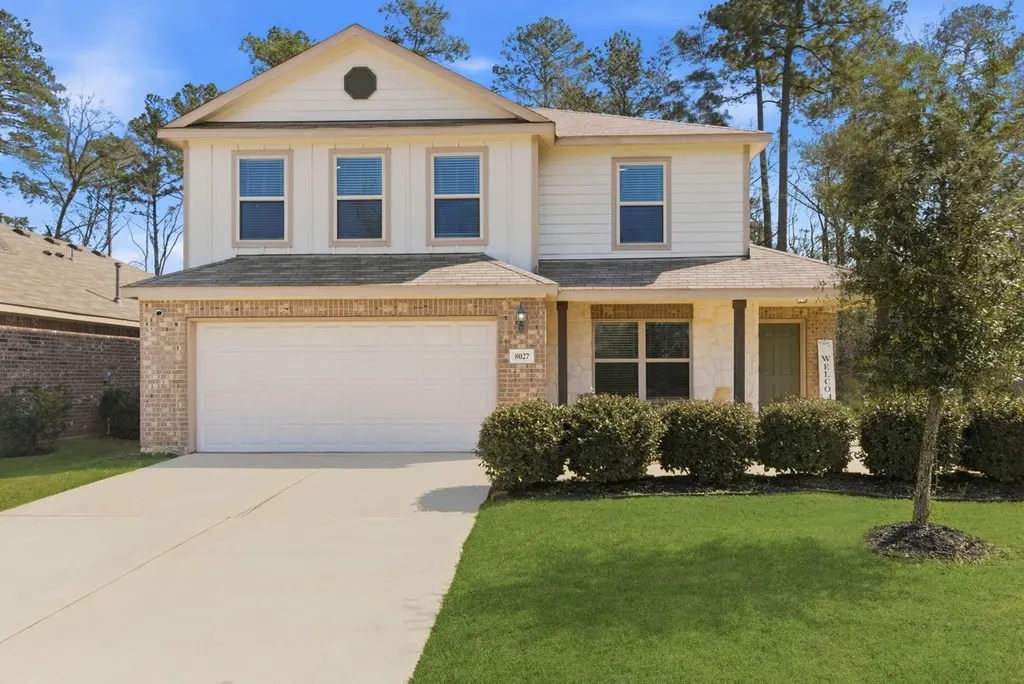
8027 Dauntless Dr · The Woodlands, TX
Flood risk 1/10 · Minimal
- FEMA flood zone
- X (shaded)
- Chance of flooding over 30 yrs
- 0.0%
- Est. flood insurance / yr
- $507 – $1,088
Fire risk 4/10 · Minor
- Est. fire insurance / yr
- $1,222 – $2,270
Heat risk 8/10 · Major
- Hot days now (above 111°F)
- 7 days/yr
- Hot days in 30 yrs
- 23 days/yr
Wind risk 8/10 · Major
- Chance of severe wind over 30 yrs
- 99.0%
Air-quality risk 2/10 · Minimal
- Unhealthy air days now
- 2 days/yr
- Unhealthy air days in 30 yrs
- 2 days/yr
Risk factors via First Street. Map © Google.
Why this score? — see what drove the D grade
The composite is a weighted blend of 9 inputs, each scored 0–100. Each bar is that input's sub-score; the figure is the points it added to the 100-point composite (weight × sub-score).
- Appreciation +10.0/10.0
- ARV discount +9.1/15.0
- Cash flow +5.5/30.0
- Livability +4.5/5.0
- Schools +3.9/10.0
- 1% rule +3.1/10.0
- Rent growth +2.6/5.0
- Condition / age +2.5/5.0
- DSCR +0.0/10.0
$300,000
🖨 Deal sheet (PDF) 📄 Offer letter ✓ Due diligence
Listing remarks
Assumable 3.25% interest rate available! Step into elevated living in this stunning home, featuring modern finishes throughout. The luxurious primary suite is conveniently located on the main level, offering privacy and comfort. At the heart of the home is a beautifully designed kitchen with a large center island, ample cabinetry, and refrigerator included. A flexible formal dining or office space provides added versatility to fit your lifestyle. Upstairs, you’ll find two spacious bedrooms with large walk-in closets, along with an oversized flex space ideal for a playroom, theater, or game room. Step outside to a covered patio and expansive backyard, perfect for relaxing, entertaining
Key facts
- Large center island
- Primary suite
- Serene pond
Tags
Property features AI
Finance
- Other: Lease not considered
- HOA & community: Community managed by Inframark; Annual association fee of $750; Community amenities include dog park, lake/pond, picnic area, playground, park, and trails
Exterior
- Parking: Attached 2-car garage; Driveway; Garage with door opener
- Security: Prewired for security; Leased security system; Smoke detectors
- Utilities: Public water; Public sewer
- Home design: Residential property; Northeast facing; Built in 2020; Slab foundation
- Construction: Brick and cement siding construction; Composition roof
- Exterior features: Deck; Patio; Fully fenced backyard; Back yard fencing; Corner lot; Subdivision setting; Pond on lot; Concrete road surface
Interior
- Kitchen: Dishwasher; Gas cooktop; Gas oven; Disposal; Microwave; Ice maker; Refrigerator; ENERGY STAR qualified appliances
- Bedrooms: Primary bedroom on the first floor (approx. 14 x 13); Two secondary bedrooms on the second floor (each approx. 12 x 12)
- Flooring: Carpet; Laminate
- Bathrooms: 2 full bathrooms; 1 half bathroom
- Heating & cooling: Central heating (electric); Central air (electric)
- Interior features: Double vanity; Kitchen island; Kitchen/family room combo; Primary bathroom; Pantry; Tub/shower; Vanity; Vaulted ceilings; Ceiling fans; Kitchen/dining combo; Programmable thermostat
- Laundry & utility: Washer hookup; Electric dryer hookup
Neighborhood map
What this means for you Summary
Snapshot
- This is a 3-bed/2.5-bath single-family listed at $300k.
Deal economics
- At list price, monthly cash flow is $-635 ($-8k/yr) — negative.
- To cash-flow at today's rent, offer at most $188k (37.4% below list).
- To meet the 1% rule (rent ≥ 1% of price), the offer needs to be $242k (19.4% below list).
- Recommended offer: $188k (37.4% below list) — sets the bar for cash-flow.
- Cap rate 3.8% vs local median 2.3% in The Woodlands — top-decile yield for the area; either an underpriced asset or a hidden risk that comps aren't pricing in. Stress-test before assuming the spread holds.
Location & tenants
- Location reads 91/100 on livability (#1 in TX, #47 nationally) — a professional / high-income tenant draw. Strengths: amenities A+, commute A+, employment A+; Watch: cost of living D-.
- Magnolia ISD (rural): math 42% / reading 45% proficiency, ranked #247 of 826 in TX (top 30%) — families likely to look elsewhere, expect single-tenant / working-renter base with shorter leases.
- Zoned schools: Tom R Ellisor El (math 44% / reading 44%, grade F, #1,243 of 4,322 statewide, top 29%, 492 students, 40% FRL); Bear Branch J H (math 44% / reading 46%, grade D, #479 of 1,662 statewide, top 29%, 1,076 students, 37% FRL); Magnolia H S (math 47% / reading 62%, grade C-, #379 of 1,632 statewide, top 26%, 2,248 students, 31% FRL) — zoned schools at 36% FRL track the district average.
- Market conditions: Rents flat; 1622 active listings in the ZIP; 6 comparable units currently listed for rent nearby; rentals at typical pace (median 26d on market — plan ~3-4 weeks tenant-placement turnaround); high-income renter base; 13,259 units permitted in Montgomery County in 2024 (1,402 in 5+ unit buildings).
Forward outlook
- In year one you build about $32k of equity ($2k loan paydown + $30k appreciation (10.0% local appreciation)).
- Montgomery County population projected at +65% by 2050 — long-run rental-demand tailwind backs the buy-and-hold thesis.
- By year 2, paydown + projected appreciation supports a ~$52k cash-out refi (75% LTV) — recoverable capital for the next deal without selling this one.
Negotiation context
- It's been on market 26 days — a 2% lower offer ($296k) is reasonable based on typical stale-listing flexibility.
- 5 sale attempts with the ask held roughly flat each time — persistent listings suggest the price (not the market) is what's stuck; bring a comps-based counter.
Risks & watch-outs
- Watch-outs: property tax is 3.1% of price.
- Climate carrying-cost: severe wind risk, 99% chance of damaging wind over 30y; extreme-heat days projected 7→23/yr by 2055 (HVAC capex compounding) — expect insurance premiums to compound above CPI over the hold.
Questions for the listing agent
- What do current leases actually rent for vs. the listed asking? Can we see a recent rent roll and the last 12 months of T-12 income?
- Property tax is high relative to price — has the assessment been appealed recently, and will the sale trigger a re-assessment?
- What does the HOA fee cover, when was the last increase, and are there any pending special assessments or reserve-fund shortfalls?
- Is there a deadline driving the sale (1031 exchange, divorce, estate, relocation)? That informs how much negotiation room exists.
- Schools are A-rated — typically a magnet for longer-tenancy family renters. What's the average tenant stay here, and is there a school-zone premium baked into asking?
- The area grade is low — what's the realistic commute time and amenity access for the typical tenant pool here? Any planned neighborhood developments (good or bad) we should know about?
- What's the average days-on-market for RENTAL listings here right now (not sales)? A rising rental-DOM trend means longer vacancies and softer asking-rent achievability than the comps imply.
- What's the recent tenant-quality profile in this submarket — average credit score on applications, eviction rate, late-payment / NSF rate, and stable-employment percentage? A property-management company in the area should have these aggregated.
- How much new for-sale + rental construction is in the pipeline within 1–3 miles? Heavy new supply typically softens prices + rents 12–24 months out; constrained supply supports both.
Investment metrics
- 1% rule
- 0.81% ✗
- Cap rate
- 3.75%
- Cash-on-cash
- -9.07%
- DSCR
- 0.60
- GRM
- 10.3
CMA / ARV
- ARV (median comp)
- $310,802
- List price
- $300,000
- Delta
- 1.35%
- Verdict
- FAIR
- Comps
- 20 within 1.0 mi
Show comp detail 12 sales within ~0.75 mi
| Address | Dist | Beds/Ba | Sqft | Sold | Price | $/sf | Match |
|---|---|---|---|---|---|---|---|
| 8023 Heroes Hall Dr | 0.11mi | 4/2.5 (+1) | 2,260 (-1%) | 4mo | $324,900 | $144 | 85 |
| 279 Brazen Forest Trl | 0.19mi | 4/2.5 (+1) | 2,178 (-4%) | 3mo | $309,900 | $142 | 76 |
| 205 Valiant Ridge Trl | 0.16mi | 3/2.5 | 1,952 (-14%) | 3mo | $294,900 | $151 | 66 |
| 287 Brazen Forest Trl | 0.18mi | 3/2.5 | 1,952 (-14%) | 4mo | $284,900 | $146 | 64 |
| 27026 Golden Knoll Dr | 0.60mi | 3/2.5 | 2,162 (-5%) | 0mo | $465,000 | $215 | 63 |
| 8121 Tyrell Heights Dr | 0.65mi | 3/2.0 | 2,251 (-1%) | 4mo | $419,900 | $187 | 62 |
| 27001 Strake Ln | 0.56mi | 4/2.5 (+1) | 2,388 (+5%) | 2mo | $399,000 | $167 | 60 |
| 106 Alset Cir | 0.28mi | 3/2.5 | 1,952 (-14%) | 4mo | $314,900 | $161 | 60 |
| 16 Florentino Vine Pl | 0.60mi | 3/2.0 | 2,050 (-10%) | 2mo | $420,000 | $205 | 51 |
| 7827 Bergamot Cir | 0.57mi | 3/2.5 | 1,952 (-14%) | 1mo | $299,900 | $154 | 49 |
| 7914 Pershing Ave | 0.45mi | 4/3.0 (+1) | 1,968 (-14%) | 2mo | $389,900 | $198 | 48 |
| 7845 Charter Hill Dr | 0.61mi | 4/3.0 (+1) | 2,529 (+11%) | 2mo | $449,900 | $178 | 44 |
Match score weights: distance 35% · size 25% · config 20% · recency 20%. Top-matched comps best support the ARV.
Projected returns pro-forma
10.0% appreciation · 0.32% rent growth · sell at horizon
- IRR
- 17.1%
- Equity multiple
- 2.39×
- Total profit
- $116,915
- Equity at exit
- $270,264
- IRR
- 15.7%
- Equity multiple
- 5.35×
- Total profit
- $365,236
- Equity at exit
- $582,834
Cash invested: $84,000 (down + closing). Projections, not guarantees.
Landlord ↔ Tenant lean methodology
- Overall (STATE)
- 87 Strongly Landlord-Friendly
- State Texas
- 87 Strongly Landlord-Friendly · R+5
- County
- — inherits STATE
- City
- — inherits STATE
ZIP-level market 77354
- Home prices YoY
- 2.4%
- Rents YoY
- 0.3%
- Active inventory
- 1622
- Price-to-rent
- 10.3×
Monthly cashflow live
- Estimated rent
- $2,417 high interval (Pro) →
- Mortgage (P&I)
- −$1,573
- Tax from tax record
- −$783 /mo · $9,396/yr
- Insurance
- −$125
- HOA
- −$63
- Vacancy / Maint / Mgmt
- −$507
- Net cashflow
- $-635
Break-even live
Sensitivity live
| Price | -10% $-465 | -5% $-550 | +0% $-635 | +5% $-720 | +10% $-805 |
|---|---|---|---|---|---|
| Rent | -10% $-826 | -5% $-731 | +0% $-635 | +5% $-540 | +10% $-444 |
| Rate | -1.0pp $-484 | -0.5pp $-559 | base $-635 | +0.5pp $-713 | +1.0pp $-792 |
UW: 25.0% down · 7.5% · 30yr · 1.5% tax · 5.0% vac · 8.0% maint · 8.0% mgmt
Financing live
Cash to close
- Down payment
- $75,000
- Closing costs
- $9,000
- Reserves months
- —
- Total cash needed
- —
Loan-product check · same deal, 3 products live
Conventional
25% down · 7.5% · 30yr
- Down + closing
- —
- Monthly P&I
- —
- Monthly cashflow
- —
- DSCR
- —
- Eligible?
- —
Personal DTI + credit; lowest rate.
DSCR
20% down · 8.5% · 30yr
- Down + closing
- —
- Monthly P&I
- —
- Monthly cashflow
- —
- DSCR
- —
- Eligible?
- —
No personal income docs; deal must DSCR.
Hard money
10% down · 12.0% · 12mo
- Down + closing
- —
- Monthly P&I
- —
- Monthly cashflow
- —
- DSCR
- —
- Eligible?
- —
Short-term bridge; refi at stabilization.
Rent comps 6 comps
| Address | Beds | Baths | Sqft | Rent | $/sqft | DOM | Units | Dist |
|---|---|---|---|---|---|---|---|---|
| 131 Valiant Ridge Trl Magnolia, TX | 4.0 | 2.0 | 1840 | $2,280 | $1.24 | 0d | 1 | 0.21mi |
| 7910 Alset Dr Magnolia, TX | 4.0 | 3.0 | 1897 | $2,320 | $1.22 | 45d | 1 | 0.27mi |
| 139 Hawkhurst Cir Magnolia, TX | 4.0 | 3.0 | 2563 | $2,950 | $1.15 | 26d | 1 | 1.10mi |
| 146 Black Swan Pl Magnolia, TX | 4.0 | 3.0 | 2535 | $2,495 | $0.98 | 24d | 1 | 1.23mi |
| 79 W Shale Creek Cir Spring, TX | 4.0 | 3.5 | 2918 | $4,500 | $1.54 | 45d | 1 | 1.25mi |
| 29980 Farm to Market Road 2978 Unit 3228 Magnolia, TX | 3.0 | 2.0 | 1578 | $2,320 | $1.47 | 0d | 1 | 1.49mi |
HOA detail
- Monthly dues
- $63 · $756/yr
Listing history 23 events
-
2026-06-21days on market $300,000 Active 26 DOM
-
2026-06-18days on market $300,000 Active 23 DOM
-
2026-06-17days on market $300,000 Active 22 DOM
-
2026-06-16days on market $300,000 Active 21 DOM
-
2026-06-15days on market $300,000 Active 20 DOM
-
2026-06-13days on market $300,000 Active 18 DOM
-
2026-06-10price $300,000 Active 14 DOM
-
2026-06-09days on market $299,990 Active 14 DOM
-
2026-06-08days on market $299,990 Active 13 DOM
-
2026-06-07days on market $299,990 Active 12 DOM
-
2026-06-04days on market $299,990 Active 9 DOM
-
2026-06-03days on market $299,990 Active 8 DOM
-
2026-06-02days on market $299,990 Active 7 DOM
-
2026-06-01days on market $299,990 Active 6 DOM
-
2026-05-31days on market $299,990 Active 5 DOM
-
2026-05-14$2,450
-
2026-05-13historical $2,450
-
2026-04-08$314,990 Active 968-char remark
-
2026-04-02$2,450
-
2026-04-01historical $2,450
-
2026-03-24price $2,450
-
2026-03-09price $2,500
-
2026-02-26$2,600
ⓘ Source: listings_history table (triggers on properties + properties_extension) + one-shot
backfill from property_details.listing_events for pre-trigger history.
Tax reassessment forecast TX · Resets to sale price
- Current annual tax
- $9,396 · $783/mo
- Projected year-2 tax
- $9,396 · $783/mo
- Expected delta
- $0/yr ($0/mo · 0.0%)
ⓘ Screening estimate from a state-policy table — verify with the county assessor before closing.
Climate risk First Street
- Flood 1/10 Low FEMA zone X (shaded) · 0% chance over 30 yrs
- Wildfire 4/10 Moderate
- Heat 8/10 Severe 7 d/yr ≥111°F today · 23 d/yr by 30 yrs out
- Wind 8/10 Severe 99% chance of damaging wind over 30 yrs
- Air quality 2/10 Low 2 unhealthy d/yr today · 2 by 30 yrs out
Nearby sold comps map
Loading sold comps map…
Walkable amenities ~0.75 mi
Loading nearby amenities…
Taxation est. · year 1
- Rental income
- $28,999
- − Mortgage interest
- −$16,805
- − Property taxes
- −$9,396
- − Insurance
- −$1,500
- − Repairs & maintenance
- −$2,320
- − Management
- −$2,320
- − HOA
- −$756
- − Depreciation
- −$8,727
- Taxable loss
- −$12,825
- Est. tax savings @ 24.0%
- +$3,078
- After-tax cash flow
- $-4,544/yr
For passive investors: Depreciation is non-cash, so a rental often shows a tax loss while cash-flowing — sheltering income. Rental losses are passive: they offset passive income freely, and up to $25,000/yr can offset ordinary (W-2) income if you actively participate and your MAGI is under $100k (phasing out to $0 by $150k); unused losses carry forward. On sale, claimed depreciation is recaptured at up to 25%, and gains may owe capital-gains tax (a 1031 exchange can defer both). Figures are a year-1 estimate at your 24.0% rate — not tax advice; consult a CPA.
Schools (NCES district)
- District
- Magnolia ISD
- NCES district ID
- 4828740
- Math proficiency
- 42% ▼ -7.00%
- Reading proficiency
- 45% ▼ -4.00%
- Median HH income
- $71,692
- Composite
- 39.46/100
- National rank
- #3958
- State rank
- #247 of 826 in TX
Livability — The Woodlands
- Score
- 91/100
- State rank
- #1
- US rank
- #47
Category grades
Schools grade is shown separately in the Schools card above.
Census & demographics
- County
- Montgomery County · 663,713 people
- Metro
- Houston-The Woodlands-Sugar Land, TX
- Population (ZIP)
- 44,900
- Household income
- $112,504
- Rent vs Own
- Severe rent burden
- 586.0
Population outlook (Montgomery County) Hauer SSP2
- Today (2025)
- 713,896 people
- By 2030
- 805,263 · +12.8%
- By 2040
- 992,708 · +39.1%
- By 2050
- 1,179,590 · +65.2%
- By 2075
- 1,628,084 · +128.1%
- By 2100
- 1,937,880 · +171.5%
Race, ethnicity, and origin ACS 2023
- Neighborhood character
- Predominantly White (66%)
- Race & ethnicity
- White 66% Hispanic / Latino 25% Two or more races 18% Black 3% Asian 1%
- Hispanic origin (detail)
- Mexican 14% Puerto Rican 1%
- Common ancestry
- Lithuanian 4% Slovak 2% Italian 2%
- Foreign-born
- 11% · Canada, Vietnam
- Languages at home
- 83% English-only · Spanish 15% Other Indo-European 1% German/W. Germanic 1%
Political lean MEDSL · Montgomery
- 2024 margin
- Solid R (+45.5) · D 26.8% · R 72.3%
- 2008→2024 swing
- +7.2pp toward D · 2008: -52.7pp · 2024: -45.5pp
- All cycles
- 2024: R+45.5 2020: R+43.8 2016: R+51.4 2012: R+60.7 2008: R+52.7
Not yet ingested
- Civics
- —
Market trends
- HPI YoY
- ▲ 12.09%
- Current HPI
- 512.87
- Rent YoY
- ▲ 0.32%
- Metro
- Houston-The Woodlands-Sugar Land, TX
- State GDP YoY
- ▲ 3.95%
- F500 in state
- 110
Industry mix (Fortune 500 HQ in TX)
| Industry | F500 HQs | Revenue |
|---|---|---|
| Energy | 16 | $1,198B |
|
||
| Technology | 5 | $198B |
|
||
| Engineering / Construction | 4 | $72B |
|
||
| Energy Services | 3 | $60B |
|
||
| Utilities | 3 | $41B |
|
||
| Healthcare | 2 | $330B |
|
||
Price history
+11438.5% since first listed12 events — show timeline
- 2026-06-09 Price Changed $300,000 HARMLS
- 2026-05-26 Rental Removed $2,450 HARMLS
- 2026-05-26 Listing Removed — HARMLS
- 2026-05-26 Listed $299,990 HARMLS
- 2026-05-14 Listed for Rent $2,450 HARMLS
- 2026-05-13 Rental Removed $2,450 HARMLS
- 2026-04-08 Listed $314,990 HARMLS
- 2026-04-02 Listed for Rent $2,450 HARMLS
- 2026-04-01 Rental Removed $2,450 HARMLS
- 2026-03-24 Price Changed $2,450 HARMLS
- 2026-03-09 Price Changed $2,500 HARMLS
- 2026-02-26 Listed for Rent $2,600 HARMLS
Property tax history
+7.6%/yrLatest (2025): $9,396 · -7.6% YoY. Source: county tax records.
Cash-flow waterfall
monthlySold comps — $/sqft
last 12 mo · ≤1 miLoading sold comps…