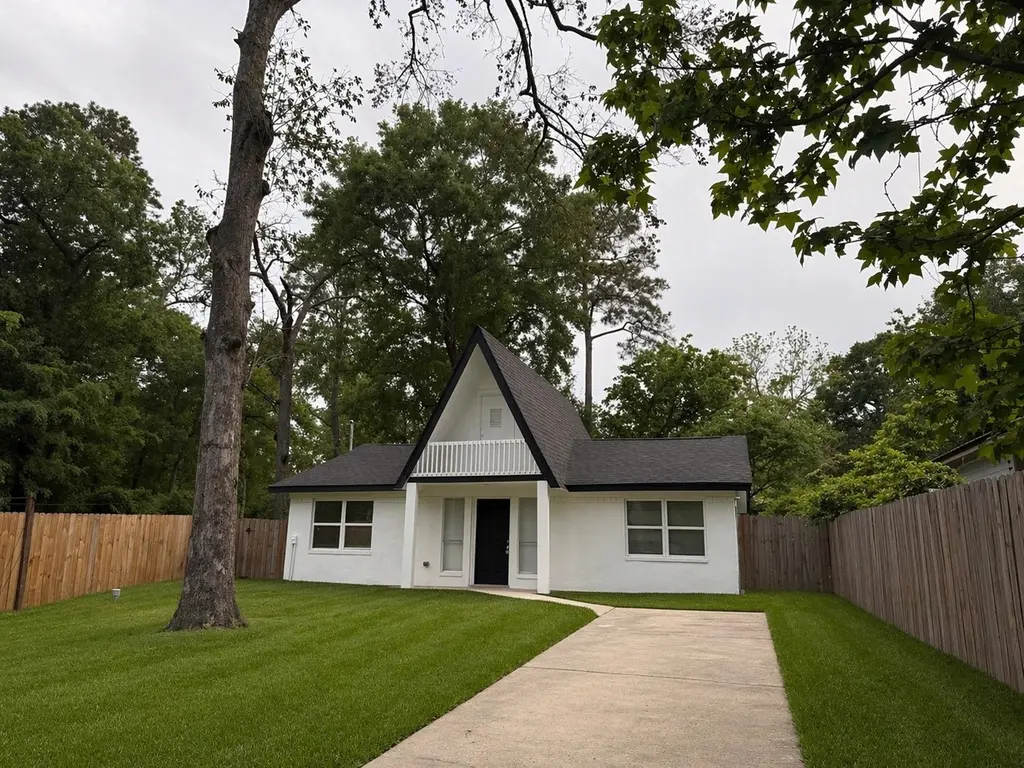
408 Commanche Rd · Conroe, TX
Flood risk 1/10 · Minimal
- FEMA flood zone
- X (unshaded)
- Chance of flooding over 30 yrs
- 0.0%
- Est. flood insurance / yr
- $507 – $1,088
Fire risk 2/10 · Minimal
- Est. fire insurance / yr
- $1,222 – $2,270
Heat risk 8/10 · Major
- Hot days now (above 111°F)
- 7 days/yr
- Hot days in 30 yrs
- 24 days/yr
Wind risk 8/10 · Major
- Chance of severe wind over 30 yrs
- 99.0%
Air-quality risk 2/10 · Minimal
- Unhealthy air days now
- 1 days/yr
- Unhealthy air days in 30 yrs
- 1 days/yr
Risk factors via First Street. Map © Google.
Why this score? — see what drove the C- grade
The composite is a weighted blend of 9 inputs, each scored 0–100. Each bar is that input's sub-score; the figure is the points it added to the 100-point composite (weight × sub-score).
- Cash flow +19.1/30.0
- ARV discount +7.9/15.0
- DSCR +6.0/10.0
- Schools +5.4/10.0
- 1% rule +4.8/10.0
- Livability +3.7/5.0
- Rent growth +2.6/5.0
- Condition / age +2.5/5.0
- Appreciation +0.0/10.0
$219,400
🖨 Deal sheet 📄 Offer letter ✓ Due diligence
Listing remarks MLS
Beautifully updated waterfront home offering a perfect blend of modern comfort and serene living. Enjoy peaceful water views from your backyard, creating a true retreat atmosphere. Features an open, inviting layout with stylish upgrades throughout—ideal for relaxing or entertaining. Unwind with stunning sunsets and experience the privacy and natural beauty this property offers, all while being conveniently located near everything Conroe has to offer.
Key facts
- Waterfront home
- Open inviting layout
- Conveniently located
Tags
Neighborhood map
What this means for you Summary
Snapshot
- This is a 3-bed/2.0-bath single-family listed at $219k.
Deal economics
- At list price, monthly cash flow is $233 ($3k/yr) — positive.
- The deal already cash-flows at list — no discount required.
- To meet the 1% rule (rent ≥ 1% of price), the offer needs to be $214k (2.4% below list).
- Recommended offer: $206k (6.0% below list) — sets the bar for market timing.
- Cap rate 7.6% vs local median 3.1% in Conroe — top-decile yield for the area; either an underpriced asset or a hidden risk that comps aren't pricing in. Stress-test before assuming the spread holds.
Location & tenants
- Location reads 74/100 on livability (#169 in TX, #4,447 nationally) — a middle-class / working-renter tenant base. Strengths: cost of living A+, housing A+, amenities B; Watch: schools D+, commute F, health & safety F.
- Montgomery ISD (rural): math 63% / reading 57% proficiency, ranked #49 of 826 in TX (top 6%) — acceptable for families but not a draw, mixed tenant base, ~2y average lease.
- Market conditions: Rents flat; 2283 active listings in the ZIP; 17 comparable units currently listed for rent nearby; rentals lingering (median 44d on market — plan ~5-8 weeks vacancy on turnover, expect pricing pressure); 71% of comp listings sitting > 30 days — soft ceiling on asking rent; high-income renter base; 13,259 units permitted in Montgomery County in 2024 (1,402 in 5+ unit buildings).
Forward outlook
- Local home prices are declining (-3.0%/yr); year-one equity from $2k of loan paydown is wiped out by about $7k of value loss. Plan a longer hold.
- Montgomery County population projected at +65% by 2050 — long-run rental-demand tailwind backs the buy-and-hold thesis.
Negotiation context
- It's been on market 68 days — a 6% lower offer ($206k) is reasonable based on typical stale-listing flexibility.
- 9 sale attempts since 5y ago; this cycle's ask has dropped $20k (8%) from the opening price — seller is motivated, your offer sets the floor, not the list.
Risks & watch-outs
- Climate carrying-cost: severe wind risk, 99% chance of damaging wind over 30y; extreme-heat days projected 7→24/yr by 2055 (HVAC capex compounding) — expect insurance premiums to compound above CPI over the hold.
Questions for the listing agent
- It's been on market 68 days. Have you received any prior offers? Is the seller open to a 6% concession, seller financing, or rate buy-down credit?
- Built in 1970 — when were the roof, HVAC, electrical panel, plumbing, and water heater last replaced?
- Why hasn't it sold? Are there any deal-killer items the seller is aware of (foundation, flood, title, zoning, code violations)?
- Is there a deadline driving the sale (1031 exchange, divorce, estate, relocation)? That informs how much negotiation room exists.
- Schools are D-rated, which usually means shorter tenancies and higher turnover. Who's the typical renter profile here, and what's been the actual vacancy rate?
- What's the average days-on-market for RENTAL listings here right now (not sales)? A rising rental-DOM trend means longer vacancies and softer asking-rent achievability than the comps imply.
- What's the recent tenant-quality profile in this submarket — average credit score on applications, eviction rate, late-payment / NSF rate, and stable-employment percentage? A property-management company in the area should have these aggregated.
- How much new for-sale + rental construction is in the pipeline within 1–3 miles? Heavy new supply typically softens prices + rents 12–24 months out; constrained supply supports both.
Investment metrics
- 1% rule
- 0.98% ✗
- Cap rate
- 7.57%
- Cash-on-cash
- 4.55%
- DSCR
- 1.20
- GRM
- 8.5
CMA / ARV
- ARV (median comp)
- $221,190
- List price
- $219,400
- Delta
- -0.81%
- Verdict
- FAIR
- Comps
- 20 within 1.0 mi
Show comp detail 12 sales within ~0.75 mi
| Address | Dist | Beds/Ba | Sqft | Sold | Price | $/sf | Match |
|---|---|---|---|---|---|---|---|
| 508 Navajo Dr | 0.24mi | 2/2.0 (-1) | 1,408 (-3%) | 1mo | $234,990 | $167 | 78 |
| 517 Chickasaw Dr | 0.11mi | 3/2.0 | 1,301 (-10%) | 2mo | $229,900 | $177 | 76 |
| 1006 Franconia Dr | 0.50mi | 3/2.0 | 1,423 (-2%) | 4mo | $225,000 | $158 | 70 |
| 408 Pimmit Hill Run | 0.37mi | 3/2.0 | 1,296 (-11%) | 0mo | $200,000 | $154 | 65 |
| 705 Little River Dr | 0.49mi | 3/2.5 | 1,365 (-6%) | 4mo | $199,900 | $146 | 62 |
| 119 Delaware Dr | 0.36mi | 2/1.5 (-1) | 1,350 (-7%) | 5mo | $189,500 | $140 | 61 |
| 109 Moonspinner | 0.43mi | 3/2.0 | 1,579 (+9%) | 6mo | $225,000 | $142 | 60 |
| 1014 Platte River Dr | 0.68mi | 4/2.0 (+1) | 1,444 (-0%) | 3mo | $164,000 | $114 | 60 |
| 1007 W Cedar River Rd | 0.54mi | 3/2.0 | 1,585 (+9%) | 0mo | $275,000 | $174 | 59 |
| 112 Quiet Wind Dr | 0.46mi | 3/2.0 | 1,654 (+14%) | 1mo | $258,000 | $156 | 54 |
| 127 Golfview Dr | 0.49mi | 3/2.0 | 1,238 (-15%) | 2mo | $189,900 | $153 | 51 |
| 89 Dawns Edge Dr | 0.63mi | 3/2.5 | 1,609 (+11%) | 3mo | $270,000 | $168 | 47 |
Match score weights: distance 35% · size 25% · config 20% · recency 20%. Top-matched comps best support the ARV.
Projected returns pro-forma
-3.0% appreciation · 0.4% rent growth · sell at horizon
- IRR
- -12.1%
- Equity multiple
- 0.57×
- Total profit
- $-26,193
- Equity at exit
- $32,713
- IRR
- -7.2%
- Equity multiple
- 0.59×
- Total profit
- $-25,007
- Equity at exit
- $18,970
Cash invested: $61,432 (down + closing). Projections, not guarantees.
Landlord ↔ Tenant lean methodology
- Overall (STATE)
- 87 Strongly Landlord-Friendly
- State Texas
- 87 Strongly Landlord-Friendly · R+5
- County
- — inherits STATE
- City
- — inherits STATE
ZIP-level market 77316
- Home prices YoY
- -10.7%
- Rents YoY
- 0.4%
- Active inventory
- 2283
- Price-to-rent
- 8.5×
Monthly cashflow live
- Estimated rent
- $2,142 high interval (Pro) →
- Mortgage (P&I)
- −$1,151
- Tax from tax record
- −$218 /mo · $2,612/yr
- Insurance
- −$91
- HOA
- −$0
- Vacancy / Maint / Mgmt
- −$450
- Net cashflow
- $233
Break-even live
UW: 25.0% down · 7.5% · 30yr · 1.5% tax · 5.0% vac · 8.0% maint · 8.0% mgmt
Financing live
Cash to close
- Down payment
- $54,850
- Closing costs
- $6,582
- Reserves months
- —
- Total cash needed
- —
Loan-product check · same deal, 3 products live
Conventional
25% down · 7.5% · 30yr
- Down + closing
- —
- Monthly P&I
- —
- Monthly cashflow
- —
- DSCR
- —
- Eligible?
- —
Personal DTI + credit; lowest rate.
DSCR
20% down · 8.5% · 30yr
- Down + closing
- —
- Monthly P&I
- —
- Monthly cashflow
- —
- DSCR
- —
- Eligible?
- —
No personal income docs; deal must DSCR.
Hard money
10% down · 12.0% · 12mo
- Down + closing
- —
- Monthly P&I
- —
- Monthly cashflow
- —
- DSCR
- —
- Eligible?
- —
Short-term bridge; refi at stabilization.
Rent comps 17 comps
| Address | Beds | Baths | Sqft | Rent | $/sqft | DOM | Units | Dist |
|---|---|---|---|---|---|---|---|---|
| 702 Crystal River Rd Montgomery, TX | 4.0 | 2.5 | 1820 | $4,000 | $2.20 | 43d | 1 | 0.45mi |
| 15 April Vlg Montgomery, TX | 2.0 | 2.0 | 1218 | $1,650 | $1.35 | 43d | 1 | 0.91mi |
| 16928 Kempwood Montgomery, TX | 3.0 | 2.0 | 1100 | $1,450 | $1.32 | 43d | 1 | 0.97mi |
| 16913 Glenheath Montgomery, TX | 4.0 | 2.5 | 1700 | $1,571 | $0.92 | 43d | 1 | 1.01mi |
| 16967 W Ivanhoe Montgomery, TX | 3.0 | 2.0 | 1012 | $1,350 | $1.33 | 12d | 1 | 1.04mi |
| 16984 W Juneau Montgomery, TX | 3.0 | 3.0 | 1530 | $2,900 | $1.90 | 43d | 1 | 1.05mi |
| 16915 Balmoral Montgomery, TX | 3.0 | 2.0 | 1200 | $1,200 | $1.00 | 43d | 1 | 1.08mi |
| 116 Lake View Cir Montgomery, TX | 3.0 | 2.5 | 1751 | $2,250 | $1.28 | 43d | 1 | 1.11mi |
| 15310 Abella Dr Montgomery, TX | 3.0 | 2.0 | 1412 | $1,720 | $1.22 | 1d | 1 | 1.13mi |
| 124 April Point Dr S #124 Montgomery, TX | 2.0 | 1.0 | 1300 | $1,490 | $1.15 | 20d | 1 | 1.19mi |
| 135 April Point Dr N Montgomery, TX | 3.0 | 3.0 | 1624 | $1,900 | $1.17 | 43d | 1 | 1.19mi |
| 613 Craven St Montgomery, TX | 3.0 | 2.0 | 1716 | $1,610 | $0.94 | 43d | 1 | 1.23mi |
| 130 April Point Dr N Montgomery, TX | 3.0 | 3.0 | 1680 | $2,250 | $1.34 | 43d | 1 | 1.23mi |
| 124 April Point Dr N Montgomery, TX | 4.0 | 3.0 | 1624 | $2,900 | $1.79 | 43d | 1 | 1.26mi |
| 298 Capetown Way Unit A Montgomery, TX | 2.0 | 1.5 | 1100 | $1,400 | $1.27 | 43d | 1 | 1.35mi |
| 583 Firemoon St Montgomery, TX | 3.0 | 2.0 | 1412 | $1,650 | $1.17 | 20d | 1 | 1.41mi |
| 4777 Holly Ln W Montgomery, TX | 3.0 | 2.0 | 1704 | $1,450 | $0.85 | 18d | 1 | 1.43mi |
Listing history 41 events
-
2026-06-18days on market $219,400 Active 68 DOM
-
2026-06-17days on market $219,400 Active 67 DOM
-
2026-06-16days on market $219,400 Active 66 DOM
-
2026-06-15days on market $219,400 Active 65 DOM
-
2026-06-13days on market $219,400 Active 63 DOM
-
2026-06-13days on market $219,400 Active 62 DOM
-
2026-06-09days on market $219,400 Active 59 DOM
-
2026-06-08days on market $219,400 Active 58 DOM
-
2026-06-07pricedays on market $219,400 Active 57 DOM
-
2026-06-04days on market $224,000 Active 54 DOM
-
2026-06-03days on market $224,000 Active 53 DOM
-
2026-06-02days on market $224,000 Active 52 DOM
-
2026-06-01days on market $224,000 Active 51 DOM
-
2026-05-31days on market $224,000 Active 50 DOM
-
2026-04-30price $229,000 460-char remark
Show marketing remark (460 chars)
Beautifully updated waterfront home offering a perfect blend of modern comfort and serene living. Enjoy peaceful water views from your backyard, creating a true retreat atmosphere. Features an open, inviting layout with stylish upgrades throughout—ideal for relaxing or entertaining. Unwind with stunning sunsets and experience the privacy and natural beauty this property offers, all while being conveniently located near everything Conroe has to offer.
-
2026-04-11$239,000 Active 460-char remark
Show marketing remark (460 chars)
Beautifully updated waterfront home offering a perfect blend of modern comfort and serene living. Enjoy peaceful water views from your backyard, creating a true retreat atmosphere. Features an open, inviting layout with stylish upgrades throughout—ideal for relaxing or entertaining. Unwind with stunning sunsets and experience the privacy and natural beauty this property offers, all while being conveniently located near everything Conroe has to offer.
-
2026-01-08soldstatus
-
2025-10-09historical $1,700
-
2025-10-09historical
-
2025-09-03price $199,999
-
2025-08-22$1,700
-
2025-07-10$217,000 Active
-
2025-07-07historical
-
2025-02-04$220,000 Active
-
2024-04-18historical $1,500
-
2024-03-20$1,500
-
2024-03-20historical $1,390
-
2024-02-24price $1,390
-
2024-01-27price $1,500
-
2024-01-19price $1,600
-
2023-12-05$1,650
-
2022-12-09historical
-
2022-06-16historical
-
2022-04-01$219,000 Active
-
2021-06-29soldstatus
-
2021-06-27status Pending
-
2021-06-25soldstatus Sold
-
2021-06-21status Option Pending
-
2021-06-15status Active
-
2021-06-12status Option Pending
-
2021-06-08$99,900 Active
ⓘ Source: listings_history table (triggers on properties + properties_extension) + one-shot
backfill from property_details.listing_events for pre-trigger history.
Tax reassessment forecast TX · Resets to sale price
- Current annual tax
- $2,612 · $218/mo
- Projected year-2 tax
- $4,015 · $335/mo
- Expected delta
- +$1,403/yr (+$117/mo · 53.7%)
ⓘ Screening estimate from a state-policy table — verify with the county assessor before closing.
Climate risk First Street
- Flood 1/10 Low FEMA zone X (unshaded) · 0% chance over 30 yrs
- Wildfire 2/10 Low
- Heat 8/10 Severe 7 d/yr ≥111°F today · 24 d/yr by 30 yrs out
- Wind 8/10 Severe 99% chance of damaging wind over 30 yrs
- Air quality 2/10 Low 1 unhealthy d/yr today · 1 by 30 yrs out
Nearby sold comps map
Loading sold comps map…
Walkable amenities ~0.75 mi
Loading nearby amenities…
Taxation est. · year 1
- Rental income
- $25,707
- − Mortgage interest
- −$12,290
- − Property taxes
- −$2,612
- − Insurance
- −$1,097
- − Repairs & maintenance
- −$2,057
- − Management
- −$2,057
- − Depreciation
- −$6,383
- Taxable loss
- −$787
- Est. tax savings @ 24.0%
- +$189
- After-tax cash flow
- $2,982/yr
For passive investors: Depreciation is non-cash, so a rental often shows a tax loss while cash-flowing — sheltering income. Rental losses are passive: they offset passive income freely, and up to $25,000/yr can offset ordinary (W-2) income if you actively participate and your MAGI is under $100k (phasing out to $0 by $150k); unused losses carry forward. On sale, claimed depreciation is recaptured at up to 25%, and gains may owe capital-gains tax (a 1031 exchange can defer both). Figures are a year-1 estimate at your 24.0% rate — not tax advice; consult a CPA.
Schools (NCES district)
- District
- Montgomery ISD
- NCES district ID
- 4831260
- Math proficiency
- 63% ▼ -3.00%
- Reading proficiency
- 57% ▼ -3.00%
- Median HH income
- $75,596
- Composite
- 53.55/100
- National rank
- #1445
- State rank
- #49 of 826 in TX
Livability — Conroe
- Score
- 74/100
- State rank
- #169
- US rank
- #4447
Category grades
Schools grade is shown separately in the Schools card above.
Census & demographics
- Census place
- Conroe, TX
- County
- Montgomery County · 663,713 people
- City population
- 205,417
- Metro
- Houston-The Woodlands-Sugar Land, TX
- Population (ZIP)
- 34,694
- Household income
- $124,055
- Rent vs Own
- Severe rent burden
- 273.0
Population outlook (Montgomery County) Hauer SSP2
- Today (2025)
- 713,896 people
- By 2030
- 805,263 · +12.8%
- By 2040
- 992,708 · +39.1%
- By 2050
- 1,179,590 · +65.2%
- By 2075
- 1,628,084 · +128.1%
- By 2100
- 1,937,880 · +171.5%
Race, ethnicity, and origin ACS 2023
- Neighborhood character
- Predominantly White (80%)
- Race & ethnicity
- White 80% Hispanic / Latino 14% Two or more races 11% Black 1% Asian 1%
- Hispanic origin (detail)
- Mexican 9%
- Common ancestry
- Lithuanian 6% Slovak 3% Romanian 3%
- Foreign-born
- 6% · Canada
- Languages at home
- 90% English-only · Spanish 8%
Political lean MEDSL · Montgomery
- 2024 margin
- Solid R (+45.5) · D 26.8% · R 72.3%
- 2008→2024 swing
- +7.2pp toward D · 2008: -52.7pp · 2024: -45.5pp
- All cycles
- 2024: R+45.5 2020: R+43.8 2016: R+51.4 2012: R+60.7 2008: R+52.7
Not yet ingested
- Civics
- —
Market trends
- HPI YoY
- ▼ -31.44%
- Current HPI
- 262.6973
- Rent YoY
- ▲ 0.40%
- Metro
- Houston-The Woodlands-Sugar Land, TX
- State GDP YoY
- ▲ 3.95%
- F500 in state
- 110
Industry mix (Fortune 500 HQ in TX)
| Industry | F500 HQs | Revenue |
|---|---|---|
| Energy | 16 | $1,198B |
|
||
| Technology | 5 | $198B |
|
||
| Engineering / Construction | 4 | $72B |
|
||
| Energy Services | 3 | $60B |
|
||
| Utilities | 3 | $41B |
|
||
| Healthcare | 2 | $330B |
|
||
Price history
+129.2% since first listed27 events — show timeline
- 2026-04-30 Price Changed $229,000 HARMLS
- 2026-04-11 Listed $239,000 HARMLS
- 2026-01-08 Sold (Public Records) — Public Records
- 2025-10-09 Rental Removed $1,700 HARMLS
- 2025-10-09 Listing Removed — HARMLS
- 2025-09-03 Price Changed $199,999 HARMLS
- 2025-08-22 Listed for Rent $1,700 HARMLS
- 2025-07-10 Listed $217,000 HARMLS
- 2025-07-07 Listing Removed — HARMLS
- 2025-02-04 Listed $220,000 HARMLS
- 2024-04-18 Rental Removed $1,500 BUILDIUM
- 2024-03-20 Listed for Rent $1,500 BUILDIUM
- 2024-03-20 Rental Removed $1,390 HARMLS
- 2024-02-24 Price Changed $1,390 HARMLS
- 2024-01-27 Price Changed $1,500 HARMLS
- 2024-01-19 Price Changed $1,600 HARMLS
- 2023-12-05 Listed for Rent $1,650 HARMLS
- 2022-12-09 Rental Removed — BUILDIUM
- 2022-06-16 Listing Removed — HARMLS
- 2022-04-01 Listed $219,000 HARMLS
- 2021-06-29 Sold (Public Records) — Public Records
- 2021-06-27 Pending — HARMLS
- 2021-06-25 Sold (MLS) — HARMLS
- 2021-06-21 Pending — HARMLS
- 2021-06-15 Relisted — HARMLS
- 2021-06-12 Pending — HARMLS
- 2021-06-08 Listed $99,900 HARMLS
Property tax history
+3.3%/yrLatest (2025): $2,612 · -3.5% YoY. Source: county tax records.
Cash-flow waterfall
monthlySold comps — $/sqft
last 12 mo · ≤1 miLoading sold comps…