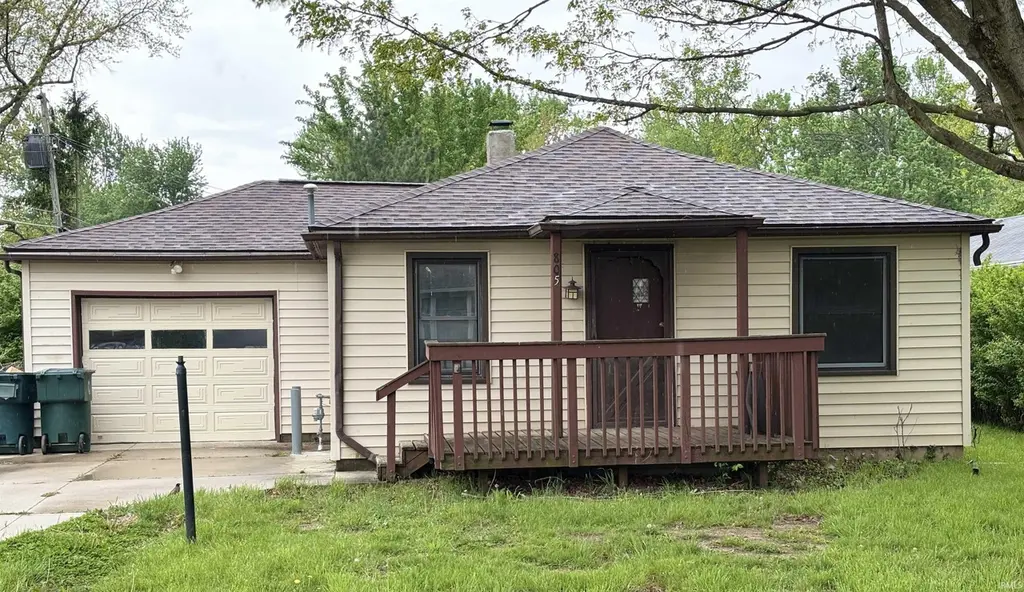
805 W Harvard Ave · Muncie, IN
Flood risk 1/10 · Minimal
- FEMA flood zone
- X (unshaded)
- Chance of flooding over 30 yrs
- 0.0%
- Est. flood insurance / yr
- $507 – $1,088
Fire risk 1/10 · Minimal
- Est. fire insurance / yr
- $717 – $1,331
Heat risk 3/10 · Minor
- Hot days now (above 100°F)
- 7 days/yr
- Hot days in 30 yrs
- 18 days/yr
Wind risk 2/10 · Minimal
- Chance of severe wind over 30 yrs
- 1.0%
Air-quality risk 3/10 · Minor
- Unhealthy air days now
- 2 days/yr
- Unhealthy air days in 30 yrs
- 3 days/yr
Risk factors via First Street. Map © Google.
Why this score? — see what drove the B+ grade
The composite is a weighted blend of 9 inputs, each scored 0–100. Each bar is that input's sub-score; the figure is the points it added to the 100-point composite (weight × sub-score).
- Cash flow +30.0/30.0
- ARV discount +15.0/15.0
- DSCR +10.0/10.0
- 1% rule +9.5/10.0
- Rent growth +4.5/5.0
- Livability +4.0/5.0
- Condition / age +2.5/5.0
- Schools +1.7/10.0
- Appreciation +0.0/10.0
$80,000
🖨 Deal sheet 📄 Offer letter ✓ Due diligence
Listing remarks
Bring your vision to this diamond in the rough! This property offers a fantastic head start with a new roof (only 1.5 years old), providing peace of mind while you customize the rest. The home is situated near local restaurants and a neighborhood elementary school, offering easy access to the best of the community. Whether you are looking for your next renovation project or a chance to build equity in a prime location, this fixer-upper is ready for its next chapter. Sold as-is.
Key facts
- Local restaurants
- Prime location
- New roof
Tags
Property features AI
Exterior
- Parking: Attached concrete garage with 1 garage space
- Utilities: Public water; Public sewer
- Home design: Single-family residence (site-built); One story
- Construction: Vinyl siding; Shallow crawl space foundation
- Exterior features: Level lot; Shed(s) on property; Lot dimensions approximately 650 x 1300
Interior
- Kitchen: Gas range; Refrigerator
- Bedrooms: 6 total rooms (includes bedrooms and living spaces)
- Flooring: Hardwood floors
- Bathrooms: 1 full bathroom
- Heating & cooling: Forced air heating (natural gas); Central air conditioning
- Interior features: Refrigerator and gas range included; One fireplace; Crawl space basement
- Laundry & utility: Laundry on the main level
Neighborhood map
What this means for you Summary
Snapshot
- This is a 3-bed/1.0-bath single-family listed at $80k.
Deal economics
- At list price, monthly cash flow is $383 ($5k/yr) — positive.
- The deal already cash-flows at list — no discount required.
- Meets the 1% rule at list price ($1k rent vs $80k).
- Recommended offer: $78k (3.0% below list) — sets the bar for market timing.
- Cap rate 12.0% vs local median 6.0% in Muncie — top-decile yield for the area; either an underpriced asset or a hidden risk that comps aren't pricing in. Stress-test before assuming the spread holds.
Location & tenants
- Location reads 80/100 on livability (#18 in IN, #1,654 nationally) — a professional / high-income tenant draw. Strengths: amenities A+, commute A+, cost of living A+; Watch: crime F, employment F.
- Muncie Community Schools (urban): math 18% / reading 25% proficiency, ranked #275 of 301 in IN (top 91%) — low school quality limits family demand, transient renter base, plan for 1-2y turnover; 68% free/reduced lunch — lower-income household profile, screen leases tightly.
- Zoned schools: Northside Middle School (math 17% / reading 36%, grade F, #236 of 330 statewide, top 72%, 583 students, 70% FRL) — zoned schools at 70% FRL track the district average.
- Market conditions: Rents rising fast (+8.1%/yr); 202 active listings in the ZIP; 17 comparable units currently listed for rent nearby; rentals lingering (median 44d on market — plan ~5-8 weeks vacancy on turnover, expect pricing pressure); 100% of comp listings sitting > 30 days — soft ceiling on asking rent; 171 units permitted in Delaware County in 2024 (57 in 5+ unit buildings).
Forward outlook
- Local home prices are declining (-3.0%/yr); year-one equity from $553 of loan paydown is wiped out by about $2k of value loss. Plan a longer hold.
- Delaware County population projected at -11% by 2050 — secular population decline; favor cash flow + early exit over multi-decade hold.
- At projected returns (-3.0% appreciation + 8.0% rent growth), your $22k cash investment doubles in ~5 years — after that, you're playing with house money.
Negotiation context
- It's been on market 45 days — a 3% lower offer ($78k) is reasonable based on typical stale-listing flexibility.
- 2 sale attempts with the ask held roughly flat each time — persistent listings suggest the price (not the market) is what's stuck; bring a comps-based counter.
Risks & watch-outs
- Watch-outs: built in 1952 — expect roof / HVAC / electrical / plumbing capex.
Questions for the listing agent
- It's been on market 45 days. Have you received any prior offers? Is the seller open to a 3% concession, seller financing, or rate buy-down credit?
- Built in 1952 — when were the roof, HVAC, electrical panel, plumbing, and water heater last replaced?
- Is there a deadline driving the sale (1031 exchange, divorce, estate, relocation)? That informs how much negotiation room exists.
- Schools are D-rated, which usually means shorter tenancies and higher turnover. Who's the typical renter profile here, and what's been the actual vacancy rate?
- Crime grade is F in this area — have there been break-ins, vandalism, or insurance claims at this property in the last 3 years? What carrier currently insures it and at what premium?
- What's the average days-on-market for RENTAL listings here right now (not sales)? A rising rental-DOM trend means longer vacancies and softer asking-rent achievability than the comps imply.
- What's the recent tenant-quality profile in this submarket — average credit score on applications, eviction rate, late-payment / NSF rate, and stable-employment percentage? A property-management company in the area should have these aggregated.
- How much new for-sale + rental construction is in the pipeline within 1–3 miles? Heavy new supply typically softens prices + rents 12–24 months out; constrained supply supports both.
Investment metrics
- 1% rule
- 1.45% ✓
- Cap rate
- 12.03%
- Cash-on-cash
- 20.50%
- DSCR
- 1.91
- GRM
- 5.8
CMA / ARV
- ARV (median comp)
- $115,476
- List price
- $80,000
- Delta
- -30.72%
- Verdict
- UNDERPRICED
- Comps
- 20 within 1.0 mi
Show comp detail 12 sales within ~0.75 mi
| Address | Dist | Beds/Ba | Sqft | Sold | Price | $/sf | Match |
|---|---|---|---|---|---|---|---|
| 3508 N Milton St | 0.17mi | 2/1.0 (-1) | 884 (-2%) | 14mo | $104,000 | $118 | 73 |
| 3500 N Reserve St | 0.12mi | 3/1.0 | 960 (+7%) | 14mo | $80,000 | $83 | 71 |
| 3310 N Cowing Park Ln | 0.15mi | 3/1.0 | 1,005 (+12%) | 12mo | $119,900 | $119 | 63 |
| 2409 N Janney Ave | 0.66mi | 2/1.0 (-1) | 898 (-0%) | 3mo | $150,000 | $167 | 61 |
| 1513 W Stirling Dr | 0.57mi | 2/1.0 (-1) | 912 (+1%) | 8mo | $142,000 | $156 | 60 |
| 2905 N Rosewood Ave | 0.63mi | 2/1.0 (-1) | 900 (0%) | 7mo | $115,000 | $128 | 59 |
| 1612 W Stirling Dr | 0.60mi | 2/1.0 (-1) | 912 (+1%) | 12mo | $90,000 | $99 | 55 |
| 3005 N Pauline Ave | 0.30mi | 2/1.0 (-1) | 780 (-13%) | 8mo | $106,000 | $136 | 52 |
| 3001 N Pauline Ave | 0.30mi | 3/2.0 | 1,018 (+13%) | 10mo | $124,900 | $123 | 52 |
| 413 W Harvard Ave | 0.23mi | 2/1.0 (-1) | 776 (-14%) | 12mo | $95,000 | $122 | 52 |
| 202 E Andover Ave | 0.56mi | 3/1.0 | 1,034 (+15%) | 2mo | $146,500 | $142 | 48 |
| 4011 N New York Ave | 0.44mi | 2/1.0 (-1) | 992 (+10%) | 16mo | $135,000 | $136 | 44 |
Match score weights: distance 35% · size 25% · config 20% · recency 20%. Top-matched comps best support the ARV.
Projected returns pro-forma
-3.0% appreciation · 8.0% rent growth · sell at horizon
- IRR
- 18.2%
- Equity multiple
- 1.78×
- Total profit
- $17,530
- Equity at exit
- $11,928
- IRR
- 29.9%
- Equity multiple
- 4.33×
- Total profit
- $74,513
- Equity at exit
- $6,917
Cash invested: $22,400 (down + closing). Projections, not guarantees.
Landlord ↔ Tenant lean methodology
- Overall (STATE)
- 90 Strongly Landlord-Friendly
- State Indiana
- 90 Strongly Landlord-Friendly · R+11
- County
- — inherits STATE
- City
- — inherits STATE
ZIP-level market 47304
- Home prices YoY
- -28.4%
- Rents YoY
- 8.1%
- Active inventory
- 202
- Price-to-rent
- 5.8×
Monthly cashflow live
- Estimated rent
- $1,158 high interval (Pro) →
- Mortgage (P&I)
- −$420
- Tax from tax record
- −$79 /mo · $950/yr
- Insurance
- −$33
- HOA
- −$0
- Vacancy / Maint / Mgmt
- −$243
- Net cashflow
- $383
Break-even live
UW: 25.0% down · 7.5% · 30yr · 1.5% tax · 5.0% vac · 8.0% maint · 8.0% mgmt
Financing live
Cash to close
- Down payment
- $20,000
- Closing costs
- $2,400
- Reserves months
- —
- Total cash needed
- —
Loan-product check · same deal, 3 products live
Conventional
25% down · 7.5% · 30yr
- Down + closing
- —
- Monthly P&I
- —
- Monthly cashflow
- —
- DSCR
- —
- Eligible?
- —
Personal DTI + credit; lowest rate.
DSCR
20% down · 8.5% · 30yr
- Down + closing
- —
- Monthly P&I
- —
- Monthly cashflow
- —
- DSCR
- —
- Eligible?
- —
No personal income docs; deal must DSCR.
Hard money
10% down · 12.0% · 12mo
- Down + closing
- —
- Monthly P&I
- —
- Monthly cashflow
- —
- DSCR
- —
- Eligible?
- —
Short-term bridge; refi at stabilization.
Rent comps 17 comps
| Address | Beds | Baths | Sqft | Rent | $/sqft | DOM | Units | Dist |
|---|---|---|---|---|---|---|---|---|
| 3906 N Franklin St Apt 1 Muncie, IN | 2.0 | 1.0 | 972 | $972 | $1.00 | 43d | 1 | 0.46mi |
| 3910 N Franklin St Muncie, IN | 2.0 | 1.5 | 1008 | $999 | $0.99 | 43d | 2 | 0.48mi |
| 2600 N Wheeling Ave Muncie, IN | 2.0–3.0 | 1.0 | 1024 | $1,035 | $1.01 | 43d | 1 | 0.55mi |
| 125 E Oldfield Ln Muncie, IN | 1.0–3.0 | 1.0–2.0 | 886 | $1,325 | $1.50 | 43d | 7 | 0.56mi |
| 4000 N Walnut St Muncie, IN | 1.0–3.0 | 1.0 | 880 | $1,060 | $1.20 | 43d | 5 | 0.57mi |
| 111 E Streeter Ave Muncie, IN | 2.0–3.0 | 1.0 | 816 | $999 | $1.22 | 43d | 3 | 0.76mi |
| 151 E Streeter Ave Unit 2 Bedroom Apartment Muncie, IN | 2.0 | 1.0 | 750 | $692 | $0.92 | 43d | 1 | 0.82mi |
| 720 W Centennial Ave Muncie, IN | 2.0–3.0 | 1.0–2.0 | 1034 | $1,099 | $1.06 | 43d | 1 | 0.84mi |
| 222 W Centennial Ave Muncie, IN | 2.0 | 1.5 | 1042 | $925 | $0.89 | 43d | 1 | 0.92mi |
| 1801 N Glenwood Ave Muncie, IN | 2.0 | 1.0 | 1096 | $1,250 | $1.14 | 43d | 1 | 0.94mi |
| 1200 W Bethel Ave Muncie, IN | 3.0 | 2.0 | 1100 | $1,300 | $1.18 | 43d | 13 | 0.98mi |
| 1701 N Rosewood Ave Muncie, IN | 2.0 | 1.0 | 750 | $1,405 | $1.87 | 43d | 1 | 1.00mi |
| 2000 N Oakwood Ave Muncie, IN | 2.0 | 1.0 | 626 | $825 | $1.32 | 43d | 1 | 1.04mi |
| 2010 W Enterprise Ave Unit 2014 Muncie, IN | 2.0 | 1.0 | 864 | $800 | $0.93 | 43d | 1 | 1.33mi |
| 920 N Linden St Muncie, IN | 2.0 | 1.0 | 745 | $925 | $1.24 | 43d | 1 | 1.37mi |
| 1001 W Wayne St Muncie, IN | 3.0 | 2.0 | 1100 | $1,200 | $1.09 | 43d | 1 | 1.38mi |
| 816 N New York Ave Muncie, IN | 3.0–4.0 | 1.0 | 1200 | $1,000 | $0.83 | 43d | 10 | 1.46mi |
Listing history 19 events
-
2026-06-19days on market $80,000 Active 45 DOM
-
2026-06-18days on market $80,000 Active 44 DOM
-
2026-06-17days on market $80,000 Active 43 DOM
-
2026-06-16days on market $80,000 Active 42 DOM
-
2026-06-15days on market $80,000 Active 41 DOM
-
2026-06-14days on market $80,000 Active 39 DOM
-
2026-06-13days on market $80,000 Active 38 DOM
-
2026-06-10days on market $80,000 Active 36 DOM
-
2026-06-09days on market $80,000 Active 35 DOM
-
2026-06-08days on market $80,000 Active 34 DOM
-
2026-06-07days on market $80,000 Active 33 DOM
-
2026-06-05days on market $80,000 Active 30 DOM
-
2026-06-03days on market $80,000 Active 29 DOM
-
2026-06-02days on market $80,000 Active 28 DOM
-
2026-06-01days on market $80,000 Active 27 DOM
-
2026-05-31days on market $80,000 Active 26 DOM
-
2026-05-30days on market $80,000 Active 25 DOM
-
2026-05-08status Pending 484-char remark
-
2026-04-24$80,000 Active 484-char remark
ⓘ Source: listings_history table (triggers on properties + properties_extension) + one-shot
backfill from property_details.listing_events for pre-trigger history.
Tax reassessment forecast IN · Partial reset (capped growth)
- Current annual tax
- $950 · $79/mo
- Projected year-2 tax
- $950 · $79/mo
- Expected delta
- $0/yr ($0/mo · 0.0%)
ⓘ Screening estimate from a state-policy table — verify with the county assessor before closing.
Climate risk First Street
- Flood 1/10 Low FEMA zone X (unshaded) · 0% chance over 30 yrs
- Wildfire 1/10 Low
- Heat 3/10 Moderate 7 d/yr ≥100°F today · 18 d/yr by 30 yrs out
- Wind 2/10 Low 100% chance of damaging wind over 30 yrs
- Air quality 3/10 Moderate 2 unhealthy d/yr today · 3 by 30 yrs out
Nearby sold comps map
Loading sold comps map…
Walkable amenities ~0.75 mi
Loading nearby amenities…
Taxation est. · year 1
- Rental income
- $13,894
- − Mortgage interest
- −$4,481
- − Property taxes
- −$950
- − Insurance
- −$400
- − Repairs & maintenance
- −$1,111
- − Management
- −$1,111
- − Depreciation
- −$2,327
- Taxable income
- $3,512
- Est. tax owed @ 24.0%
- −$843
- After-tax cash flow
- $3,749/yr
For passive investors: Depreciation is non-cash, so a rental often shows a tax loss while cash-flowing — sheltering income. Rental losses are passive: they offset passive income freely, and up to $25,000/yr can offset ordinary (W-2) income if you actively participate and your MAGI is under $100k (phasing out to $0 by $150k); unused losses carry forward. On sale, claimed depreciation is recaptured at up to 25%, and gains may owe capital-gains tax (a 1031 exchange can defer both). Figures are a year-1 estimate at your 24.0% rate — not tax advice; consult a CPA.
Schools (NCES district)
- District
- Muncie Community Schools
- NCES district ID
- 1807320
- Math proficiency
- 18% ▼ -9.00%
- Reading proficiency
- 25% ▼ -4.00%
- Median HH income
- $30,052
- Composite
- 17.22/100
- National rank
- #9099
- State rank
- #275 of 301 in IN
Livability — Muncie
- Score
- 80/100
- State rank
- #18
- US rank
- #1654
Category grades
Schools grade is shown separately in the Schools card above.
Census & demographics
- Census place
- Muncie, IN
- County
- Delaware County · 84,658 people
- City population
- 84,658
- Metro
- Muncie, IN
- Population (ZIP)
- 31,237
- Household income
- $63,215
- Rent vs Own
- Severe rent burden
- 1141.0
Population outlook (Delaware County) Hauer SSP2
- Today (2025)
- 113,036 people
- By 2030
- 111,313 · -1.5%
- By 2040
- 106,432 · -5.8%
- By 2050
- 100,747 · -10.9%
- By 2075
- 91,000 · -19.5%
- By 2100
- 80,687 · -28.6%
Race, ethnicity, and origin ACS 2023
- Neighborhood character
- Predominantly White (85%)
- Race & ethnicity
- White 85% Two or more races 5% Black 4% Asian 4% Hispanic / Latino 3%
- Common ancestry
- Lithuanian 2% Romanian 2% Slovak 1%
- Foreign-born
- 5% · Canada, Vietnam, China
- Languages at home
- 94% English-only · Spanish 2% Other Indo-European 1% Vietnamese 1%
Political lean MEDSL · Delaware
- 2024 margin
- R (+15.8) · D 41.2% · R 57.0% · Other 1.8%
- 2008→2024 swing
- -30.8pp toward R · 2008: 15.0pp · 2024: -15.8pp
- All cycles
- 2024: R+15.8 2020: R+13.2 2016: R+13.7 2012: D+3.1 2008: D+15.0
Not yet ingested
- Civics
- —
Market trends
- HPI YoY
- ▼ -78.53%
- Current HPI
- 197.5213
- Rent YoY
- ▲ 8.08%
- Metro
- Muncie, IN
- State GDP YoY
- ▲ 2.90%
- F500 in state
- 18
Industry mix (Fortune 500 HQ in IN)
| Industry | F500 HQs | Revenue |
|---|---|---|
| Industrial Machinery | 2 | $37B |
|
||
| Healthcare | 1 | $177B |
|
||
| Pharmaceuticals | 1 | $45B |
|
||
| Metals / Steel | 1 | $18B |
|
||
| Agriculture | 1 | $17B |
|
||
| Packaging | 1 | $12B |
|
||
Price history
3 events — show timeline
- 2026-05-19 Relisted — IRMLS
- 2026-05-08 Pending — IRMLS
- 2026-04-24 Listed $80,000 IRMLS
Property tax history
-8.5%/yrLatest (2024): $950 · -0.2% YoY. Source: county tax records.
Cash-flow waterfall
monthlySold comps — $/sqft
last 12 mo · ≤1 miLoading sold comps…