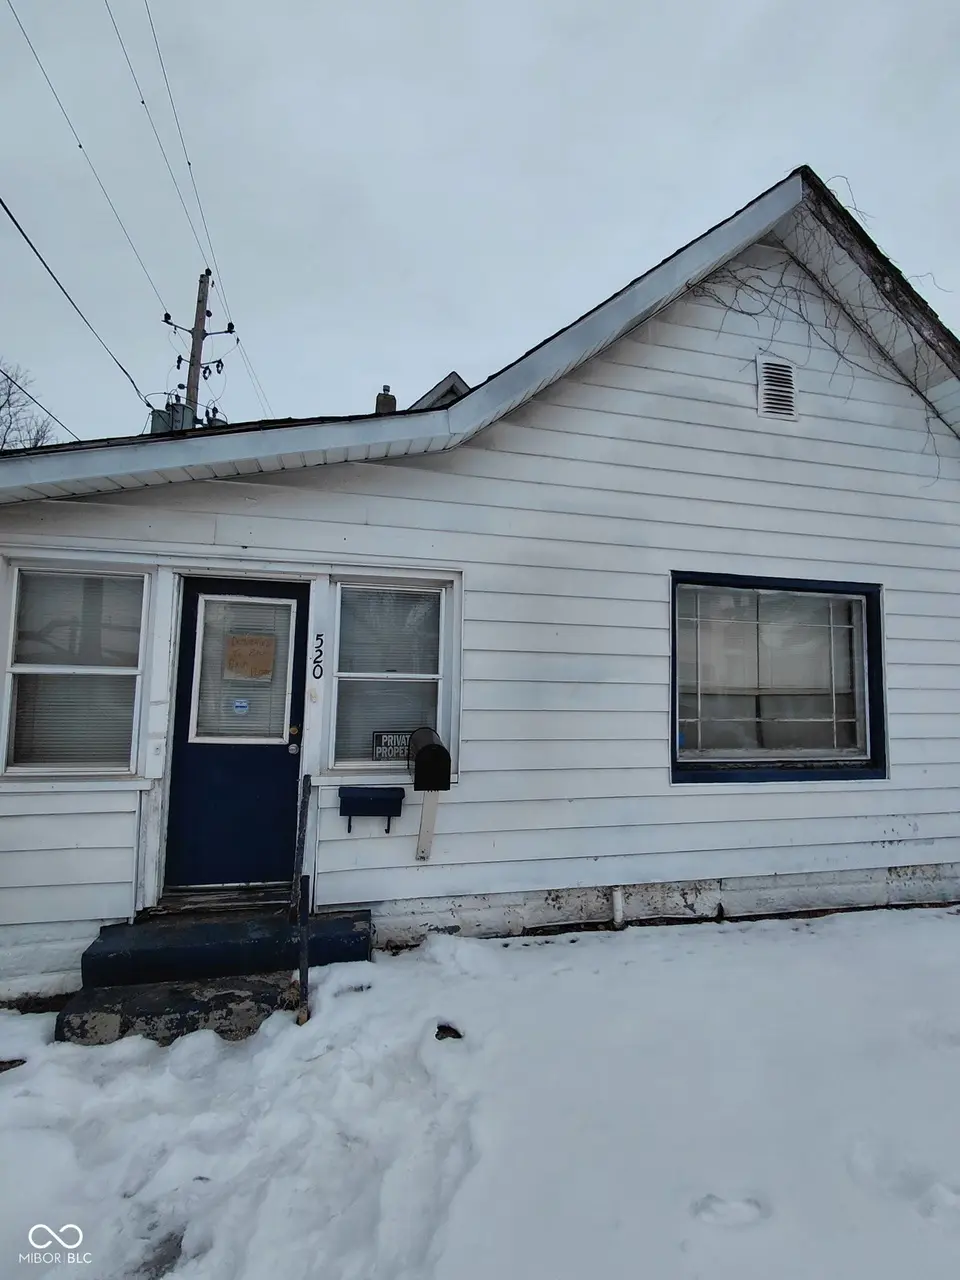
520 E Minnesota St · Indianapolis city (balance), IN
Flood risk 1/10 · Minimal
- FEMA flood zone
- X (unshaded)
- Chance of flooding over 30 yrs
- 0.0%
- Est. flood insurance / yr
- $473 – $860
Fire risk 1/10 · Minimal
- Est. fire insurance / yr
- $717 – $1,331
Heat risk 4/10 · Minor
- Hot days now (above 101°F)
- 7 days/yr
- Hot days in 30 yrs
- 19 days/yr
Wind risk 2/10 · Minimal
- Chance of severe wind over 30 yrs
- 1.0%
Air-quality risk 3/10 · Minor
- Unhealthy air days now
- 2 days/yr
- Unhealthy air days in 30 yrs
- 3 days/yr
Risk factors via First Street. Map © Google.
Why this score? — see what drove the B- grade
The composite is a weighted blend of 9 inputs, each scored 0–100. Each bar is that input's sub-score; the figure is the points it added to the 100-point composite (weight × sub-score).
- Cash flow +30.0/30.0
- 1% rule +10.0/10.0
- DSCR +10.0/10.0
- ARV discount +7.5/15.0
- Rent growth +3.2/5.0
- Livability +2.5/5.0
- Condition / age +2.5/5.0
- Schools +1.4/10.0
- Appreciation +0.0/10.0
$119,500
🖨 Deal sheet 📄 Offer letter ✓ Due diligence
Listing remarks MLS
520 E Minnesota St | Bates-Hendricks Solid investment in the heart of Bates-Hendricks, one of Indy's most actively revitalizing neighborhoods.
Key facts
- Immediate cash flow
- Functional layout
- Tenant-occupied
Tags
Neighborhood map
What this means for you Summary
Snapshot
- This is a 3-bed/1.0-bath single-family listed at $120k.
Deal economics
- At list price, monthly cash flow is $753 ($9k/yr) — positive.
- The deal already cash-flows at list — no discount required.
- Meets the 1% rule at list price ($2k rent vs $120k).
- Recommended offer: $116k (3.0% below list) — sets the bar for market timing.
- Cap rate 13.8% vs local median 4.4% in Indianapolis city (balance) — top-decile yield for the area; either an underpriced asset or a hidden risk that comps aren't pricing in. Stress-test before assuming the spread holds.
Location & tenants
- Location reads: area grade B — affects rentability + tenant quality, not the cash-flow math above.
- Indianapolis Public Schools (urban): math 14% / reading 20% proficiency, ranked #286 of 301 in IN (top 95%) — low school quality limits family demand, transient renter base, plan for 1-2y turnover; 77% free/reduced lunch — lower-income household profile, screen leases tightly.
- Market conditions: Rents rising (+2.9%/yr); 493 active listings in the ZIP; 40 comparable units currently listed for rent nearby; rentals at typical pace (median 24d on market — plan ~3-4 weeks tenant-placement turnaround); 1,906 units permitted in Marion County in 2024 (621 in 5+ unit buildings).
- This rent runs 45% of the median local income ($57k/yr) — at the standard rent-burdened threshold; future hikes will face affordability resistance.
Forward outlook
- Local home prices are declining (-3.0%/yr); year-one equity from $826 of loan paydown is wiped out by about $4k of value loss. Plan a longer hold.
- Marion County population projected at +18% by 2050 — long-run rental-demand tailwind backs the buy-and-hold thesis.
- At projected returns (-3.0% appreciation + 2.9% rent growth), your $33k cash investment doubles in ~5 years — after that, you're playing with house money.
Negotiation context
- It's been on market 35 days — a 3% lower offer ($116k) is reasonable based on typical stale-listing flexibility.
- 4 sale attempts; this cycle's ask has dropped $46k (28%) from the opening price — seller is motivated, your offer sets the floor, not the list.
Risks & watch-outs
- Watch-outs: property tax is 2.6% of price; built in 1890 — expect roof / HVAC / electrical / plumbing capex.
Questions for the listing agent
- It's been on market 35 days. Have you received any prior offers? Is the seller open to a 3% concession, seller financing, or rate buy-down credit?
- Built in 1890 — when were the roof, HVAC, electrical panel, plumbing, and water heater last replaced?
- Property tax is high relative to price — has the assessment been appealed recently, and will the sale trigger a re-assessment?
- Is there a deadline driving the sale (1031 exchange, divorce, estate, relocation)? That informs how much negotiation room exists.
- What's the average days-on-market for RENTAL listings here right now (not sales)? A rising rental-DOM trend means longer vacancies and softer asking-rent achievability than the comps imply.
- What's the recent tenant-quality profile in this submarket — average credit score on applications, eviction rate, late-payment / NSF rate, and stable-employment percentage? A property-management company in the area should have these aggregated.
- How much new for-sale + rental construction is in the pipeline within 1–3 miles? Heavy new supply typically softens prices + rents 12–24 months out; constrained supply supports both.
Investment metrics
- 1% rule
- 1.79% ✓
- Cap rate
- 13.85%
- Cash-on-cash
- 26.99%
- DSCR
- 2.20
- GRM
- 4.6
CMA / ARV
- ARV (median comp)
- $388,448
- List price
- $119,500
- Delta
- -69.24%
- Verdict
- UNDERPRICED
- Comps
- 20 within 1.0 mi
Show comp detail 12 sales within ~0.75 mi
| Address | Dist | Beds/Ba | Sqft | Sold | Price | $/sf | Match |
|---|---|---|---|---|---|---|---|
| 818 Iowa St | 0.20mi | 3/1.0 | 2,187 (+4%) | 1mo | $146,000 | $67 | 83 |
| 2117 Webb St | 0.49mi | 3/1.0 | 2,138 (+2%) | 1mo | $60,000 | $28 | 72 |
| 835 Parkway Ave | 0.34mi | 2/1.0 (-1) | 2,194 (+5%) | 1mo | $240,000 | $109 | 70 |
| 325 Sanders St | 0.43mi | 3/2.5 | 2,042 (-2%) | 1mo | $359,000 | $176 | 69 |
| 1602 Leonard St | 0.26mi | 3/2.0 | 2,288 (+9%) | 0mo | $275,000 | $120 | 68 |
| 826 E Minnesota St | 0.20mi | 3/3.0 | 2,347 (+12%) | 1mo | $450,000 | $192 | 61 |
| 1417 Olive St | 0.60mi | 3/3.0 | 2,050 (-2%) | 0mo | $435,000 | $212 | 60 |
| 2145 Singleton St | 0.47mi | 3/1.0 | 1,869 (-11%) | 1mo | $152,000 | $81 | 59 |
| 1415 Union St | 0.51mi | 4/2.5 (+1) | 2,177 (+4%) | 1mo | $439,000 | $202 | 58 |
| 341 E Morris St | 0.49mi | 2/2.5 (-1) | 2,192 (+5%) | 1mo | $257,500 | $117 | 57 |
| 2125 S Garfield Dr | 0.49mi | 3/2.5 | 1,820 (-13%) | 0mo | $285,000 | $157 | 49 |
| 1515 Olive St | 0.58mi | 3/2.5 | 2,400 (+15%) | 1mo | $464,000 | $193 | 42 |
Match score weights: distance 35% · size 25% · config 20% · recency 20%. Top-matched comps best support the ARV.
Projected returns pro-forma
-3.0% appreciation · 2.88% rent growth · sell at horizon
- IRR
- 20.8%
- Equity multiple
- 1.85×
- Total profit
- $28,408
- Equity at exit
- $17,818
- IRR
- 28.9%
- Equity multiple
- 3.56×
- Total profit
- $85,810
- Equity at exit
- $10,332
Cash invested: $33,460 (down + closing). Projections, not guarantees.
Landlord ↔ Tenant lean methodology
- Overall (STATE)
- 90 Strongly Landlord-Friendly
- State Indiana
- 90 Strongly Landlord-Friendly · R+11
- County
- — inherits STATE
- City
- — inherits STATE
ZIP-level market 46203
- Home prices YoY
- -26.7%
- Rents YoY
- 2.9%
- Active inventory
- 493
- Price-to-rent
- 4.6×
Monthly cashflow live
- Estimated rent
- $2,142 high interval (Pro) →
- Mortgage (P&I)
- −$627
- Tax from tax record
- −$263 /mo · $3,161/yr
- Insurance
- −$50
- HOA
- −$0
- Vacancy / Maint / Mgmt
- −$450
- Net cashflow
- $753
Break-even live
UW: 25.0% down · 7.5% · 30yr · 1.5% tax · 5.0% vac · 8.0% maint · 8.0% mgmt
Financing live
Cash to close
- Down payment
- $29,875
- Closing costs
- $3,585
- Reserves months
- —
- Total cash needed
- —
Loan-product check · same deal, 3 products live
Conventional
25% down · 7.5% · 30yr
- Down + closing
- —
- Monthly P&I
- —
- Monthly cashflow
- —
- DSCR
- —
- Eligible?
- —
Personal DTI + credit; lowest rate.
DSCR
20% down · 8.5% · 30yr
- Down + closing
- —
- Monthly P&I
- —
- Monthly cashflow
- —
- DSCR
- —
- Eligible?
- —
No personal income docs; deal must DSCR.
Hard money
10% down · 12.0% · 12mo
- Down + closing
- —
- Monthly P&I
- —
- Monthly cashflow
- —
- DSCR
- —
- Eligible?
- —
Short-term bridge; refi at stabilization.
Rent comps 40 comps
| Address | Beds | Baths | Sqft | Rent | $/sqft | DOM | Units | Dist |
|---|---|---|---|---|---|---|---|---|
| 1830 Orleans St Indianapolis, IN | 3.0 | 2.5 | 1586 | $1,995 | $1.26 | 44d | 1 | 0.17mi |
| 438 E Beecher St Indianapolis, IN | 3.0 | 2.5 | 1500 | $1,450 | $0.97 | 24d | 1 | 0.22mi |
| 728 Cottage Ave Indianapolis, IN | 3.0 | 2.5 | 1831 | $2,550 | $1.39 | 24d | 1 | 0.23mi |
| 1835 Applegate St Indianapolis, IN | 4.0 | 3.0 | 2024 | $2,300 | $1.14 | 44d | 1 | 0.23mi |
| 835 Weghorst St Unit 837 Indianapolis, IN | 3.0 | 1.5 | 1500 | $1,399 | $0.93 | 24d | 1 | 0.25mi |
| 752 Cottage Ave Indianapolis, IN | 3.0 | 2.0 | 1548 | $1,750 | $1.13 | 15d | 1 | 0.26mi |
| 350 Terrace Ave Indianapolis, IN | 4.0 | 2.5 | 2552 | $3,000 | $1.18 | 4d | 1 | 0.27mi |
| 350 Terrace Ave Indianapolis, IN | 4.0 | 2.5 | 2552 | $3,000 | $1.18 | 24d | 1 | 0.27mi |
| 243 Terrace Ave Indianapolis, IN | 4.0 | 2.0 | 1669 | $2,700 | $1.62 | 18d | 1 | 0.28mi |
| 406 Parkway Ave Indianapolis, IN | 4.0 | 2.5 | 2481 | $2,250 | $0.91 | 24d | 1 | 0.31mi |
| 734 Parkway Ave Indianapolis, IN | 3.0 | 2.0 | 2110 | $2,299 | $1.09 | 24d | 1 | 0.32mi |
| 1713 S Delaware St Indianapolis, IN | 2.0 | 2.0 | 1785 | $1,700 | $0.95 | 44d | 1 | 0.33mi |
| 406 Orange St Indianapolis, IN | 3.0 | 2.5 | 1820 | $2,250 | $1.24 | 44d | 1 | 0.36mi |
| 1247 Wright St Indianapolis, IN | 3.0 | 1.5 | 1809 | $1,750 | $0.97 | 44d | 1 | 0.40mi |
| 736 E Morris St Indianapolis, IN | 2.0 | 1.5 | 1500 | $1,195 | $0.80 | 4d | 1 | 0.48mi |
| 1301 Ringgold Ave Unit 1303750P Indianapolis, IN | 3.0 | 3.0 | 2884 | $6,514 | $2.26 | 44d | 1 | 0.52mi |
| 1337 Barth Ave Indianapolis, IN | 3.0 | 1.0 | 2468 | $1,700 | $0.69 | 16d | 1 | 0.52mi |
| 1337 Barth Ave Indianapolis, IN | 3.0 | 1.0 | 2468 | $1,700 | $0.69 | 8d | 1 | 0.52mi |
| 1337 Barth Ave Indianapolis, IN | 3.0 | 1.0 | 2468 | $1,700 | $0.69 | 11d | 1 | 0.52mi |
| 1337 Barth Ave Unit NA Indianapolis, IN | 3.0 | 1.0 | 2468 | $1,700 | $0.69 | 4d | 1 | 0.52mi |
| 518 Prospect St Unit 1357365P Indianapolis, IN | 3.0 | 2.0 | 1614 | $2,594 | $1.61 | 8d | 1 | 0.52mi |
| 518 Prospect St Unit 1353834P Indianapolis, IN | 3.0 | 2.0 | 1603 | $2,442 | $1.52 | 15d | 1 | 0.52mi |
| 1035 Sanders St Unit 163 Indianapolis, IN | 2.0 | 1.0 | 1481 | $1,921 | $1.30 | 44d | 1 | 0.56mi |
| 932 E Morris St Indianapolis, IN | 2.0 | 2.0 | 1483 | $1,900 | $1.28 | 3d | 1 | 0.57mi |
| 1205 Cottage Ave Unit 1372938P Indianapolis, IN | 4.0 | 3.5 | 2680 | $6,638 | $2.48 | 44d | 1 | 0.60mi |
| 1258 E Naomi St Indianapolis, IN | 3.0 | 2.0 | 1608 | $1,450 | $0.90 | 8d | 1 | 0.68mi |
| 1330 Laurel St Indianapolis, IN | 3.0 | 2.0 | 1911 | $2,250 | $1.18 | 20d | 1 | 0.77mi |
| 1012 Hosbrook St Indianapolis, IN | 2.0 | 2.5 | 1728 | $2,400 | $1.39 | 24d | 1 | 0.82mi |
| 2283 Union St Indianapolis, IN | 3.0 | 2.0 | 1824 | $1,820 | $1.00 | 24d | 1 | 0.83mi |
| 822 Union St Indianapolis, IN | 3.0 | 3.0 | 2384 | $3,700 | $1.55 | 24d | 1 | 0.88mi |
| 818 Union St Indianapolis, IN | 4.0 | 4.0 | 2624 | $3,900 | $1.49 | 24d | 1 | 0.89mi |
| 1441 Prospect St Indianapolis, IN | 2.0 | 1.0–2.0 | 2840 | $2,000 | $0.70 | 2d | 13 | 0.92mi |
| 1641 Iowa St Indianapolis, IN | 3.0 | 3.0 | 1938 | $1,900 | $0.98 | 24d | 1 | 0.96mi |
| 1528 E Tabor St Indianapolis, IN | 3.0 | 1.5 | 2200 | $1,550 | $0.70 | 15d | 1 | 0.99mi |
| 1140 Hoyt Ave Indianapolis, IN | 4.0 | 1.5 | 1831 | $1,895 | $1.03 | 44d | 1 | 1.00mi |
| 1502 Woodlawn Ave Indianapolis, IN | 2.0 | 2.0 | 1441 | $2,500 | $1.73 | 15d | 1 | 1.02mi |
| 1135 Spann Ave Indianapolis, IN | 4.0 | 2.5 | 1836 | $2,495 | $1.36 | 18d | 1 | 1.08mi |
| 1546 E Bradbury Ave Indianapolis, IN | 2.0 | 1.5 | 2066 | $1,500 | $0.73 | 44d | 1 | 1.13mi |
| 1619 S Randolph St Indianapolis, IN | 3.0 | 1.0 | 2016 | $1,195 | $0.59 | 24d | 1 | 1.17mi |
| 1548 Lexington Ave Indianapolis, IN | 4.0 | 3.0 | 2224 | $2,250 | $1.01 | 3d | 1 | 1.18mi |
Listing history 13 events
-
2026-05-10status Pending 145-char remark
Show marketing remark (145 chars)
520 E Minnesota St | Bates-Hendricks Solid investment in the heart of Bates-Hendricks, one of Indy's most actively revitalizing neighborhoods.
-
2026-04-29price $119,500 145-char remark
Show marketing remark (145 chars)
520 E Minnesota St | Bates-Hendricks Solid investment in the heart of Bates-Hendricks, one of Indy's most actively revitalizing neighborhoods.
-
2026-04-28price $119,999 145-char remark
Show marketing remark (145 chars)
520 E Minnesota St | Bates-Hendricks Solid investment in the heart of Bates-Hendricks, one of Indy's most actively revitalizing neighborhoods.
-
2026-04-23price $120,000 145-char remark
Show marketing remark (145 chars)
520 E Minnesota St | Bates-Hendricks Solid investment in the heart of Bates-Hendricks, one of Indy's most actively revitalizing neighborhoods.
-
2026-04-18status Active 145-char remark
Show marketing remark (145 chars)
520 E Minnesota St | Bates-Hendricks Solid investment in the heart of Bates-Hendricks, one of Indy's most actively revitalizing neighborhoods.
-
2026-03-24price $130,000 145-char remark
Show marketing remark (145 chars)
520 E Minnesota St | Bates-Hendricks Solid investment in the heart of Bates-Hendricks, one of Indy's most actively revitalizing neighborhoods.
-
2026-02-27price $135,000 145-char remark
Show marketing remark (145 chars)
520 E Minnesota St | Bates-Hendricks Solid investment in the heart of Bates-Hendricks, one of Indy's most actively revitalizing neighborhoods.
-
2026-02-27status Active 145-char remark
Show marketing remark (145 chars)
520 E Minnesota St | Bates-Hendricks Solid investment in the heart of Bates-Hendricks, one of Indy's most actively revitalizing neighborhoods.
-
2026-02-23status Active 145-char remark
Show marketing remark (145 chars)
520 E Minnesota St | Bates-Hendricks Solid investment in the heart of Bates-Hendricks, one of Indy's most actively revitalizing neighborhoods.
-
2026-02-23price $140,000 145-char remark
Show marketing remark (145 chars)
520 E Minnesota St | Bates-Hendricks Solid investment in the heart of Bates-Hendricks, one of Indy's most actively revitalizing neighborhoods.
-
2026-02-23historical 145-char remark
Show marketing remark (145 chars)
520 E Minnesota St | Bates-Hendricks Solid investment in the heart of Bates-Hendricks, one of Indy's most actively revitalizing neighborhoods.
-
2026-02-19price $150,000 145-char remark
Show marketing remark (145 chars)
520 E Minnesota St | Bates-Hendricks Solid investment in the heart of Bates-Hendricks, one of Indy's most actively revitalizing neighborhoods.
-
2026-02-10$165,000 Active 145-char remark
Show marketing remark (145 chars)
520 E Minnesota St | Bates-Hendricks Solid investment in the heart of Bates-Hendricks, one of Indy's most actively revitalizing neighborhoods.
ⓘ Source: listings_history table (triggers on properties + properties_extension) + one-shot
backfill from property_details.listing_events for pre-trigger history.
Tax reassessment forecast IN · Partial reset (capped growth)
- Current annual tax
- $3,161 · $263/mo
- Projected year-2 tax
- $3,161 · $263/mo
- Expected delta
- $0/yr ($0/mo · 0.0%)
ⓘ Screening estimate from a state-policy table — verify with the county assessor before closing.
Climate risk First Street
- Flood 1/10 Low FEMA zone X (unshaded) · 0% chance over 30 yrs
- Wildfire 1/10 Low
- Heat 4/10 Moderate 7 d/yr ≥101°F today · 19 d/yr by 30 yrs out
- Wind 2/10 Low 100% chance of damaging wind over 30 yrs
- Air quality 3/10 Moderate 2 unhealthy d/yr today · 3 by 30 yrs out
Nearby sold comps map
Loading sold comps map…
Walkable amenities ~0.75 mi
Loading nearby amenities…
Taxation est. · year 1
- Rental income
- $25,708
- − Mortgage interest
- −$6,694
- − Property taxes
- −$3,161
- − Insurance
- −$598
- − Repairs & maintenance
- −$2,057
- − Management
- −$2,057
- − Depreciation
- −$3,476
- Taxable income
- $7,665
- Est. tax owed @ 24.0%
- −$1,840
- After-tax cash flow
- $7,190/yr
For passive investors: Depreciation is non-cash, so a rental often shows a tax loss while cash-flowing — sheltering income. Rental losses are passive: they offset passive income freely, and up to $25,000/yr can offset ordinary (W-2) income if you actively participate and your MAGI is under $100k (phasing out to $0 by $150k); unused losses carry forward. On sale, claimed depreciation is recaptured at up to 25%, and gains may owe capital-gains tax (a 1031 exchange can defer both). Figures are a year-1 estimate at your 24.0% rate — not tax advice; consult a CPA.
Schools (NCES district)
- District
- Indianapolis Public Schools
- NCES district ID
- 1804770
- Math proficiency
- 14% ▼ -7.00%
- Reading proficiency
- 20% ▼ -3.00%
- Median HH income
- $32,034
- Composite
- 13.69/100
- National rank
- #9499
- State rank
- #286 of 301 in IN
Livability — Indianapolis city (balance)
No livability data for this city. (Only ~50 U.S. cities are tracked.)
Census & demographics
- Census place
- Indianapolis city (balance), IN
- County
- Marion County · 998,460 people
- City population
- 881,119
- Metro
- Indianapolis-Carmel-Anderson, IN
- Population (ZIP)
- 37,758
- Household income
- $57,393
- Rent vs Own
- Severe rent burden
- 1499.0
Population outlook (Marion County) Hauer SSP2
- Today (2025)
- 1,025,572 people
- By 2030
- 1,065,727 · +3.9%
- By 2040
- 1,141,577 · +11.3%
- By 2050
- 1,208,920 · +17.9%
- By 2075
- 1,367,288 · +33.3%
- By 2100
- 1,438,201 · +40.2%
Race, ethnicity, and origin ACS 2023
- Neighborhood character
- Predominantly White (69%)
- Race & ethnicity
- White 69% Hispanic / Latino 14% Black 12% Two or more races 8% Asian 2% Native American 1%
- Hispanic origin (detail)
- Mexican 12% Puerto Rican 1%
- Common ancestry
- Slovak 2% Lithuanian 2% Italian 1%
- Foreign-born
- 8% · Canada
- Languages at home
- 88% English-only · Spanish 10% Other Indo-European 1%
Political lean MEDSL · Marion
- 2024 margin
- Strong D (+27.7) · D 63.0% · R 35.3% · Other 1.7%
- 2008→2024 swing
- -0.7pp no change · 2008: 28.4pp · 2024: 27.7pp
- All cycles
- 2024: D+27.7 2020: D+29.1 2016: D+22.8 2012: D+22.2 2008: D+28.4
Not yet ingested
- Civics
- —
Market trends
- HPI YoY
- ▼ -127.37%
- Current HPI
- 349.579
- Rent YoY
- ▲ 2.88%
- Metro
- Indianapolis-Carmel-Anderson, IN
- State GDP YoY
- ▲ 2.90%
- F500 in state
- 18
Industry mix (Fortune 500 HQ in IN)
| Industry | F500 HQs | Revenue |
|---|---|---|
| Industrial Machinery | 2 | $37B |
|
||
| Healthcare | 1 | $177B |
|
||
| Pharmaceuticals | 1 | $45B |
|
||
| Metals / Steel | 1 | $18B |
|
||
| Agriculture | 1 | $17B |
|
||
| Packaging | 1 | $12B |
|
||
Price history
-27.6% since first listed13 events — show timeline
- 2026-05-10 Pending — MIBOR as Distributed by MLS Grid
- 2026-04-29 Price Changed $119,500 MIBOR as Distributed by MLS Grid
- 2026-04-28 Price Changed $119,999 MIBOR as Distributed by MLS Grid
- 2026-04-23 Price Changed $120,000 MIBOR as Distributed by MLS Grid
- 2026-04-18 Relisted — MIBOR as Distributed by MLS Grid
- 2026-03-24 Price Changed $130,000 MIBOR as Distributed by MLS Grid
- 2026-02-27 Price Changed $135,000 MIBOR as Distributed by MLS Grid
- 2026-02-27 Relisted — MIBOR as Distributed by MLS Grid
- 2026-02-23 Relisted — MIBOR as Distributed by MLS Grid
- 2026-02-23 Price Changed $140,000 MIBOR as Distributed by MLS Grid
- 2026-02-23 Listing Removed — MIBOR as Distributed by MLS Grid
- 2026-02-19 Price Changed $150,000 MIBOR as Distributed by MLS Grid
- 2026-02-10 Listed $165,000 MIBOR as Distributed by MLS Grid
Property tax history
+10.5%/yrLatest (2025): $3,161 · +5.2% YoY. Source: county tax records.
Cash-flow waterfall
monthlySold comps — $/sqft
last 12 mo · ≤1 miLoading sold comps…