 14-Plex
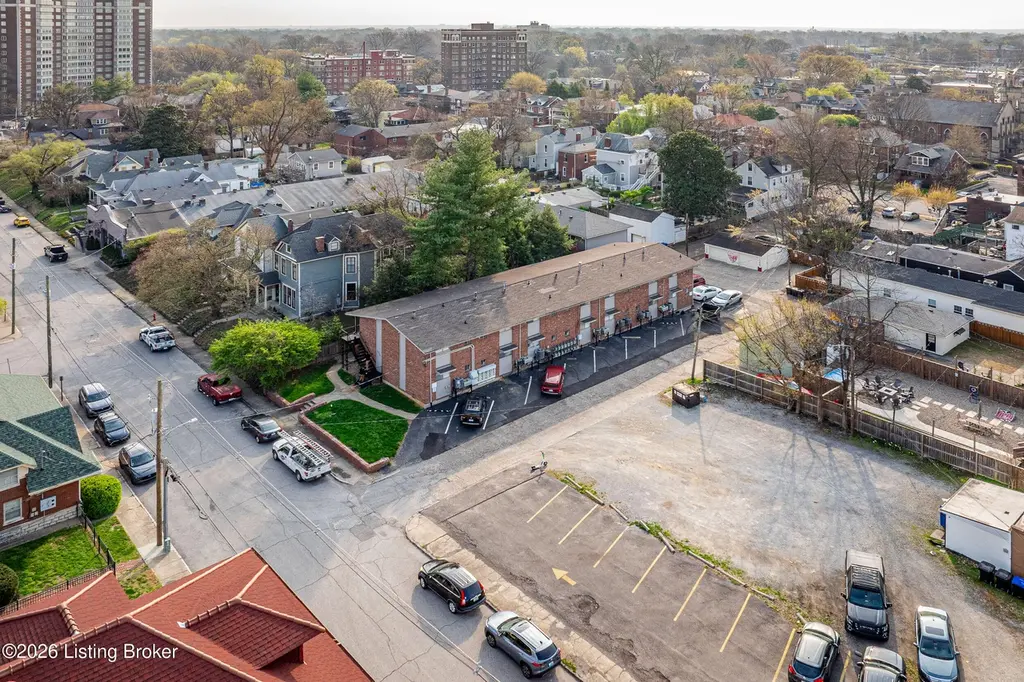
2020 Midland Ave · Louisville, KY
Flood risk 1/10 · Minimal
- FEMA flood zone
- X (unshaded)
- Chance of flooding over 30 yrs
- 0.0%
- Est. flood insurance / yr
- $473 – $860
Fire risk 1/10 · Minimal
- Est. fire insurance / yr
- $839 – $1,559
Heat risk 5/10 · Moderate
- Hot days now (above 105°F)
- 7 days/yr
- Hot days in 30 yrs
- 20 days/yr
Wind risk 2/10 · Minimal
- Chance of severe wind over 30 yrs
- 2.0%
Air-quality risk 3/10 · Minor
- Unhealthy air days now
- 3 days/yr
- Unhealthy air days in 30 yrs
- 5 days/yr
Risk factors via First Street. Map © Google.
Why this score? — see what drove the C- grade
The composite is a weighted blend of 9 inputs, each scored 0–100. Each bar is that input's sub-score; the figure is the points it added to the 100-point composite (weight × sub-score).
- Cash flow +21.7/30.0
- ARV discount +7.5/15.0
- DSCR +6.9/10.0
- 1% rule +5.0/10.0
- Rent growth +3.9/5.0
- Livability +3.2/5.0
- Condition / age +2.5/5.0
- Schools +2.3/10.0
- Appreciation +0.0/10.0
$1,556,000
🖨 Deal sheet 📄 Offer letter ✓ Due diligence
Multi-family units
County records classify this as Multi-Family (5+ Unit). Listing-text estimate: 14 units. confirmed
5+ unit building — per-unit beds/baths from public records are typically unavailable; the breakdown below (if shown) is an estimate from the listing text.
Listing remarks
Located in the historic Cherokee Triangle, this 14-unit property is a rare generational offering. Purpose-built as apartments—an uncommon feature in this submarket—it consists of fourteen 1BR/1BA units with rents well below the sub-market averages. It is just steps from Louisville's most walkable corridors, with convenient access to shopping, dining, and services. Held by the same ownership for decades, the property has benefited from consistent professional management. Units feature forced air heating and central air, with tenants responsible for gas and electric, helping to control operating expenses. Additional savings are achieved through a water and trash recapture program.
Key facts
- Walkable corridors
- 14 unit property
- 9,360 sq ft lot
Tags
Property features AI
Finance
- Other: Total building area approximately 7,722 sq ft; Not located in a flood plain; Lot dimensions roughly 58.5 x 160
- HOA & community: No association fee listed
Exterior
- Parking: 14 parking spaces; No covered parking
- Utilities: Electricity connected
- Home design: Apartment property type; Contemporary architecture; Built in 1960
- Construction: Brick construction; Shingle roof; Built in 1960
- Exterior features: Balcony
Interior
- Bedrooms: No dedicated bedrooms (listed as 0)
- Heating & cooling: Forced air heating
- Interior features: Contemporary style; Balcony; Separate meters for units
Neighborhood map
What this means for you Summary
Snapshot
- This is a 14 × 1.0-bed/1.0-bath units multifamily listed at $1.56M.
Deal economics
- At list price, monthly cash flow is $2k ($29k/yr) — positive. Per door: $171/mo.
- The deal already cash-flows at list — no discount required.
- To meet the 1% rule (rent ≥ 1% of price), the offer needs to be $1.55M (0.1% below list).
- Recommended offer: $1.46M (6.0% below list) — sets the bar for market timing.
- Cap rate 8.1% vs local median 5.0% in Louisville — top-decile yield for the area; either an underpriced asset or a hidden risk that comps aren't pricing in. Stress-test before assuming the spread holds.
Location & tenants
- Location reads 63/100 on livability (#333 in KY) — a middle-class / working-renter tenant base. Strengths: cost of living A+, housing A+; Watch: employment C-, health & safety D+, schools D-.
- Jefferson County (urban): math 19% / reading 35% proficiency, ranked #121 of 165 in KY (top 73%) — low school quality limits family demand, transient renter base, plan for 1-2y turnover.
- Market conditions: Rents rising fast (+5.8%/yr); 99 active listings in the ZIP; 2,836 units permitted in Jefferson County in 2024 (1,558 in 5+ unit buildings).
- At $15,543/mo this rent would consume 262% of the median local household income ($71k/yr) (locally 761% of renters already pay >50% of income on rent) — very limited rent-growth headroom before tenants either downsize or default.
Forward outlook
- Local home prices are declining (-3.0%/yr); year-one equity from $11k of loan paydown is wiped out by about $47k of value loss. Plan a longer hold.
- Jefferson County population projected at +13% by 2050 — modest demand growth; plan on rents tracking national, not racing it.
- At projected returns (-3.0% appreciation + 5.8% rent growth), your $436k cash investment doubles in ~10 years — after that, you're playing with house money.
Negotiation context
- It's been on market 73 days — a 6% lower offer ($1.46M) is reasonable based on typical stale-listing flexibility.
Risks & watch-outs
- Climate carrying-cost: extreme-heat days projected 7→20/yr by 2055 (HVAC capex compounding) — expect insurance premiums to compound above CPI over the hold.
Questions for the listing agent
- It's been on market 73 days. Have you received any prior offers? Is the seller open to a 6% concession, seller financing, or rate buy-down credit?
- Can we see the unit-by-unit rent roll, current vacancy, and any below-market leases? What's the average tenancy length?
- What capital expenditures (roof, boiler, parking lot, exteriors) have been made in the last 5 years, and what's planned in the next 2?
- Built in 1960 — when were the roof, HVAC, electrical panel, plumbing, and water heater last replaced?
- Why hasn't it sold? Are there any deal-killer items the seller is aware of (foundation, flood, title, zoning, code violations)?
- Is there a deadline driving the sale (1031 exchange, divorce, estate, relocation)? That informs how much negotiation room exists.
- Schools are D-rated, which usually means shorter tenancies and higher turnover. Who's the typical renter profile here, and what's been the actual vacancy rate?
- Crime grade is F in this area — have there been break-ins, vandalism, or insurance claims at this property in the last 3 years? What carrier currently insures it and at what premium?
- What's the average days-on-market for RENTAL listings here right now (not sales)? A rising rental-DOM trend means longer vacancies and softer asking-rent achievability than the comps imply.
- What's the recent tenant-quality profile in this submarket — average credit score on applications, eviction rate, late-payment / NSF rate, and stable-employment percentage? A property-management company in the area should have these aggregated.
- How much new apartment / multifamily construction is in the pipeline within 1–3 miles? Heavy new supply (>2% of stock underway) typically softens rents 12–24 months out; light construction supports rent growth.
Investment metrics
- 1% rule
- 1.00% ✗
- Cap rate
- 8.14%
- Cash-on-cash
- 6.58%
- DSCR
- 1.29
- GRM
- 8.3
CMA / ARV
No comps found within radius.
Projected returns pro-forma
-3.0% appreciation · 5.76% rent growth · sell at horizon
- IRR
- -3.3%
- Equity multiple
- 0.87×
- Total profit
- $-55,914
- Equity at exit
- $232,005
- IRR
- 9.1%
- Equity multiple
- 1.78×
- Total profit
- $338,659
- Equity at exit
- $134,534
Cash invested: $435,680 (down + closing). Projections, not guarantees.
Landlord ↔ Tenant lean methodology
- Overall (STATE)
- 83 Strongly Landlord-Friendly
- State Kentucky
- 83 Strongly Landlord-Friendly · R+16
- County
- — inherits STATE
- City
- — inherits STATE
ZIP-level market 40204
- Rents YoY
- 5.8%
- Active inventory
- 99
- Price-to-rent
- 116.8×
Monthly cashflow live
- Estimated rent
- $15,543 high interval (Pro) →
- Mortgage (P&I)
- −$8,160
- Tax from tax record
- −$1,082 /mo · $12,980/yr
- Insurance
- −$648
- HOA
- −$0
- Vacancy / Maint / Mgmt
- −$3,264
- Net cashflow
- $2,389
Break-even live
14-unit breakdown (identical units grouped — click to expand)
| Units | Beds | Baths | Est. rent |
|---|---|---|---|
| 14× units | 1.0 | 1 | $15,540 |
| #1 | 1.0 | 1 | $1,110 |
| #2 | 1.0 | 1 | $1,110 |
| #3 | 1.0 | 1 | $1,110 |
| #4 | 1.0 | 1 | $1,110 |
| #5 | 1.0 | 1 | $1,110 |
| #6 | 1.0 | 1 | $1,110 |
| #7 | 1.0 | 1 | $1,110 |
| #8 | 1.0 | 1 | $1,110 |
| #9 | 1.0 | 1 | $1,110 |
| #10 | 1.0 | 1 | $1,110 |
| #11 | 1.0 | 1 | $1,110 |
| #12 | 1.0 | 1 | $1,110 |
| #13 | 1.0 | 1 | $1,110 |
| #14 | 1.0 | 1 | $1,110 |
| Total (14 units) | $15,543 | ||
UW: 25.0% down · 7.5% · 30yr · 1.5% tax · 5.0% vac · 8.0% maint · 8.0% mgmt
Financing live
Cash to close
- Down payment
- $389,000
- Closing costs
- $46,680
- Reserves months
- —
- Total cash needed
- —
Loan-product check · same deal, 3 products live
Conventional
25% down · 7.5% · 30yr
- Down + closing
- —
- Monthly P&I
- —
- Monthly cashflow
- —
- DSCR
- —
- Eligible?
- —
Personal DTI + credit; lowest rate.
DSCR
20% down · 8.5% · 30yr
- Down + closing
- —
- Monthly P&I
- —
- Monthly cashflow
- —
- DSCR
- —
- Eligible?
- —
No personal income docs; deal must DSCR.
Hard money
10% down · 12.0% · 12mo
- Down + closing
- —
- Monthly P&I
- —
- Monthly cashflow
- —
- DSCR
- —
- Eligible?
- —
Short-term bridge; refi at stabilization.
Listing history 15 events
-
2026-06-18days on market $1,556,000 Active 73 DOM
-
2026-06-17days on market $1,556,000 Active 72 DOM
-
2026-06-16days on market $1,556,000 Active 71 DOM
-
2026-06-15days on market $1,556,000 Active 70 DOM
-
2026-06-13days on market $1,556,000 Active 68 DOM
-
2026-06-10days on market $1,556,000 Active 65 DOM
-
2026-06-09days on market $1,556,000 Active 64 DOM
-
2026-06-08days on market $1,556,000 Active 63 DOM
-
2026-06-07days on market $1,556,000 Active 62 DOM
-
2026-06-03days on market $1,556,000 Active 58 DOM
-
2026-06-02days on market $1,556,000 Active 57 DOM
-
2026-06-01days on market $1,556,000 Active 56 DOM
-
2026-05-31days on market $1,556,000 Active 55 DOM
-
2026-05-11price $1,556,000
-
2026-04-06$1,810,000 Active
ⓘ Source: listings_history table (triggers on properties + properties_extension) + one-shot
backfill from property_details.listing_events for pre-trigger history.
Tax reassessment forecast KY · Resets to sale price
- Current annual tax
- $12,980 · $1,082/mo
- Projected year-2 tax
- $13,382 · $1,115/mo
- Expected delta
- +$402/yr (+$34/mo · 3.1%)
ⓘ Screening estimate from a state-policy table — verify with the county assessor before closing.
Climate risk First Street
- Flood 1/10 Low FEMA zone X (unshaded) · 0% chance over 30 yrs
- Wildfire 1/10 Low
- Heat 5/10 Major 7 d/yr ≥105°F today · 20 d/yr by 30 yrs out
- Wind 2/10 Low 2% chance of damaging wind over 30 yrs
- Air quality 3/10 Moderate 3 unhealthy d/yr today · 5 by 30 yrs out
Nearby sold comps map
Loading sold comps map…
Walkable amenities ~0.75 mi
Loading nearby amenities…
Taxation est. · year 1
- Rental income
- $186,516
- − Mortgage interest
- −$87,160
- − Property taxes
- −$12,980
- − Insurance
- −$7,780
- − Repairs & maintenance
- −$14,921
- − Management
- −$14,921
- − Depreciation
- −$45,265
- Taxable income
- $3,488
- Est. tax owed @ 24.0%
- −$837
- After-tax cash flow
- $27,833/yr
For passive investors: Depreciation is non-cash, so a rental often shows a tax loss while cash-flowing — sheltering income. Rental losses are passive: they offset passive income freely, and up to $25,000/yr can offset ordinary (W-2) income if you actively participate and your MAGI is under $100k (phasing out to $0 by $150k); unused losses carry forward. On sale, claimed depreciation is recaptured at up to 25%, and gains may owe capital-gains tax (a 1031 exchange can defer both). Figures are a year-1 estimate at your 24.0% rate — not tax advice; consult a CPA.
Schools (NCES district)
- District
- Jefferson County
- NCES district ID
- 2102990
- Math proficiency
- 19% ▼ -17.00%
- Reading proficiency
- 35% ▼ -11.00%
- Median HH income
- $47,885
- Composite
- 23.45/100
- National rank
- #7884
- State rank
- #121 of 165 in KY
Livability — Louisville
- Score
- 63/100
- State rank
- #333
- US rank
- #15887
Category grades
Schools grade is shown separately in the Schools card above.
Census & demographics
- Census place
- Louisville, KY
- County
- Jefferson County · 790,184 people
- City population
- 769,292
- Metro
- Louisville/Jefferson County, KY-IN
- Population (ZIP)
- 14,034
- Household income
- $71,116
- Rent vs Own
- Severe rent burden
- 761.0
Population outlook (Jefferson County) Hauer SSP2
- Today (2025)
- 823,112 people
- By 2030
- 849,343 · +3.2%
- By 2040
- 895,696 · +8.8%
- By 2050
- 933,630 · +13.4%
- By 2075
- 1,028,262 · +24.9%
- By 2100
- 1,072,675 · +30.3%
Race, ethnicity, and origin ACS 2023
- Neighborhood character
- Predominantly White (84%)
- Race & ethnicity
- White 84% Black 6% Two or more races 5% Hispanic / Latino 4% Asian 2%
- Common ancestry
- Slovak 3% Serbian 3% Romanian 3%
- Foreign-born
- 4% · Canada, South Korea, China
- Languages at home
- 95% English-only · Spanish 2% Korean 1% Chinese 1%
Political lean MEDSL · Jefferson
- 2024 margin
- D (+16.6) · D 57.4% · R 40.9% · Other 1.7%
- 2008→2024 swing
- +4.5pp toward D · 2008: 12.0pp · 2024: 16.6pp
- All cycles
- 2024: D+16.6 2020: D+20.1 2016: D+13.3 2012: D+11.1 2008: D+12.0
Not yet ingested
- Civics
- —
Market trends
- HPI YoY
- ▼ -475.25%
- Current HPI
- 246.3191
- Rent YoY
- ▲ 5.76%
- Metro
- Louisville/Jefferson County, KY-IN
- State GDP YoY
- ▲ 1.81%
- F500 in state
- 4
Industry mix (Fortune 500 HQ in KY)
| Industry | F500 HQs | Revenue |
|---|---|---|
| Healthcare | 1 | $118B |
|
||
| Food / Beverage | 1 | $7B |
|
||
Price history
-14.0% since first listed2 events — show timeline
- 2026-05-11 Price Changed $1,556,000 Metro Search MLS
- 2026-04-06 Listed $1,810,000 Metro Search MLS
Property tax history
+9.0%/yrLatest (2025): $12,980 · -1.9% YoY. Source: county tax records.
Cash-flow waterfall
monthlySold comps — $/sqft
last 12 mo · ≤1 miLoading sold comps…