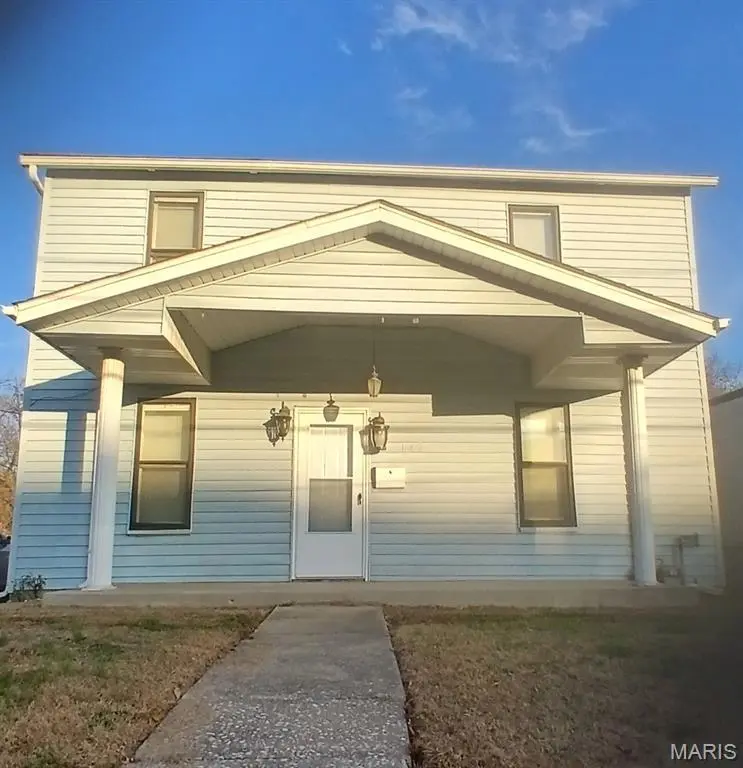
142 West St · Edwardsville, IL
Flood risk 1/10 · Minimal
- FEMA flood zone
- X
- Chance of flooding over 30 yrs
- 0.0%
- Est. flood insurance / yr
- $507 – $1,088
Fire risk 1/10 · Minimal
- Est. fire insurance / yr
- $804 – $1,492
Heat risk 5/10 · Moderate
- Hot days now (above 108°F)
- 7 days/yr
- Hot days in 30 yrs
- 20 days/yr
Wind risk 2/10 · Minimal
- Chance of severe wind over 30 yrs
- 1.0%
Air-quality risk 3/10 · Minor
- Unhealthy air days now
- 3 days/yr
- Unhealthy air days in 30 yrs
- 5 days/yr
Risk factors via First Street. Map © Google.
Why this score? — see what drove the D+ grade
The composite is a weighted blend of 9 inputs, each scored 0–100. Each bar is that input's sub-score; the figure is the points it added to the 100-point composite (weight × sub-score).
- Cash flow +14.9/30.0
- ARV discount +11.2/15.0
- DSCR +4.6/10.0
- Livability +4.5/5.0
- 1% rule +4.2/10.0
- Schools +3.5/10.0
- Condition / age +2.5/5.0
- Rent growth +1.7/5.0
- Appreciation +0.0/10.0
$160,000
🖨 Deal sheet 📄 Offer letter ✓ Due diligence
Listing remarks MLS
Welcome home to 142 W Street, a truly unique opportunity offering the perfect blend of cozy residential comfort and vibrant commercial potential, all nestled in the highly sought-after community of Edwardsville, Illinois. This charming property, with its inviting atmosphere, is ready to be transformed into your ideal living space, a thriving small business, or perhaps both! This location could be perfect for a neighborhood cafe, health and wellness, professional office or Boutique retail. This location also benefits from easy access to the vibrant Downtown Edwardsville area, with its shops, restaurants, and entertainment, as well as various parks and recreational facilities. The address places it within the highly regarded Edwardsville Community Unit School District No. 7 with Lincoln Middle School directly across the street.
Key facts
- 7,501 sq ft lot
- Built 1920
- Listed 160 days
Tags
Neighborhood map
What this means for you Summary
Snapshot
- This is a 3-bed/1.0-bath single-family listed at $160k.
Deal economics
- At list price, monthly cash flow is $47 ($570/yr) — positive.
- The deal already cash-flows at list — no discount required.
- To meet the 1% rule (rent ≥ 1% of price), the offer needs to be $147k (8.2% below list).
- Recommended offer: $141k (12.0% below list) — sets the bar for market timing.
- Cap rate 6.6% vs local median 3.4% in Edwardsville — top-decile yield for the area; either an underpriced asset or a hidden risk that comps aren't pricing in. Stress-test before assuming the spread holds.
Location & tenants
- Location reads 90/100 on livability (#3 in IL, #83 nationally) — a professional / high-income tenant draw. Strengths: crime A+, amenities A+, commute A+.
- Edwardsville CUSD 7 (suburban): math 39% / reading 36% proficiency, ranked #142 of 620 in IL (top 23%) — families likely to look elsewhere, expect single-tenant / working-renter base with shorter leases; only 16% free/reduced lunch — higher-income household profile.
- Market conditions: Rents falling (-3.4%/yr); 203 active listings in the ZIP; 14 comparable units currently listed for rent nearby; rentals at typical pace (median 20d on market — plan ~3-4 weeks tenant-placement turnaround); solid renter incomes; 336 units permitted in Madison County in 2024 (0 in 5+ unit buildings).
- This rent is only 17% of the median local income ($101k/yr) — well below the 30% rent-burden line; pricing power to push rent on renewal without tenant pushback.
Forward outlook
- Local home prices are declining (-3.0%/yr); year-one equity from $1k of loan paydown is wiped out by about $5k of value loss. Plan a longer hold.
- Madison County population projected at -18% by 2050 — secular population decline; favor cash flow + early exit over multi-decade hold.
Negotiation context
- It's been on market 161 days — a 12% lower offer ($141k) is reasonable based on typical stale-listing flexibility.
Risks & watch-outs
- Watch-outs: built in 1920 — expect roof / HVAC / electrical / plumbing capex.
- Climate carrying-cost: extreme-heat days projected 7→20/yr by 2055 (HVAC capex compounding) — expect insurance premiums to compound above CPI over the hold.
Questions for the listing agent
- It's been on market 161 days. Have you received any prior offers? Is the seller open to a 12% concession, seller financing, or rate buy-down credit?
- Built in 1920 — when were the roof, HVAC, electrical panel, plumbing, and water heater last replaced?
- Why hasn't it sold? Are there any deal-killer items the seller is aware of (foundation, flood, title, zoning, code violations)?
- Is there a deadline driving the sale (1031 exchange, divorce, estate, relocation)? That informs how much negotiation room exists.
- Schools are A-rated — typically a magnet for longer-tenancy family renters. What's the average tenant stay here, and is there a school-zone premium baked into asking?
- The area grade is low — what's the realistic commute time and amenity access for the typical tenant pool here? Any planned neighborhood developments (good or bad) we should know about?
- What's the average days-on-market for RENTAL listings here right now (not sales)? A rising rental-DOM trend means longer vacancies and softer asking-rent achievability than the comps imply.
- What's the recent tenant-quality profile in this submarket — average credit score on applications, eviction rate, late-payment / NSF rate, and stable-employment percentage? A property-management company in the area should have these aggregated.
- How much new for-sale + rental construction is in the pipeline within 1–3 miles? Heavy new supply typically softens prices + rents 12–24 months out; constrained supply supports both.
Investment metrics
- 1% rule
- 0.92% ✗
- Cap rate
- 6.65%
- Cash-on-cash
- 1.27%
- DSCR
- 1.06
- GRM
- 9.1
CMA / ARV
- ARV (median comp)
- $174,155
- List price
- $160,000
- Delta
- -8.13%
- Verdict
- FAIR
- Comps
- 20 within 1.0 mi
Show comp detail 12 sales within ~0.75 mi
| Address | Dist | Beds/Ba | Sqft | Sold | Price | $/sf | Match |
|---|---|---|---|---|---|---|---|
| 801 Kingshighway St | 0.40mi | 3/1.5 | 1,087 (+2%) | 16mo | $179,900 | $166 | 62 |
| 406 Buena Vista St | 0.43mi | 3/1.5 | 1,134 (+7%) | 9mo | $253,000 | $223 | 59 |
| 315 Spring St | 0.36mi | 2/1.0 (-1) | 1,130 (+6%) | 15mo | $169,000 | $150 | 56 |
| 422 E Park St | 0.73mi | 2/1.0 (-1) | 1,034 (-3%) | 2mo | $219,000 | $212 | 55 |
| 311 Grandview Dr | 0.29mi | 3/1.5 | 1,158 (+9%) | 18mo | $250,000 | $216 | 55 |
| 456 Buena Vista St | 0.49mi | 3/1.0 | 1,188 (+12%) | 9mo | $235,000 | $198 | 50 |
| 139 E Dunn St | 0.56mi | 2/1.0 (-1) | 1,014 (-5%) | 15mo | $195,000 | $192 | 48 |
| 609 Grandview Dr | 0.50mi | 2/1.0 (-1) | 984 (-8%) | 15mo | $200,000 | $203 | 47 |
| 1319 Randle St | 0.68mi | 2/1.0 (-1) | 974 (-8%) | 5mo | $155,000 | $159 | 45 |
| 238 S Fillmore St | 0.69mi | 2/1.5 (-1) | 966 (-9%) | 0mo | $225,000 | $233 | 45 |
| 1304 Eberhart Ave | 0.66mi | 2/2.0 (-1) | 1,145 (+8%) | 4mo | $249,900 | $218 | 44 |
| 458 Cass Ave | 0.69mi | 2/1.0 (-1) | 1,124 (+6%) | 13mo | $200,000 | $178 | 43 |
Match score weights: distance 35% · size 25% · config 20% · recency 20%. Top-matched comps best support the ARV.
Projected returns pro-forma
-3.0% appreciation · 0.0% rent growth · sell at horizon
- IRR
- -17.7%
- Equity multiple
- 0.39×
- Total profit
- $-27,179
- Equity at exit
- $23,857
- IRR
- -17.0%
- Equity multiple
- 0.19×
- Total profit
- $-36,294
- Equity at exit
- $13,834
Cash invested: $44,800 (down + closing). Projections, not guarantees.
Landlord ↔ Tenant lean methodology
- Overall (STATE)
- 43 Moderately Tenant-Leaning
- State Illinois
- 43 Moderately Tenant-Leaning · D+7
- County
- — inherits STATE
- City
- — inherits STATE
ZIP-level market 62025
- Home prices YoY
- -22.2%
- Rents YoY
- -3.4%
- Active inventory
- 203
- Price-to-rent
- 9.1×
Monthly cashflow live
- Estimated rent
- $1,468 high interval (Pro) →
- Mortgage (P&I)
- −$839
- Tax from tax record
- −$207 /mo · $2,479/yr
- Insurance
- −$67
- HOA
- −$0
- Vacancy / Maint / Mgmt
- −$308
- Net cashflow
- $47
Break-even live
UW: 25.0% down · 7.5% · 30yr · 1.5% tax · 5.0% vac · 8.0% maint · 8.0% mgmt
Financing live
Cash to close
- Down payment
- $40,000
- Closing costs
- $4,800
- Reserves months
- —
- Total cash needed
- —
Loan-product check · same deal, 3 products live
Conventional
25% down · 7.5% · 30yr
- Down + closing
- —
- Monthly P&I
- —
- Monthly cashflow
- —
- DSCR
- —
- Eligible?
- —
Personal DTI + credit; lowest rate.
DSCR
20% down · 8.5% · 30yr
- Down + closing
- —
- Monthly P&I
- —
- Monthly cashflow
- —
- DSCR
- —
- Eligible?
- —
No personal income docs; deal must DSCR.
Hard money
10% down · 12.0% · 12mo
- Down + closing
- —
- Monthly P&I
- —
- Monthly cashflow
- —
- DSCR
- —
- Eligible?
- —
Short-term bridge; refi at stabilization.
Rent comps 14 comps
| Address | Beds | Baths | Sqft | Rent | $/sqft | DOM | Units | Dist |
|---|---|---|---|---|---|---|---|---|
| 305 Pine St Unit 305-D Edwardsville, IL | 2.0 | 1.0 | 750 | $1,150 | $1.53 | 11d | 1 | 0.05mi |
| 400 W Union St Unit 424-5 Edwardsville, IL | 2.0 | 1.5 | 800 | $1,200 | $1.50 | 23d | 1 | 0.34mi |
| 210 Garden St Edwardsville, IL | 3.0 | 2.0 | 1500 | $1,725 | $1.15 | 11d | 1 | 0.39mi |
| 1010 Enclave Blvd Edwardsville, IL | 2.0 | 1.0–2.0 | 791 | $1,950 | $2.46 | 1d | 6 | 0.45mi |
| 505 N Main St Unit 505-A Edwardsville, IL | 3.0 | 1.0 | 1000 | $1,099 | $1.10 | 19d | 1 | 0.47mi |
| 300 S Main St Unit 06 Edwardsville, IL | 2.0 | 1.5 | 900 | $1,425 | $1.58 | 43d | 1 | 0.51mi |
| 300 S Main St Edwardsville, IL | 2.0 | 1.5 | 900 | $1,425 | $1.58 | 14d | 1 | 0.51mi |
| 803 Lancashire Dr Edwardsville, IL | 2.0 | 1.0 | 1060 | $1,350 | $1.27 | 1d | 5 | 0.61mi |
| 813 Klein Ave Edwardsville, IL | 2.0 | 1.5 | 900 | $1,350 | $1.50 | 21d | 1 | 0.84mi |
| 1058 Enclave Blvd Edwardsville, IL | 3.0 | 3.0 | 1100 | $1,825 | $1.66 | 1d | 1 | 0.86mi |
| 1040 University Dr Unit 10 Edwardsville, IL | 2.0 | 2.0 | 1215 | $1,495 | $1.23 | 44d | 1 | 0.89mi |
| 1124 University Dr Unit 1124-1 Edwardsville, IL | 2.0 | 1.0 | 800 | $1,250 | $1.56 | 23d | 1 | 1.03mi |
| 30 Devon Ct Unit 30-5 Edwardsville, IL | 3.0 | 2.0 | 900 | $1,550 | $1.72 | 7d | 1 | 1.08mi |
| 50 Devon Ct Edwardsville, IL | 2.0 | 1.0 | 850 | $1,595 | $1.88 | 23d | 1 | 1.09mi |
Listing history 2 events
-
2026-02-10price $160,000 842-char remark
Show marketing remark (842 chars)
Welcome home to 142 W Street, a truly unique opportunity offering the perfect blend of cozy residential comfort and vibrant commercial potential, all nestled in the highly sought-after community of Edwardsville, Illinois. This charming property, with its inviting atmosphere, is ready to be transformed into your ideal living space, a thriving small business, or perhaps both! This location could be perfect for a neighborhood cafe, health and wellness, professional office or Boutique retail. This location also benefits from easy access to the vibrant Downtown Edwardsville area, with its shops, restaurants, and entertainment, as well as various parks and recreational facilities. The address places it within the highly regarded Edwardsville Community Unit School District No. 7 with Lincoln Middle School directly across the street.
-
2025-12-16$180,000 Active 842-char remark
Show marketing remark (842 chars)
Welcome home to 142 W Street, a truly unique opportunity offering the perfect blend of cozy residential comfort and vibrant commercial potential, all nestled in the highly sought-after community of Edwardsville, Illinois. This charming property, with its inviting atmosphere, is ready to be transformed into your ideal living space, a thriving small business, or perhaps both! This location could be perfect for a neighborhood cafe, health and wellness, professional office or Boutique retail. This location also benefits from easy access to the vibrant Downtown Edwardsville area, with its shops, restaurants, and entertainment, as well as various parks and recreational facilities. The address places it within the highly regarded Edwardsville Community Unit School District No. 7 with Lincoln Middle School directly across the street.
ⓘ Source: listings_history table (triggers on properties + properties_extension) + one-shot
backfill from property_details.listing_events for pre-trigger history.
Tax reassessment forecast IL · Partial reset (capped growth)
- Current annual tax
- $2,479 · $207/mo
- Projected year-2 tax
- $3,055 · $255/mo
- Expected delta
- +$577/yr (+$48/mo · 23.3%)
ⓘ Screening estimate from a state-policy table — verify with the county assessor before closing.
Climate risk First Street
- Flood 1/10 Low FEMA zone X · 0% chance over 30 yrs
- Wildfire 1/10 Low
- Heat 5/10 Major 7 d/yr ≥108°F today · 20 d/yr by 30 yrs out
- Wind 2/10 Low 100% chance of damaging wind over 30 yrs
- Air quality 3/10 Moderate 3 unhealthy d/yr today · 5 by 30 yrs out
Nearby sold comps map
Loading sold comps map…
Walkable amenities ~0.75 mi
Loading nearby amenities…
Taxation est. · year 1
- Rental income
- $17,617
- − Mortgage interest
- −$8,962
- − Property taxes
- −$2,479
- − Insurance
- −$800
- − Repairs & maintenance
- −$1,409
- − Management
- −$1,409
- − Depreciation
- −$4,655
- Taxable loss
- −$2,098
- Est. tax savings @ 24.0%
- +$503
- After-tax cash flow
- $1,073/yr
For passive investors: Depreciation is non-cash, so a rental often shows a tax loss while cash-flowing — sheltering income. Rental losses are passive: they offset passive income freely, and up to $25,000/yr can offset ordinary (W-2) income if you actively participate and your MAGI is under $100k (phasing out to $0 by $150k); unused losses carry forward. On sale, claimed depreciation is recaptured at up to 25%, and gains may owe capital-gains tax (a 1031 exchange can defer both). Figures are a year-1 estimate at your 24.0% rate — not tax advice; consult a CPA.
Schools (NCES district)
- District
- Edwardsville CUSD 7
- NCES district ID
- 1713530
- Math proficiency
- 39% ▼ -12.00%
- Reading proficiency
- 36% ▼ -17.00%
- Median HH income
- $72,131
- Composite
- 34.56/100
- National rank
- #5169
- State rank
- #142 of 620 in IL
Livability — Edwardsville
- Score
- 90/100
- State rank
- #3
- US rank
- #83
Category grades
Schools grade is shown separately in the Schools card above.
Census & demographics
- Census place
- Edwardsville, IL
- County
- Madison County · 189,064 people
- City population
- 35,520
- Metro
- St. Louis, MO-IL
- Population (ZIP)
- 35,520
- Household income
- $100,741
- Rent vs Own
- Severe rent burden
- 1027.0
Population outlook (Madison County) Hauer SSP2
- Today (2025)
- 258,371 people
- By 2030
- 251,523 · -2.7%
- By 2040
- 233,640 · -9.6%
- By 2050
- 213,042 · -17.5%
- By 2075
- 165,255 · -36.0%
- By 2100
- 123,953 · -52.0%
Race, ethnicity, and origin ACS 2023
- Neighborhood character
- Predominantly White (87%)
- Race & ethnicity
- White 87% Black 5% Two or more races 4% Hispanic / Latino 3% Asian 2%
- Common ancestry
- Romanian 2% Lithuanian 2% Slovak 2%
- Foreign-born
- 3% · Canada, China
- Languages at home
- 96% English-only · Spanish 2% Other Indo-European 1%
Political lean MEDSL · Madison
- 2024 margin
- R (+13.3) · D 42.5% · R 55.8% · Other 1.8%
- 2008→2024 swing
- -22.5pp toward R · 2008: 9.2pp · 2024: -13.3pp
- All cycles
- 2024: R+13.3 2020: R+13.2 2016: R+15.6 2012: R+1.4 2008: D+9.2
Not yet ingested
- Civics
- —
Market trends
- HPI YoY
- ▼ -70.36%
- Current HPI
- 245.9787
- Rent YoY
- ▼ -3.37%
- Metro
- St. Louis, MO-IL
- State GDP YoY
- ▲ 1.59%
- F500 in state
- 60
Industry mix (Fortune 500 HQ in IL)
| Industry | F500 HQs | Revenue |
|---|---|---|
| Insurance | 4 | $201B |
|
||
| Consumer Goods | 4 | $87B |
|
||
| Industrial Machinery | 3 | $64B |
|
||
| Healthcare | 2 | $55B |
|
||
| Retail / Pharmacy | 1 | $148B |
|
||
| Agriculture / Food | 1 | $86B |
|
||
Price history
-11.1% since first listed2 events — show timeline
- 2026-02-10 Price Changed $160,000 MARIS as Distributed by MLS Grid
- 2025-12-16 Listed $180,000 MARIS as Distributed by MLS Grid
Property tax history
+6.4%/yrLatest (2024): $2,479 · +6.2% YoY. Source: county tax records.
Cash-flow waterfall
monthlySold comps — $/sqft
last 12 mo · ≤1 miLoading sold comps…