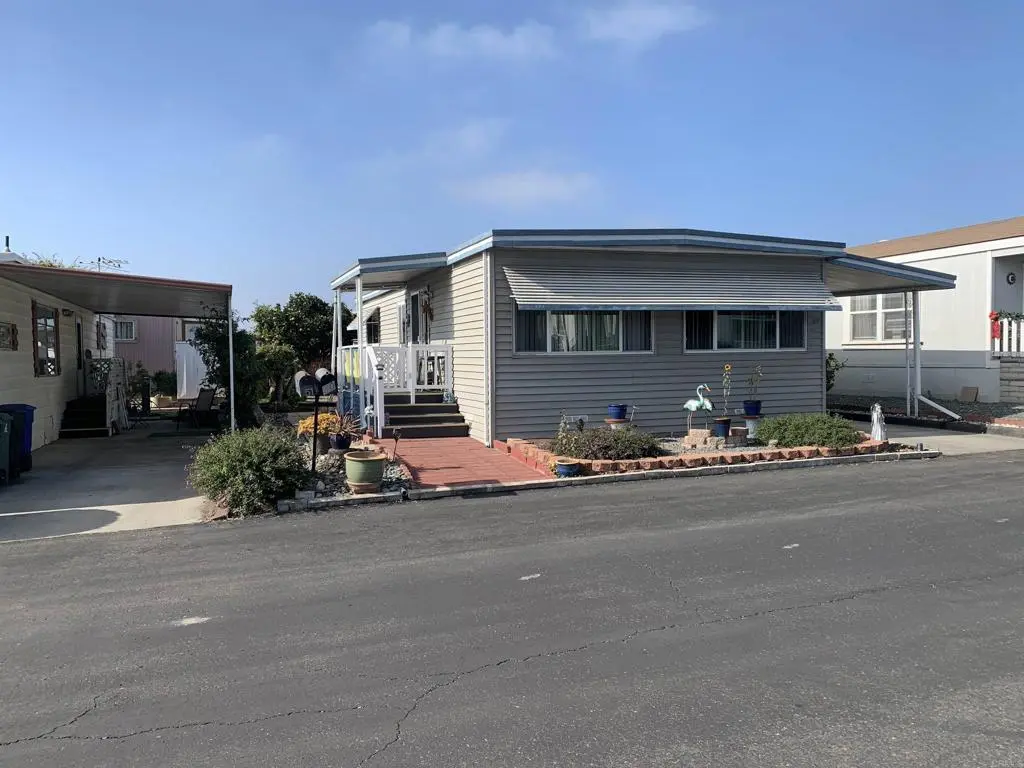
501 Anita Street Spc 50 · Chula Vista, CA
Flood risk 1/10 · Minimal
- FEMA flood zone
- X (unshaded)
- Chance of flooding over 30 yrs
- 0.0%
- Est. flood insurance / yr
- $507 – $1,088
Fire risk 1/10 · Minimal
- Est. fire insurance / yr
- $659 – $1,223
Heat risk 4/10 · Minor
- Hot days now (above 86°F)
- 6 days/yr
- Hot days in 30 yrs
- 17 days/yr
Wind risk 1/10 · Minimal
- Chance of severe wind over 30 yrs
- —
Air-quality risk 1/10 · Minimal
- Unhealthy air days now
- 0 days/yr
- Unhealthy air days in 30 yrs
- 0 days/yr
Risk factors via First Street. Map © Google.
Why this score? — see what drove the B grade
The composite is a weighted blend of 9 inputs, each scored 0–100. Each bar is that input's sub-score; the figure is the points it added to the 100-point composite (weight × sub-score).
- Cash flow +30.0/30.0
- 1% rule +10.0/10.0
- DSCR +10.0/10.0
- ARV discount +9.7/15.0
- Schools +3.9/10.0
- Livability +3.8/5.0
- Condition / age +2.5/5.0
- Rent growth +1.9/5.0
- Appreciation +0.0/10.0
$159,000
🖨 Deal sheet 📄 Offer letter ✓ Due diligence
Listing remarks MLS
MAKE OFFER NOW!! OWNER WANTS IT SOLD! Spotless and ready for new owner. Great home in 55+ park. This 2BR/1BA home features newer dual pane windows & sliding door, berber carpeting, tile, bathroom cabinets, and siding. Includes earthquake strapping underneath, new vertical blinds in the living room and dining area. Easy care yard with palms and plumerias that give a tropical feel. There is a nice sitting area and two storage sheds in the back. Buyer to verify measurements.
Key facts
- 13.38 acre lot
- 2 parking spots
- Community pool
Property features AI
Finance
- Other: Lot size and living area sourced from public records
- Financial info: Land lease of $1,200
- HOA & community: Part of an association; Senior community; Community features include biking, street lighting, sidewalks, and a park
Exterior
- Parking: 2 parking spaces; 2 carport spaces; Located in Granada Mobile Estates
- Utilities: Public sewer
- Home design: Single-story manufactured/mobile home (20' x 40'); Entry on main level
- Construction: Year built per assessor; Mobile home construction
- Exterior features: Community pool; Lot is level/flat; Close to clubhouse
Interior
- Kitchen: Kitchen (appliances not listed)
- Bedrooms: Main floor bedroom
- Bathrooms: 1 full bathroom
- Heating & cooling: Central cooling
- Interior features: One-level home; Entry; Living room; Has view
- Laundry & utility: Laundry hookups for gas and electric dryer; Has laundry
Neighborhood map
What this means for you Summary
Snapshot
- This is a 2-bed/1.0-bath manufactured listed at $159k.
Deal economics
- At list price, monthly cash flow is $812 ($10k/yr) — positive.
- The deal already cash-flows at list — no discount required.
- Meets the 1% rule at list price ($2k rent vs $159k).
- Recommended offer: $154k (3.0% below list) — sets the bar for market timing.
- Cap rate 12.4% vs local median 2.7% in Chula Vista — top-decile yield for the area; either an underpriced asset or a hidden risk that comps aren't pricing in. Stress-test before assuming the spread holds.
Location & tenants
- Location reads 75/100 on livability (#127 in CA, #4,345 nationally) — a middle-class / working-renter tenant base. Strengths: amenities A+, commute A+, employment A+; Watch: health & safety C-, cost of living F.
- Sweetwater Union High (suburban): math 36% / reading 52% proficiency, ranked #187 of 517 in CA (top 36%) — families likely to look elsewhere, expect single-tenant / working-renter base with shorter leases.
- Market conditions: Rents soft (-2.6%/yr); 159 active listings in the ZIP; 40 comparable units currently listed for rent nearby; rentals leasing fast (median 2d on market — plan ~1-2 weeks tenant-placement turnaround); solid renter incomes; 11,759 units permitted in San Diego County in 2024 (7,244 in 5+ unit buildings).
- This rent runs 35% of the median local income ($82k/yr) — at the standard rent-burdened threshold; future hikes will face affordability resistance.
Forward outlook
- Local home prices are declining (-3.0%/yr); year-one equity from $1k of loan paydown is wiped out by about $5k of value loss. Plan a longer hold.
- San Diego County population projected at +20% by 2050 — long-run rental-demand tailwind backs the buy-and-hold thesis.
- At projected returns (-3.0% appreciation + 0.0% rent growth), your $45k cash investment doubles in ~7 years — after that, you're playing with house money.
Negotiation context
- It's been on market 43 days — a 3% lower offer ($154k) is reasonable based on typical stale-listing flexibility.
- 3 sale attempts since 18y ago with the ask held roughly flat each time — persistent listings suggest the price (not the market) is what's stuck; bring a comps-based counter.
- Current owner paid $25k; list at $159k implies a 536% gain — meaningful room to come down on a strong offer.
Questions for the listing agent
- It's been on market 43 days. Have you received any prior offers? Is the seller open to a 3% concession, seller financing, or rate buy-down credit?
- Built in 1969 — when were the roof, HVAC, electrical panel, plumbing, and water heater last replaced?
- Is there a deadline driving the sale (1031 exchange, divorce, estate, relocation)? That informs how much negotiation room exists.
- Schools are B-rated — typically a magnet for longer-tenancy family renters. What's the average tenant stay here, and is there a school-zone premium baked into asking?
- What's the average days-on-market for RENTAL listings here right now (not sales)? A rising rental-DOM trend means longer vacancies and softer asking-rent achievability than the comps imply.
- What's the recent tenant-quality profile in this submarket — average credit score on applications, eviction rate, late-payment / NSF rate, and stable-employment percentage? A property-management company in the area should have these aggregated.
- How much new for-sale + rental construction is in the pipeline within 1–3 miles? Heavy new supply typically softens prices + rents 12–24 months out; constrained supply supports both.
Investment metrics
- 1% rule
- 1.52% ✓
- Cap rate
- 12.42%
- Cash-on-cash
- 21.90%
- DSCR
- 1.97
- GRM
- 5.5
CMA / ARV
- ARV (on-the-fly)
- $167,200
- Comps found
- 7
Show comp detail 7 sales within ~0.75 mi
| Address | Dist | Beds/Ba | Sqft | Sold | Price | $/sf | Match |
|---|---|---|---|---|---|---|---|
| 444 Anita St Spc 64 | 0.22mi | 2/1.0 | 800 (0%) | 17mo | $133,000 | $166 | 76 |
| 521 Orange Ave #77 | 0.36mi | 2/1.5 | 800 (0%) | 20mo | $310,000 | $388 | 64 |
| 523 Anita St #10 | 0.16mi | 2/1.0 | 753 (-6%) | 23mo | $167,000 | $222 | 63 |
| 444 Anita St Spc 11 | 0.21mi | 3/1.0 (+1) | 720 (-10%) | 12mo | $157,000 | $218 | 58 |
| 1500 Third Avenue #44 | 0.44mi | 2/1.0 | 728 (-9%) | 12mo | $152,000 | $209 | 54 |
| 501 Anita St Spc 37 | 0.13mi | 2/2.0 | 900 (+12%) | 19mo | $125,000 | $139 | 54 |
| 1500 Third Ave #13 | 0.39mi | 2/1.0 | 720 (-10%) | 16mo | $141,100 | $196 | 52 |
Match score weights: distance 35% · size 25% · config 20% · recency 20%. Top-matched comps best support the ARV.
Projected returns pro-forma
-3.0% appreciation · 0.0% rent growth · sell at horizon
- IRR
- 11.1%
- Equity multiple
- 1.43×
- Total profit
- $18,927
- Equity at exit
- $23,707
- IRR
- 17.6%
- Equity multiple
- 2.25×
- Total profit
- $55,861
- Equity at exit
- $13,747
Cash invested: $44,520 (down + closing). Projections, not guarantees.
Landlord ↔ Tenant lean methodology
- Overall (STATE)
- 18 Strongly Tenant-Friendly
- State California
- 18 Strongly Tenant-Friendly · D+13
- County
- — inherits STATE
- City
- — inherits STATE
ZIP-level market 91911
- Rents YoY
- -2.6%
- Active inventory
- 159
- Price-to-rent
- 5.5×
Monthly cashflow live
- Estimated rent
- $2,419 high interval (Pro) →
- Mortgage (P&I)
- −$834
- Tax est. 1.5%
- −$199 /mo · $2,385/yr
- Insurance
- −$66
- HOA
- −$0
- Vacancy / Maint / Mgmt
- −$508
- Net cashflow
- $812
Break-even live
UW: 25.0% down · 7.5% · 30yr · 1.5% tax · 5.0% vac · 8.0% maint · 8.0% mgmt
Financing live
Cash to close
- Down payment
- $39,750
- Closing costs
- $4,770
- Reserves months
- —
- Total cash needed
- —
Loan-product check · same deal, 3 products live
Conventional
25% down · 7.5% · 30yr
- Down + closing
- —
- Monthly P&I
- —
- Monthly cashflow
- —
- DSCR
- —
- Eligible?
- —
Personal DTI + credit; lowest rate.
DSCR
20% down · 8.5% · 30yr
- Down + closing
- —
- Monthly P&I
- —
- Monthly cashflow
- —
- DSCR
- —
- Eligible?
- —
No personal income docs; deal must DSCR.
Hard money
10% down · 12.0% · 12mo
- Down + closing
- —
- Monthly P&I
- —
- Monthly cashflow
- —
- DSCR
- —
- Eligible?
- —
Short-term bridge; refi at stabilization.
Rent comps 40 comps
| Address | Beds | Baths | Sqft | Rent | $/sqft | DOM | Units | Dist |
|---|---|---|---|---|---|---|---|---|
| 2847 Main St Chula Vista, CA | 1.0 | 1.0 | 600 | $1,495 | $2.49 | 22d | 1 | 0.18mi |
| 393 Montgomery St Unit 4 Chula Vista, CA | 2.0 | 1.0 | 757 | $2,095 | $2.77 | 10d | 1 | 0.20mi |
| 528 Anita St #59 Chula Vista, CA | 1.0 | 1.0 | 636 | $2,000 | $3.14 | 1d | 1 | 0.26mi |
| 317 Tremont St Unit 5 Chula Vista, CA | 2.0 | 1.0 | 870 | $2,295 | $2.64 | 1d | 1 | 0.40mi |
| 1486 Broadway Chula Vista, CA | 1.0 | 1.0 | 605 | $1,995 | $3.30 | 1d | 1 | 0.42mi |
| 307 Orange Ave Chula Vista, CA | 1.0–2.0 | 1.0–2.0 | 662 | $2,225 | $3.36 | 1d | 2 | 0.46mi |
| 1311 Fourth Ave Chula Vista, CA | 3.0 | 1.0–2.0 | 824 | $3,292 | $3.99 | 1d | 9 | 0.59mi |
| 1250 Fifth Ave Chula Vista, CA | 2.0–3.0 | 2.0 | 1045 | $2,500 | $2.39 | 1d | 4 | 0.67mi |
| 1225 Broadway Chula Vista, CA | 1.0–2.0 | 1.0–2.0 | 837 | $2,701 | $3.23 | 1d | 12 | 0.71mi |
| 240 Quintard St Chula Vista, CA | 1.0–2.0 | 1.0 | 662 | $2,400 | $3.62 | 1d | 4 | 0.73mi |
| 1440 Second Ave Chula Vista, CA | 1.0 | 1.0 | 603 | $2,210 | $3.67 | 1d | 1 | 0.73mi |
| 1240 Fourth Ave Chula Vista, CA | 3.0 | 1.0 | 1000 | $4,588 | $4.59 | 3d | 1 | 0.73mi |
| 555 Oxford St Chula Vista, CA | 1.0–2.0 | 1.0 | 579 | $2,362 | $4.08 | 1d | 1 | 0.76mi |
| 210 Quintard St Chula Vista, CA | 1.0 | 1.0 | 685 | $1,785 | $2.61 | 1d | 2 | 0.79mi |
| 495 Queen Anne Dr Unit 1 Chula Vista, CA | 2.0 | 1.0 | 1000 | $2,800 | $2.80 | 3d | 1 | 0.87mi |
| 1145 Fourth Ave Chula Vista, CA | 1.0 | 1.0 | 700 | $1,945 | $2.78 | 1d | 1 | 0.98mi |
| 236 Kennedy St Unit 13 Chula Vista, CA | 1.0 | 1.0 | 625 | $1,950 | $3.12 | 1d | 1 | 0.98mi |
| 1105 Fourth Ave Chula Vista, CA | 1.0–2.0 | 1.0–2.0 | 848 | $2,775 | $3.27 | 1d | 1 | 1.06mi |
| 868 Elise St Unit B Chula Vista, CA | 3.0 | 1.0 | 909 | $2,400 | $2.64 | 1d | 1 | 1.07mi |
| 540 Naples St Chula Vista, CA | 1.0 | 1.0 | 650 | $1,850 | $2.85 | 1d | 1 | 1.08mi |
| 520 Naples St Chula Vista, CA | 1.0 | 1.0 | 625 | $1,925 | $3.08 | 2d | 4 | 1.08mi |
| 1055 Granjas Rd Chula Vista, CA | 1.0 | 1.0 | 550 | $1,795 | $3.26 | 1d | 2 | 1.13mi |
| 1051 Broadway Unit 13 Chula Vista, CA | 2.0 | 2.0 | 875 | $2,325 | $2.66 | 1d | 1 | 1.17mi |
| 1051 Broadway Unit 17 Chula Vista, CA | 1.0 | 1.0 | 602 | $2,095 | $3.48 | 1d | 1 | 1.17mi |
| 1051 Broadway Unit 49 Chula Vista, CA | 2.0 | 2.0 | 770 | $2,225 | $2.89 | 1d | 1 | 1.17mi |
| 1067 Fourth Ave Chula Vista, CA | 2.0 | 1.0–2.0 | 702 | $2,855 | $4.06 | 1d | 1 | 1.17mi |
| 128 Henry Ln Unit B Chula Vista, CA | 2.0 | 1.0 | 1000 | $2,100 | $2.10 | 1d | 1 | 1.20mi |
| 511 Wykes St Chula Vista, CA | 2.0 | 1.0 | 1000 | $2,650 | $2.65 | 3d | 1 | 1.22mi |
| 1487 Hilltop Dr Chula Vista, CA | 2.0 | 2.0 | 680 | $2,399 | $3.53 | 1d | 1 | 1.24mi |
| 768 Hollister St San Diego, CA | 2.0 | 2.0 | 840 | $2,300 | $2.74 | 2d | 1 | 1.24mi |
| 1035 Fourth Ave Chula Vista, CA | 2.0 | 2.0 | 910 | $2,495 | $2.74 | 17d | 2 | 1.25mi |
| 1038 Oaklawn Ave Chula Vista, CA | 3.0 | 1.5 | 1044 | $3,995 | $3.83 | 1d | 1 | 1.28mi |
| 615 Moss St Chula Vista, CA | 2.0 | 2.0 | 800 | $2,400 | $3.00 | 1d | 2 | 1.29mi |
| 3875 Main St Chula Vista, CA | 1.0–2.0 | 1.0–2.0 | 813 | $2,950 | $3.63 | 1d | 9 | 1.29mi |
| 1051 Del Mar Ave Chula Vista, CA | 1.0 | 1.0 | 600 | $1,895 | $3.16 | 1d | 3 | 1.32mi |
| 3865 Main St Chula Vista, CA | 2.0 | 2.0 | 741 | $2,950 | $3.98 | 14d | 1 | 1.33mi |
| 574 Moss St Chula Vista, CA | 1.0–2.0 | 1.0 | 749 | $2,740 | $3.66 | 1d | 1 | 1.33mi |
| 986 Broadway Unit 982-209 Chula Vista, CA | 1.0 | 1.0 | 725 | $2,595 | $3.58 | 18d | 1 | 1.34mi |
| 986 Broadway Unit 982-313 Chula Vista, CA | 2.0 | 2.0 | 1020 | $2,995 | $2.94 | 14d | 1 | 1.34mi |
| 986 Broadway Unit 982-314 Chula Vista, CA | 2.0 | 2.0 | 1044 | $3,295 | $3.16 | 7d | 1 | 1.34mi |
Listing history 20 events
-
2026-06-18days on market $159,000 Active 43 DOM
-
2026-06-17days on market $159,000 Active 42 DOM
-
2026-06-16days on market $159,000 Active 41 DOM
-
2026-06-15days on market $159,000 Active 40 DOM
-
2026-06-13days on market $159,000 Active 38 DOM
-
2026-06-13days on market $159,000 Active 37 DOM
-
2026-06-09days on market $159,000 Active 34 DOM
-
2026-06-08days on market $159,000 Active 33 DOM
-
2026-06-07days on market $159,000 Active 32 DOM
-
2026-06-04days on market $159,000 Active 29 DOM
-
2026-06-03days on market $159,000 Active 28 DOM
-
2026-06-02days on market $159,000 Active 27 DOM
-
2026-06-01days on market $159,000 Active 26 DOM
-
2026-05-31days on market $159,000 Active 25 DOM
-
2026-05-06$159,000 Active
-
2026-05-06historical
-
2026-04-10price $159,000
-
2025-12-16$179,000 Active
-
2009-05-13soldstatus $25,000 482-char remark
Show marketing remark (482 chars)
MAKE OFFER NOW!! OWNER WANTS IT SOLD! Spotless and ready for new owner. Great home in 55+ park. This 2BR/1BA home features newer dual pane windows & sliding door, berber carpeting, tile, bathroom cabinets, and siding. Includes earthquake strapping underneath, new vertical blinds in the living room and dining area. Easy care yard with palms and plumerias that give a tropical feel. There is a nice sitting area and two storage sheds in the back. Buyer to verify measurements.
-
2008-06-28$40,876 482-char remark
Show marketing remark (482 chars)
MAKE OFFER NOW!! OWNER WANTS IT SOLD! Spotless and ready for new owner. Great home in 55+ park. This 2BR/1BA home features newer dual pane windows & sliding door, berber carpeting, tile, bathroom cabinets, and siding. Includes earthquake strapping underneath, new vertical blinds in the living room and dining area. Easy care yard with palms and plumerias that give a tropical feel. There is a nice sitting area and two storage sheds in the back. Buyer to verify measurements.
ⓘ Source: listings_history table (triggers on properties + properties_extension) + one-shot
backfill from property_details.listing_events for pre-trigger history.
Climate risk First Street
- Flood 1/10 Low FEMA zone X (unshaded) · 0% chance over 30 yrs
- Wildfire 1/10 Low
- Heat 4/10 Moderate 6 d/yr ≥86°F today · 17 d/yr by 30 yrs out
- Wind 1/10 Low
- Air quality 1/10 Low 0 unhealthy d/yr today · 0 by 30 yrs out
Nearby sold comps map
Loading sold comps map…
Walkable amenities ~0.75 mi
Loading nearby amenities…
Taxation est. · year 1
- Rental income
- $29,032
- − Mortgage interest
- −$8,906
- − Property taxes
- −$2,385
- − Insurance
- −$795
- − Repairs & maintenance
- −$2,323
- − Management
- −$2,323
- − Depreciation
- −$4,625
- Taxable income
- $7,675
- Est. tax owed @ 24.0%
- −$1,842
- After-tax cash flow
- $7,908/yr
For passive investors: Depreciation is non-cash, so a rental often shows a tax loss while cash-flowing — sheltering income. Rental losses are passive: they offset passive income freely, and up to $25,000/yr can offset ordinary (W-2) income if you actively participate and your MAGI is under $100k (phasing out to $0 by $150k); unused losses carry forward. On sale, claimed depreciation is recaptured at up to 25%, and gains may owe capital-gains tax (a 1031 exchange can defer both). Figures are a year-1 estimate at your 24.0% rate — not tax advice; consult a CPA.
Schools (NCES district)
- District
- Sweetwater Union High
- NCES district ID
- 0638640
- Math proficiency
- 36% ▲ 3.00%
- Reading proficiency
- 52% ▼ -2.00%
- Median HH income
- $59,051
- Composite
- 38.61/100
- National rank
- #4158
- State rank
- #187 of 517 in CA
Livability — Chula Vista
- Score
- 75/100
- State rank
- #127
- US rank
- #4345
Category grades
Schools grade is shown separately in the Schools card above.
Census & demographics
- Census place
- Chula Vista, CA
- County
- San Diego County · 3,178,799 people
- City population
- 255,708
- Metro
- San Diego-Chula Vista-Carlsbad, CA
- Population (ZIP)
- 85,542
- Household income
- $82,350
- Rent vs Own
- Severe rent burden
- 3751.0
Population outlook (San Diego County) Hauer SSP2
- Today (2025)
- 3,678,185 people
- By 2030
- 3,856,546 · +4.8%
- By 2040
- 4,171,407 · +13.4%
- By 2050
- 4,421,607 · +20.2%
- By 2075
- 4,831,599 · +31.4%
- By 2100
- 4,832,502 · +31.4%
Race, ethnicity, and origin ACS 2023
- Neighborhood character
- Predominantly Hispanic (75%)
- Race & ethnicity
- Hispanic / Latino 75% Two or more races 34% White 12% Asian 7% Black 4% Native American 1%
- Hispanic origin (detail)
- Mexican 71%
- Common ancestry
- Italian 1% Lithuanian 1%
- Foreign-born
- 32% · Canada, South Korea, Dominican Republic
- Languages at home
- 35% English-only · Spanish 59% Tagalog/Filipino 3% Other Asian/Pacific 1%
Political lean MEDSL · San Diego
- 2024 margin
- D (+16.8) · D 56.9% · R 40.1% · Other 2.9%
- 2008→2024 swing
- +6.6pp toward D · 2008: 10.2pp · 2024: 16.8pp
- All cycles
- 2024: D+16.8 2020: D+22.8 2016: D+17.8 2012: D+5.1 2008: D+10.2
Not yet ingested
- Civics
- —
Market trends
- HPI YoY
- ▼ -669.25%
- Current HPI
- 413.8287
- Rent YoY
- ▼ -2.56%
- Metro
- San Diego-Chula Vista-Carlsbad, CA
- State GDP YoY
- ▲ 3.21%
- F500 in state
- 116
Industry mix (Fortune 500 HQ in CA)
| Industry | F500 HQs | Revenue |
|---|---|---|
| Technology | 27 | $1,492B |
|
||
| Financial Services | 3 | $174B |
|
||
| Retail | 3 | $44B |
|
||
| Insurance | 3 | $26B |
|
||
| Media / Entertainment | 2 | $115B |
|
||
| Pharmaceuticals / Biotech | 2 | $62B |
|
||
Price history
+289.0% since first listed6 events — show timeline
- 2026-05-06 Listing Removed — CRMLS
- 2026-05-06 Listed $159,000 CRMLS
- 2026-04-10 Price Changed $159,000 CRMLS
- 2025-12-16 Listed $179,000 CRMLS
- 2009-05-13 Sold (MLS) $25,000 CRMLS
- 2008-06-28 Listed $40,876 CRMLS
Cash-flow waterfall
monthlySold comps — $/sqft
last 12 mo · ≤1 miLoading sold comps…