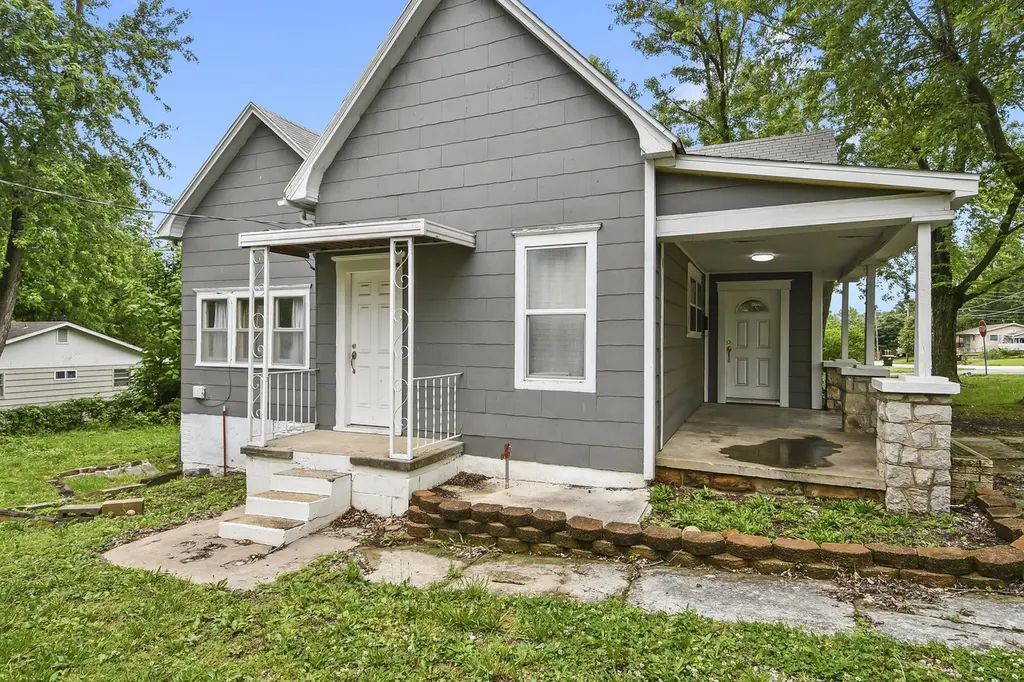
500 S Jackson St · El Dorado Springs, MO
Flood risk 1/10 · Minimal
- FEMA flood zone
- X (unshaded)
- Chance of flooding over 30 yrs
- 0.0%
- Est. flood insurance / yr
- $507 – $1,088
Fire risk 3/10 · Minor
- Est. fire insurance / yr
- $1,054 – $1,958
Heat risk 5/10 · Moderate
- Hot days now (above 108°F)
- 7 days/yr
- Hot days in 30 yrs
- 18 days/yr
Wind risk 2/10 · Minimal
- Chance of severe wind over 30 yrs
- 2.0%
Air-quality risk 2/10 · Minimal
- Unhealthy air days now
- 0 days/yr
- Unhealthy air days in 30 yrs
- 1 days/yr
Risk factors via First Street. Map © Google.
Why this score? — see what drove the A- grade
The composite is a weighted blend of 9 inputs, each scored 0–100. Each bar is that input's sub-score; the figure is the points it added to the 100-point composite (weight × sub-score).
- Cash flow +29.3/30.0
- ARV discount +15.0/15.0
- DSCR +10.0/10.0
- Appreciation +10.0/10.0
- 1% rule +8.2/10.0
- Livability +3.1/5.0
- Rent growth +2.5/5.0
- Schools +2.4/10.0
- Condition / age +2.2/5.0
$110,000
🖨 Deal sheet 📄 Offer letter ✓ Due diligence
Listing remarks MLS
Lots of updates on this late 1800's Victorian bungalow. Outside highliglhts include 2 covered front porches and 1 covered side porch as well as a 1 car storage area in the sandstone concrete reinforced cellar. The updated kitchen boasts a backlit bar/island with newer kitchen cabinets and upgrades. There is a cozy fireplace that makes a statement in the nice sized family room. Priced for a quick sale with immediate possession. .. only $42,500
Key facts
- Covered front porch
- Modern comfort
- Spacious kitchen
Tags
Property features AI
Exterior
- Parking: Driveway
- Utilities: Public water; Public sewer
- Home design: Single-family residence; One level
- Construction: Residential construction
- Exterior features: Covered patio/porch; Side porch; Front porch; Corner lot; Publicly maintained road frontage on a city street
Interior
- Flooring: Carpet; Laminate
- Bathrooms: 1 full bathroom; 1 half bathroom
- Heating & cooling: Central heating; Natural gas heating; Fireplace heating; Central air conditioning
- Interior features: Carpet and laminate flooring; Fireplace in the living room; Basement with walk-out access
- Laundry & utility: Laundry on the main level
Neighborhood map
What this means for you Summary
Snapshot
- This is a 2-bed/1.5-bath single-family listed at $110k. Condition is rated fair.
Deal economics
- At list price, monthly cash flow is $385 ($5k/yr) — positive.
- The deal already cash-flows at list — no discount required.
- Meets the 1% rule at list price ($1k rent vs $110k).
- Recommended offer: $108k (1.5% below list) — sets the bar for market timing.
- Cap rate 10.5% vs local median 4.9% in El Dorado Springs — top-decile yield for the area; either an underpriced asset or a hidden risk that comps aren't pricing in. Stress-test before assuming the spread holds.
Location & tenants
- Location reads 62/100 on livability (#370 in MO) — a middle-class / working-renter tenant base. Strengths: cost of living A+, housing A+, health & safety A+; Watch: amenities F, commute F, employment F.
- El Dorado Springs R-II (town): math 25% / reading 34% proficiency, ranked #279 of 324 in MO (top 86%) — low school quality limits family demand, transient renter base, plan for 1-2y turnover.
- Zoned schools: El Dorado Springs Elem. (math 26% / reading 34%, grade F, #808 of 1,115 statewide, top 73%, 580 students, 100% FRL); El Dorado Springs Middle (math 28% / reading 31%, grade F, #291 of 391 statewide, top 76%, 244 students, 51% FRL); El Dorado Springs High (math 12% / reading 47%, grade F, #382 of 521 statewide, top 78%, 348 students, 40% FRL).
- Market conditions: 81 active listings in the ZIP; 1 comparable units currently listed for rent nearby; 4 units permitted in Cedar County in 2024 (0 in 5+ unit buildings).
Forward outlook
- In year one you build about $12k of equity ($761 loan paydown + $11k appreciation (10.0% local appreciation)).
- Cedar County population projected at -12% by 2050 — secular population decline; favor cash flow + early exit over multi-decade hold.
- At projected returns (10.0% appreciation + 3.0% rent growth), your $31k cash investment doubles in ~2 years — after that, you're playing with house money.
- By year 4, paydown + projected appreciation supports a ~$42k cash-out refi (75% LTV) — recoverable capital for the next deal without selling this one.
Negotiation context
- It's been on market 28 days — a 2% lower offer ($108k) is reasonable based on typical stale-listing flexibility.
- 3 sale attempts since 9y ago with the ask held roughly flat each time — persistent listings suggest the price (not the market) is what's stuck; bring a comps-based counter.
Risks & watch-outs
- Watch-outs: built in 1880 — expect roof / HVAC / electrical / plumbing capex.
- Climate carrying-cost: extreme-heat days projected 7→18/yr by 2055 (HVAC capex compounding) — expect insurance premiums to compound above CPI over the hold.
Questions for the listing agent
- Have any recent inspections been done? Can we get a copy of the seller's disclosures and any deferred-maintenance estimates?
- Built in 1880 — when were the roof, HVAC, electrical panel, plumbing, and water heater last replaced?
- Is there a deadline driving the sale (1031 exchange, divorce, estate, relocation)? That informs how much negotiation room exists.
- Schools are D-rated, which usually means shorter tenancies and higher turnover. Who's the typical renter profile here, and what's been the actual vacancy rate?
- What's the average days-on-market for RENTAL listings here right now (not sales)? A rising rental-DOM trend means longer vacancies and softer asking-rent achievability than the comps imply.
- What's the recent tenant-quality profile in this submarket — average credit score on applications, eviction rate, late-payment / NSF rate, and stable-employment percentage? A property-management company in the area should have these aggregated.
- How much new for-sale + rental construction is in the pipeline within 1–3 miles? Heavy new supply typically softens prices + rents 12–24 months out; constrained supply supports both.
Investment metrics
- 1% rule
- 1.32% ✓
- Cap rate
- 10.50%
- Cash-on-cash
- 15.01%
- DSCR
- 1.67
- GRM
- 6.3
CMA / ARV
- ARV (on-the-fly)
- $142,394
- Comps found
- 11
Show comp detail 11 sales within ~0.75 mi
| Address | Dist | Beds/Ba | Sqft | Sold | Price | $/sf | Match |
|---|---|---|---|---|---|---|---|
| 217 W Joe Davis St | 0.09mi | 3/2.0 (+1) | 1,388 (-4%) | 23mo | $157,500 | $113 | 62 |
| 227 W Poplar St | 0.29mi | 3/2.0 (+1) | 1,430 (-2%) | 20mo | $199,000 | $139 | 60 |
| 322 W Poplar St | 0.40mi | 2/2.0 | 1,429 (-2%) | 20mo | $159,000 | $111 | 60 |
| 215 W Joe Davis St | 0.08mi | 3/1.5 (+1) | 1,320 (-9%) | 23mo | $129,900 | $98 | 57 |
| 300 N Main St | 0.42mi | 2/2.0 | 1,393 (-4%) | 19mo | $130,000 | $93 | 56 |
| 112 W Olive St | 0.51mi | 3/1.0 (+1) | 1,316 (-9%) | 3mo | $130,000 | $99 | 51 |
| 304 W Fields Blvd | 0.29mi | 3/1.0 (+1) | 1,312 (-10%) | 18mo | $123,500 | $94 | 48 |
| 300 W Pine St | 0.40mi | 3/2.0 (+1) | 1,250 (-14%) | 4mo | $75,000 | $60 | 48 |
| 1001 S Main St | 0.39mi | 3/1.0 (+1) | 1,551 (+7%) | 19mo | $103,500 | $67 | 48 |
| 204 E Olive St | 0.55mi | 2/1.0 | 1,562 (+8%) | 22mo | $25,000 | $16 | 42 |
| 215 W Pine St | 0.34mi | 3/2.0 (+1) | 1,240 (-15%) | 21mo | $189,500 | $153 | 35 |
Match score weights: distance 35% · size 25% · config 20% · recency 20%. Top-matched comps best support the ARV.
Projected returns pro-forma
10.0% appreciation · 3.0% rent growth · sell at horizon
- IRR
- 35.4%
- Equity multiple
- 3.74×
- Total profit
- $84,472
- Equity at exit
- $99,097
- IRR
- 30.5%
- Equity multiple
- 8.45×
- Total profit
- $229,500
- Equity at exit
- $213,706
Cash invested: $30,800 (down + closing). Projections, not guarantees.
Landlord ↔ Tenant lean methodology
- Overall (STATE)
- 81 Strongly Landlord-Friendly
- State Missouri
- 81 Strongly Landlord-Friendly · R+10
- County
- — inherits STATE
- City
- — inherits STATE
ZIP-level market 64744
- Home prices YoY
- 5.2%
- Active inventory
- 81
- Price-to-rent
- 6.3×
Monthly cashflow live
- Estimated rent
- $1,450 medium interval (Pro) →
- Mortgage (P&I)
- −$577
- Tax est. 1.5%
- −$138 /mo · $1,650/yr
- Insurance
- −$46
- HOA
- −$0
- Vacancy / Maint / Mgmt
- −$304
- Net cashflow
- $385
Break-even live
UW: 25.0% down · 7.5% · 30yr · 1.5% tax · 5.0% vac · 8.0% maint · 8.0% mgmt
Financing live
Cash to close
- Down payment
- $27,500
- Closing costs
- $3,300
- Reserves months
- —
- Total cash needed
- —
Loan-product check · same deal, 3 products live
Conventional
25% down · 7.5% · 30yr
- Down + closing
- —
- Monthly P&I
- —
- Monthly cashflow
- —
- DSCR
- —
- Eligible?
- —
Personal DTI + credit; lowest rate.
DSCR
20% down · 8.5% · 30yr
- Down + closing
- —
- Monthly P&I
- —
- Monthly cashflow
- —
- DSCR
- —
- Eligible?
- —
No personal income docs; deal must DSCR.
Hard money
10% down · 12.0% · 12mo
- Down + closing
- —
- Monthly P&I
- —
- Monthly cashflow
- —
- DSCR
- —
- Eligible?
- —
Short-term bridge; refi at stabilization.
Rent comps 1 comps
| Address | Beds | Baths | Sqft | Rent | $/sqft | DOM | Units | Dist |
|---|---|---|---|---|---|---|---|---|
| 410 S Ohio St El Dorado Springs, MO | 3.0 | 2.0 | 1020 | $1,450 | $1.42 | 43d | 1 | 0.46mi |
Listing history 19 events
-
2026-06-18days on market $110,000 Active 28 DOM
-
2026-06-17days on market $110,000 Active 27 DOM
-
2026-06-16days on market $110,000 Active 26 DOM
-
2026-06-15days on market $110,000 Active 25 DOM
-
2026-06-13days on market $110,000 Active 23 DOM
-
2026-06-12days on market $110,000 Active 22 DOM
-
2026-06-09days on market $110,000 Active 19 DOM
-
2026-06-08days on market $110,000 Active 18 DOM
-
2026-06-07days on market $110,000 Active 17 DOM
-
2026-06-07days on market $110,000 Active 16 DOM
-
2026-06-04days on market $110,000 Active 13 DOM
-
2026-06-02days on market $110,000 Active 12 DOM
-
2026-06-01days on market $110,000 Active 11 DOM
-
2026-05-31days on market $110,000 Active 10 DOM
-
2026-05-21$110,000 Active
-
2026-03-15historical
-
2025-08-26$130,000 Active
-
2018-02-27soldstatus 446-char remark
Show marketing remark (446 chars)
Lots of updates on this late 1800's Victorian bungalow. Outside highliglhts include 2 covered front porches and 1 covered side porch as well as a 1 car storage area in the sandstone concrete reinforced cellar. The updated kitchen boasts a backlit bar/island with newer kitchen cabinets and upgrades. There is a cozy fireplace that makes a statement in the nice sized family room. Priced for a quick sale with immediate possession. .. only $42,500
-
2017-12-12$39,900 446-char remark
Show marketing remark (446 chars)
Lots of updates on this late 1800's Victorian bungalow. Outside highliglhts include 2 covered front porches and 1 covered side porch as well as a 1 car storage area in the sandstone concrete reinforced cellar. The updated kitchen boasts a backlit bar/island with newer kitchen cabinets and upgrades. There is a cozy fireplace that makes a statement in the nice sized family room. Priced for a quick sale with immediate possession. .. only $42,500
ⓘ Source: listings_history table (triggers on properties + properties_extension) + one-shot
backfill from property_details.listing_events for pre-trigger history.
Climate risk First Street
- Flood 1/10 Low FEMA zone X (unshaded) · 0% chance over 30 yrs
- Wildfire 3/10 Moderate
- Heat 5/10 Major 7 d/yr ≥108°F today · 18 d/yr by 30 yrs out
- Wind 2/10 Low 2% chance of damaging wind over 30 yrs
- Air quality 2/10 Low 0 unhealthy d/yr today · 1 by 30 yrs out
Nearby sold comps map
Loading sold comps map…
Walkable amenities ~0.75 mi
Loading nearby amenities…
Taxation est. · year 1
- Rental income
- $17,400
- − Mortgage interest
- −$6,162
- − Property taxes
- −$1,650
- − Insurance
- −$550
- − Repairs & maintenance
- −$1,392
- − Management
- −$1,392
- − Depreciation
- −$3,200
- Taxable income
- $3,054
- Est. tax owed @ 24.0%
- −$733
- After-tax cash flow
- $3,891/yr
For passive investors: Depreciation is non-cash, so a rental often shows a tax loss while cash-flowing — sheltering income. Rental losses are passive: they offset passive income freely, and up to $25,000/yr can offset ordinary (W-2) income if you actively participate and your MAGI is under $100k (phasing out to $0 by $150k); unused losses carry forward. On sale, claimed depreciation is recaptured at up to 25%, and gains may owe capital-gains tax (a 1031 exchange can defer both). Figures are a year-1 estimate at your 24.0% rate — not tax advice; consult a CPA.
Condition & rehab AI · 12 photos
This 1880 Victorian bungalow requires moderate renovations to improve its condition and increase its value.
Repairs flagged
- Moderate kitchen cabinets — outdated and worn
- Moderate kitchen appliances — outdated and worn
- Moderate paint — worn and uneven
- Moderate landscaping — overgrown and unkempt
Value-add opportunities
- Resale new kitchen appliances — modernizes the space and attracts buyers
- Resale paint job — enhances curb appeal and interior aesthetics
- Both landscaping — improves curb appeal and adds value
- Both new flooring — modernizes the space and adds value
Renovation cost estimate screening
| Repair item | Severity | Est. cost |
|---|---|---|
| kitchen cabinets · outdated and worn | Moderate | $3,000–15,000 |
| kitchen appliances · outdated and worn | Moderate | $3,000–15,000 |
| paint · worn and uneven | Moderate | $3,000–15,000 |
| landscaping · overgrown and unkempt | Moderate | $3,000–15,000 |
| Total estimated repair cost · 4 items | $12,000–60,000 |
Value-add ROI direction
- Resale new kitchen appliances — modernizes the space and attracts buyers ↑
- Resale paint job — enhances curb appeal and interior aesthetics ↑
- Both landscaping — improves curb appeal and adds value ↑
- Both new flooring — modernizes the space and adds value ↑
ⓘ Cost ranges are severity-bucket heuristics (US national rule-of-thumb). Get contractor quotes + a written scope before underwriting a rehab budget.
Schools (NCES district)
- District
- El Dorado Springs R-II
- NCES district ID
- 2911310
- Math proficiency
- 25% ▼ -5.00%
- Reading proficiency
- 34% ▼ -5.00%
- Median HH income
- $31,880
- Composite
- 24.02/100
- National rank
- #7772
- State rank
- #279 of 324 in MO
Livability — El Dorado Springs
- Score
- 62/100
- State rank
- #370
- US rank
- #16324
Category grades
Schools grade is shown separately in the Schools card above.
Census & demographics
- Census place
- El Dorado Springs, MO
- Population (ZIP)
- 8,547
Population outlook (Cedar County) Hauer SSP2
- Today (2025)
- 13,424 people
- By 2030
- 13,080 · -2.6%
- By 2040
- 12,434 · -7.4%
- By 2050
- 11,841 · -11.8%
- By 2075
- 10,171 · -24.2%
- By 2100
- 7,744 · -42.3%
Race, ethnicity, and origin ACS 2023
- Neighborhood character
- Predominantly White (95%)
- Race & ethnicity
- White 95% Two or more races 4%
- Common ancestry
- Italian 6% Iranian 3% Romanian 3%
- Foreign-born
- 1% · Canada
- Languages at home
- 94% English-only · German/W. Germanic 5% Spanish 1%
Political lean MEDSL · Cedar
- 2024 margin
- Solid R (+69.6) · D 14.8% · R 84.4%
- 2008→2024 swing
- -36.0pp toward R · 2008: -33.6pp · 2024: -69.6pp
- All cycles
- 2024: R+69.6 2020: R+65.9 2016: R+63.9 2012: R+47.0 2008: R+33.6
Not yet ingested
- Civics
- —
Market trends
- HPI YoY
- ▲ 11.88%
- Current HPI
- 242.0421
- Rent YoY
- —
- Metro
- —
- State GDP YoY
- ▲ 1.84%
- F500 in state
- 20
Industry mix (Fortune 500 HQ in MO)
| Industry | F500 HQs | Revenue |
|---|---|---|
| Healthcare | 1 | $163B |
|
||
| Insurance | 1 | $21B |
|
||
| Industrial Technology | 1 | $17B |
|
||
| Retail | 1 | $16B |
|
||
| Industrial Distribution | 1 | $10B |
|
||
| Utilities | 1 | $9B |
|
||
Price history
+175.7% since first listed5 events — show timeline
- 2026-05-21 Listed $110,000 SOMO
- 2026-03-15 Listing Removed — Heartland MLS as Distributed by MLS Grid
- 2025-08-26 Listed $130,000 Heartland MLS as Distributed by MLS Grid
- 2018-02-27 Sold (MLS) — SOMO
- 2017-12-12 Listed $39,900 SOMO
Cash-flow waterfall
monthlySold comps — $/sqft
last 12 mo · ≤1 miLoading sold comps…