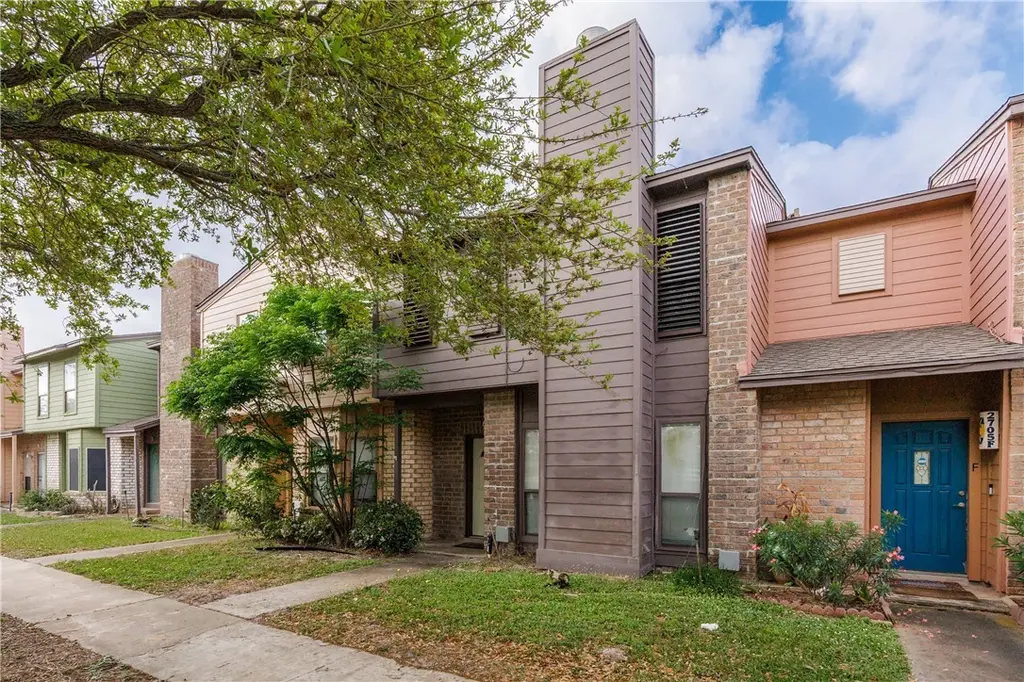
2705 Saint Joseph Unit E · Corpus Christi, TX
Flood risk 6/10 · Moderate
- FEMA flood zone
- X (unshaded)
- Chance of flooding over 30 yrs
- 0.65%
- Est. flood insurance / yr
- $507 – $1,088
Fire risk 2/10 · Minimal
- Est. fire insurance / yr
- $1,222 – $2,270
Heat risk 10/10 · Severe
- Hot days now (above 108°F)
- 7 days/yr
- Hot days in 30 yrs
- 28 days/yr
Wind risk 9/10 · Severe
- Chance of severe wind over 30 yrs
- 99.0%
Air-quality risk 1/10 · Minimal
- Unhealthy air days now
- 0 days/yr
- Unhealthy air days in 30 yrs
- 0 days/yr
Risk factors via First Street. Map © Google.
Why this score? — see what drove the D grade
The composite is a weighted blend of 9 inputs, each scored 0–100. Each bar is that input's sub-score; the figure is the points it added to the 100-point composite (weight × sub-score).
- Cash flow +14.2/30.0
- 1% rule +7.1/10.0
- DSCR +4.3/10.0
- Schools +4.1/10.0
- Livability +3.9/5.0
- Condition / age +3.8/5.0
- ARV discount +2.7/15.0
- Rent growth +2.4/5.0
- Appreciation +0.0/10.0
$162,900
🖨 Deal sheet (PDF) 📄 Offer letter ✓ Due diligence
Listing remarks MLS
Saint Joseph Townhome offering a spacious layout placed perfectly in central Flour Bluff. 3 bedrooms, 2.5 baths, 2 car garage plus a fireplace. Kitchen boasts all new granite, newer stainless steel appliances that may include washer. dryer and fridge with acceptable offer. Three nice size bedrooms and two bathrooms located upstairs and living room and kitchen located on main floor. Close to parks, fishing, Flour Bluff ISD, shopping, dining, entertainment, beach, NAS-CC & TAMU-CC. WATER, WASTEWATER & TRASH covered in HOA monthly fee.
Key facts
- $400 HOA
- 2 garage spots
- Built 1982
Neighborhood map
What this means for you Summary
Snapshot
- This is a 3-bed/2.5-bath townhouse listed at $163k. Condition is rated good.
Deal economics
- At list price, monthly cash flow is $27 ($322/yr) — positive.
- The deal already cash-flows at list — no discount required.
- Meets the 1% rule at list price ($2k rent vs $163k).
- Recommended offer: $153k (6.0% below list) — sets the bar for market timing.
- Cap rate 6.5% vs local median 3.6% in Corpus Christi — top-decile yield for the area; either an underpriced asset or a hidden risk that comps aren't pricing in. Stress-test before assuming the spread holds.
Location & tenants
- Location reads 78/100 on livability (#66 in TX, #2,404 nationally) — a middle-class / working-renter tenant base. Strengths: commute A+, cost of living A+, housing A+; Watch: crime F.
- Flour Bluff ISD (urban): math 43% / reading 51% proficiency, ranked #209 of 826 in TX (top 25%) — families likely to look elsewhere, expect single-tenant / working-renter base with shorter leases.
- Zoned schools: Flour Bluff El (math 40% / reading 42%, grade F, #1,462 of 4,322 statewide, top 34%, 759 students, 53% FRL); Flour Bluff J H (math 45% / reading 53%, grade C-, #378 of 1,662 statewide, top 23%, 919 students, 46% FRL); Flour Bluff H S (math 33% / reading 62%, grade D, #583 of 1,632 statewide, top 36%, 1,958 students, 40% FRL) — zoned schools at 47% FRL track the district average.
- Market conditions: Rents soft (-0.6%/yr); 703 active listings in the ZIP; 10 comparable units currently listed for rent nearby; rentals lingering (median 46d on market — plan ~5-8 weeks vacancy on turnover, expect pricing pressure); 70% of comp listings sitting > 30 days — soft ceiling on asking rent; solid renter incomes; 1,397 units permitted in Nueces County in 2024 (47 in 5+ unit buildings).
Forward outlook
- Local home prices are declining (-3.0%/yr); year-one equity from $1k of loan paydown is wiped out by about $5k of value loss. Plan a longer hold.
- Nueces County population projected at +36% by 2050 — long-run rental-demand tailwind backs the buy-and-hold thesis.
Negotiation context
- It's been on market 69 days — a 6% lower offer ($153k) is reasonable based on typical stale-listing flexibility.
- 3 sale attempts since 31y ago with the ask held roughly flat each time — persistent listings suggest the price (not the market) is what's stuck; bring a comps-based counter.
Risks & watch-outs
- Watch-outs: HOA is 20% of rent.
- Climate carrying-cost: major flood risk; severe wind risk, 99% chance of damaging wind over 30y; extreme-heat days projected 7→28/yr by 2055 (HVAC capex compounding) — expect insurance premiums to compound above CPI over the hold.
Questions for the listing agent
- It's been on market 69 days. Have you received any prior offers? Is the seller open to a 6% concession, seller financing, or rate buy-down credit?
- What does the HOA fee cover, when was the last increase, and are there any pending special assessments or reserve-fund shortfalls?
- Why hasn't it sold? Are there any deal-killer items the seller is aware of (foundation, flood, title, zoning, code violations)?
- Is there a deadline driving the sale (1031 exchange, divorce, estate, relocation)? That informs how much negotiation room exists.
- Crime grade is F in this area — have there been break-ins, vandalism, or insurance claims at this property in the last 3 years? What carrier currently insures it and at what premium?
- The area grade is low — what's the realistic commute time and amenity access for the typical tenant pool here? Any planned neighborhood developments (good or bad) we should know about?
- What's the average days-on-market for RENTAL listings here right now (not sales)? A rising rental-DOM trend means longer vacancies and softer asking-rent achievability than the comps imply.
- What's the recent tenant-quality profile in this submarket — average credit score on applications, eviction rate, late-payment / NSF rate, and stable-employment percentage? A property-management company in the area should have these aggregated.
- How much new for-sale + rental construction is in the pipeline within 1–3 miles? Heavy new supply typically softens prices + rents 12–24 months out; constrained supply supports both.
Investment metrics
- 1% rule
- 1.21% ✓
- Cap rate
- 6.49%
- Cash-on-cash
- 0.71%
- DSCR
- 1.03
- GRM
- 6.9
CMA / ARV
- ARV (median comp)
- $147,148
- List price
- $162,900
- Delta
- 10.71%
- Verdict
- OVERPRICED
- Comps
- 15 within 1.0 mi
Show comp detail 8 sales within ~0.75 mi
| Address | Dist | Beds/Ba | Sqft | Sold | Price | $/sf | Match |
|---|---|---|---|---|---|---|---|
| 2705 Saint Joseph St Unit G | 0.01mi | 3/2.5 | 1,300 (-7%) | 7mo | $154,900 | $119 | 82 |
| 2809 Saint Joseph St Unit C | 0.09mi | 3/2.5 | 1,309 (-6%) | 9mo | $159,900 | $122 | 78 |
| 2916 Saint Joseph St Unit C | 0.19mi | 3/2.5 | 1,309 (-6%) | 7mo | $148,000 | $113 | 74 |
| 2916 Saint Joseph St Unit A | 0.19mi | 3/2.5 | 1,300 (-7%) | 14mo | $159,000 | $122 | 68 |
| 2916 Saint Joseph St Unit D | 0.19mi | 2/2.5 (-1) | 1,237 (-12%) | 1mo | $164,500 | $133 | 66 |
| 2808 Saint Joseph St Unit P | 0.10mi | 3/2.5 | 1,309 (-6%) | 24mo | $109,900 | $84 | 65 |
| 2902 Saint Joseph St Unit F | 0.17mi | 2/2.5 (-1) | 1,237 (-12%) | 10mo | $150,000 | $121 | 59 |
| 2936 Saint Joseph St Unit M | 0.24mi | 3/2.5 | 1,300 (-7%) | 24mo | $155,000 | $119 | 57 |
Match score weights: distance 35% · size 25% · config 20% · recency 20%. Top-matched comps best support the ARV.
Projected returns pro-forma
-3.0% appreciation · 0.0% rent growth · sell at horizon
- IRR
- -19.6%
- Equity multiple
- 0.34×
- Total profit
- $-30,172
- Equity at exit
- $24,289
- IRR
- -24.8%
- Equity multiple
- 0.01×
- Total profit
- $-45,211
- Equity at exit
- $14,085
Cash invested: $45,612 (down + closing). Projections, not guarantees.
Landlord ↔ Tenant lean methodology
- Overall (STATE)
- 87 Strongly Landlord-Friendly
- State Texas
- 87 Strongly Landlord-Friendly · R+5
- County
- — inherits STATE
- City
- — inherits STATE
ZIP-level market 78418
- Rents YoY
- -0.6%
- Active inventory
- 703
- Price-to-rent
- 6.9×
Monthly cashflow live
- Estimated rent
- $1,965 high interval (Pro) →
- Mortgage (P&I)
- −$854
- Tax est. 1.5%
- −$204 /mo · $2,444/yr
- Insurance
- −$68
- HOA
- −$400
- Vacancy / Maint / Mgmt
- −$413
- Net cashflow
- $27
Break-even live
Sensitivity live
| Price | -10% $139 | -5% $83 | +0% $27 | +5% $-29 | +10% $-86 |
|---|---|---|---|---|---|
| Rent | -10% $-128 | -5% $-51 | +0% $27 | +5% $104 | +10% $182 |
| Rate | -1.0pp $109 | -0.5pp $68 | base $27 | +0.5pp $-15 | +1.0pp $-58 |
UW: 25.0% down · 7.5% · 30yr · 1.5% tax · 5.0% vac · 8.0% maint · 8.0% mgmt
Financing live
Cash to close
- Down payment
- $40,725
- Closing costs
- $4,887
- Reserves months
- —
- Total cash needed
- —
Loan-product check · same deal, 3 products live
Conventional
25% down · 7.5% · 30yr
- Down + closing
- —
- Monthly P&I
- —
- Monthly cashflow
- —
- DSCR
- —
- Eligible?
- —
Personal DTI + credit; lowest rate.
DSCR
20% down · 8.5% · 30yr
- Down + closing
- —
- Monthly P&I
- —
- Monthly cashflow
- —
- DSCR
- —
- Eligible?
- —
No personal income docs; deal must DSCR.
Hard money
10% down · 12.0% · 12mo
- Down + closing
- —
- Monthly P&I
- —
- Monthly cashflow
- —
- DSCR
- —
- Eligible?
- —
Short-term bridge; refi at stabilization.
Rent comps 10 comps
| Address | Beds | Baths | Sqft | Rent | $/sqft | DOM | Units | Dist |
|---|---|---|---|---|---|---|---|---|
| 702 Truk Dr Corpus Christi, TX | 3.0 | 2.0 | 1508 | $1,650 | $1.09 | 46d | 1 | 0.34mi |
| 2310 Vialoux Dr Corpus Christi, TX | 3.0 | 2.0 | 1240 | $1,950 | $1.57 | 45d | 1 | 0.62mi |
| 2317 Vialoux Dr Corpus Christi, TX | 2.0 | 2.0 | 1067 | $1,500 | $1.41 | 23d | 1 | 0.63mi |
| 530 Oakdale Dr Corpus Christi, TX | 2.0 | 1.0 | 1113 | $1,350 | $1.21 | 45d | 1 | 0.65mi |
| 2255 Lombardy Dr Corpus Christi, TX | 3.0 | 2.0 | 1574 | $1,750 | $1.11 | 45d | 1 | 0.69mi |
| 2301 Sky Crest Dr Corpus Christi, TX | 3.0 | 2.0 | 1597 | $2,200 | $1.38 | 15d | 1 | 0.87mi |
| 1942 Sunnycrest St Corpus Christi, TX | 3.0 | 2.0 | 1047 | $1,650 | $1.58 | 45d | 1 | 0.93mi |
| 538 Vega Dr Corpus Christi, TX | 4.0 | 2.0 | 1539 | $1,925 | $1.25 | 45d | 1 | 1.01mi |
| 2445 Laguna Shores Rd Corpus Christi, TX | 4.0 | 4.5 | 1609 | $5,500 | $3.42 | 15d | 1 | 1.30mi |
| 3021 Laguna Shores Rd Corpus Christi, TX | 2.0 | 2.0 | 1440 | $2,500 | $1.74 | 45d | 1 | 1.42mi |
HOA detail
- Monthly dues
- $400 · $4,800/yr
- Likely covers
- watertrash
Listing history 23 events
-
2026-06-22pricedays on market $162,900 Active 69 DOM
-
2026-06-18days on market $164,900 Active 66 DOM
-
2026-06-17days on market $164,900 Active 65 DOM
-
2026-06-16days on market $164,900 Active 64 DOM
-
2026-06-15days on market $164,900 Active 63 DOM
-
2026-06-14days on market $164,900 Active 61 DOM
-
2026-06-13days on market $164,900 Active 60 DOM
-
2026-06-10days on market $164,900 Active 58 DOM
-
2026-06-09days on market $164,900 Active 57 DOM
-
2026-06-08days on market $164,900 Active 56 DOM
-
2026-06-07days on market $164,900 Active 55 DOM
-
2026-06-03days on market $164,900 Active 51 DOM
-
2026-06-02days on market $164,900 Active 50 DOM
-
2026-06-01days on market $164,900 Active 49 DOM
-
2026-05-31days on market $164,900 Active 48 DOM
-
2026-05-30days on market $164,900 Active 47 DOM
-
2026-05-17status Pending 550-char remark
Show marketing remark (550 chars)
Saint Joseph Townhome offering a spacious layout placed perfectly in central Flour Bluff. 3 bedrooms, 2.5 baths, 2 car garage plus a fireplace. Kitchen boasts all new granite, newer stainless steel appliances that may include washer. dryer and fridge with acceptable offer. Three nice size bedrooms and two bathrooms located upstairs and living room and kitchen located on main floor. Close to parks, fishing, Flour Bluff ISD, shopping, dining, entertainment, beach, NAS-CC & TAMU-CC. WATER, WASTEWATER & TRASH covered in HOA monthly fee.
-
2026-05-09historical 550-char remark
Show marketing remark (550 chars)
Saint Joseph Townhome offering a spacious layout placed perfectly in central Flour Bluff. 3 bedrooms, 2.5 baths, 2 car garage plus a fireplace. Kitchen boasts all new granite, newer stainless steel appliances that may include washer. dryer and fridge with acceptable offer. Three nice size bedrooms and two bathrooms located upstairs and living room and kitchen located on main floor. Close to parks, fishing, Flour Bluff ISD, shopping, dining, entertainment, beach, NAS-CC & TAMU-CC. WATER, WASTEWATER & TRASH covered in HOA monthly fee.
-
2026-03-31$164,900 Active 550-char remark
Show marketing remark (550 chars)
Saint Joseph Townhome offering a spacious layout placed perfectly in central Flour Bluff. 3 bedrooms, 2.5 baths, 2 car garage plus a fireplace. Kitchen boasts all new granite, newer stainless steel appliances that may include washer. dryer and fridge with acceptable offer. Three nice size bedrooms and two bathrooms located upstairs and living room and kitchen located on main floor. Close to parks, fishing, Flour Bluff ISD, shopping, dining, entertainment, beach, NAS-CC & TAMU-CC. WATER, WASTEWATER & TRASH covered in HOA monthly fee.
-
2006-10-25soldstatus 157-char remark
Show marketing remark (157 chars)
Very well maintained townhome. Fenced patio. Inside laundry room. Lots of storage space. 2 Car Garage/Opener. Commons are well maintained. Move in and enjoy.
-
2006-09-07$82,500 157-char remark
Show marketing remark (157 chars)
Very well maintained townhome. Fenced patio. Inside laundry room. Lots of storage space. 2 Car Garage/Opener. Commons are well maintained. Move in and enjoy.
-
2003-09-12soldstatus
-
1995-06-16$61,500
ⓘ Source: listings_history table (triggers on properties + properties_extension) + one-shot
backfill from property_details.listing_events for pre-trigger history.
Climate risk First Street
- Flood 6/10 Major FEMA zone X (unshaded) · 65% chance over 30 yrs
- Wildfire 2/10 Low
- Heat 10/10 Extreme 7 d/yr ≥108°F today · 28 d/yr by 30 yrs out
- Wind 9/10 Extreme 99% chance of damaging wind over 30 yrs
- Air quality 1/10 Low 0 unhealthy d/yr today · 0 by 30 yrs out
Nearby sold comps map
Loading sold comps map…
Walkable amenities ~0.75 mi
Loading nearby amenities…
Taxation est. · year 1
- Rental income
- $23,584
- − Mortgage interest
- −$9,125
- − Property taxes
- −$2,444
- − Insurance
- −$814
- − Repairs & maintenance
- −$1,887
- − Management
- −$1,887
- − HOA
- −$4,800
- − Depreciation
- −$4,739
- Taxable loss
- −$2,111
- Est. tax savings @ 24.0%
- +$507
- After-tax cash flow
- $829/yr
For passive investors: Depreciation is non-cash, so a rental often shows a tax loss while cash-flowing — sheltering income. Rental losses are passive: they offset passive income freely, and up to $25,000/yr can offset ordinary (W-2) income if you actively participate and your MAGI is under $100k (phasing out to $0 by $150k); unused losses carry forward. On sale, claimed depreciation is recaptured at up to 25%, and gains may owe capital-gains tax (a 1031 exchange can defer both). Figures are a year-1 estimate at your 24.0% rate — not tax advice; consult a CPA.
Condition & rehab AI · 12 photos
This well-maintained townhome in a desirable location offers a good investment opportunity with minimal repairs and updates needed.
Value-add opportunities
- Both Paint exterior — Enhances curb appeal and resale value
- Both Replace carpet in living areas — Improves comfort and resale value
- Rental Clean and maintain HVAC system — Ensures comfort and reduces maintenance costs
Renovation cost estimate screening
Value-add ROI direction
- Both Paint exterior — Enhances curb appeal and resale value ↑
- Both Replace carpet in living areas — Improves comfort and resale value ↑
- Rental Clean and maintain HVAC system — Ensures comfort and reduces maintenance costs ↑
ⓘ Cost ranges are severity-bucket heuristics (US national rule-of-thumb). Get contractor quotes + a written scope before underwriting a rehab budget.
Schools (NCES district)
- District
- Flour Bluff ISD
- NCES district ID
- 4819380
- Math proficiency
- 43% ▼ -12.00%
- Reading proficiency
- 51% ▼ -2.00%
- Median HH income
- $57,162
- Composite
- 40.96/100
- National rank
- #3604
- State rank
- #209 of 826 in TX
Livability — Corpus Christi
- Score
- 78/100
- State rank
- #66
- US rank
- #2404
Category grades
Schools grade is shown separately in the Schools card above.
Census & demographics
- Census place
- Corpus Christi, TX
- County
- Nueces County · 296,836 people
- City population
- 296,836
- Metro
- Corpus Christi, TX
- Population (ZIP)
- 29,790
- Household income
- $92,445
- Rent vs Own
- Severe rent burden
- 808.0
Population outlook (Nueces County) Hauer SSP2
- Today (2025)
- 418,037 people
- By 2030
- 447,123 · +7.0%
- By 2040
- 505,911 · +21.0%
- By 2050
- 567,522 · +35.8%
- By 2075
- 729,686 · +74.6%
- By 2100
- 847,087 · +102.6%
Race, ethnicity, and origin ACS 2023
- Neighborhood character
- Majority White (61%)
- Race & ethnicity
- White 61% Hispanic / Latino 29% Two or more races 19% Asian 3% Black 3%
- Hispanic origin (detail)
- Mexican 25%
- Common ancestry
- Romanian 2% Lithuanian 2% Slovak 2%
- Foreign-born
- 7% · Canada, China
- Languages at home
- 83% English-only · Spanish 14% Tagalog/Filipino 2%
Political lean MEDSL · Nueces
- 2024 margin
- R (+11.5) · D 43.8% · R 55.3%
- 2008→2024 swing
- -7.1pp toward R · 2008: -4.4pp · 2024: -11.5pp
- All cycles
- 2024: R+11.5 2020: R+2.9 2016: R+1.5 2012: R+3.2 2008: R+4.4
Not yet ingested
- Civics
- —
Market trends
- HPI YoY
- ▼ -168.81%
- Current HPI
- 193.902
- Rent YoY
- ▼ -0.57%
- Metro
- Corpus Christi, TX
- State GDP YoY
- ▲ 3.95%
- F500 in state
- 110
Industry mix (Fortune 500 HQ in TX)
| Industry | F500 HQs | Revenue |
|---|---|---|
| Energy | 16 | $1,198B |
|
||
| Technology | 5 | $198B |
|
||
| Engineering / Construction | 4 | $72B |
|
||
| Energy Services | 3 | $60B |
|
||
| Utilities | 3 | $41B |
|
||
| Healthcare | 2 | $330B |
|
||
Price history
+168.1% since first listed7 events — show timeline
- 2026-05-17 Pending — CBMLS
- 2026-05-09 Delisted — CBMLS
- 2026-03-31 Listed $164,900 CBMLS
- 2006-10-25 Sold (MLS) — CBMLS
- 2006-09-07 Listed $82,500 CBMLS
- 2003-09-12 Sold (MLS) — CBMLS
- 1995-06-16 Listed $61,500 CBMLS
Cash-flow waterfall
monthlySold comps — $/sqft
last 12 mo · ≤1 miLoading sold comps…