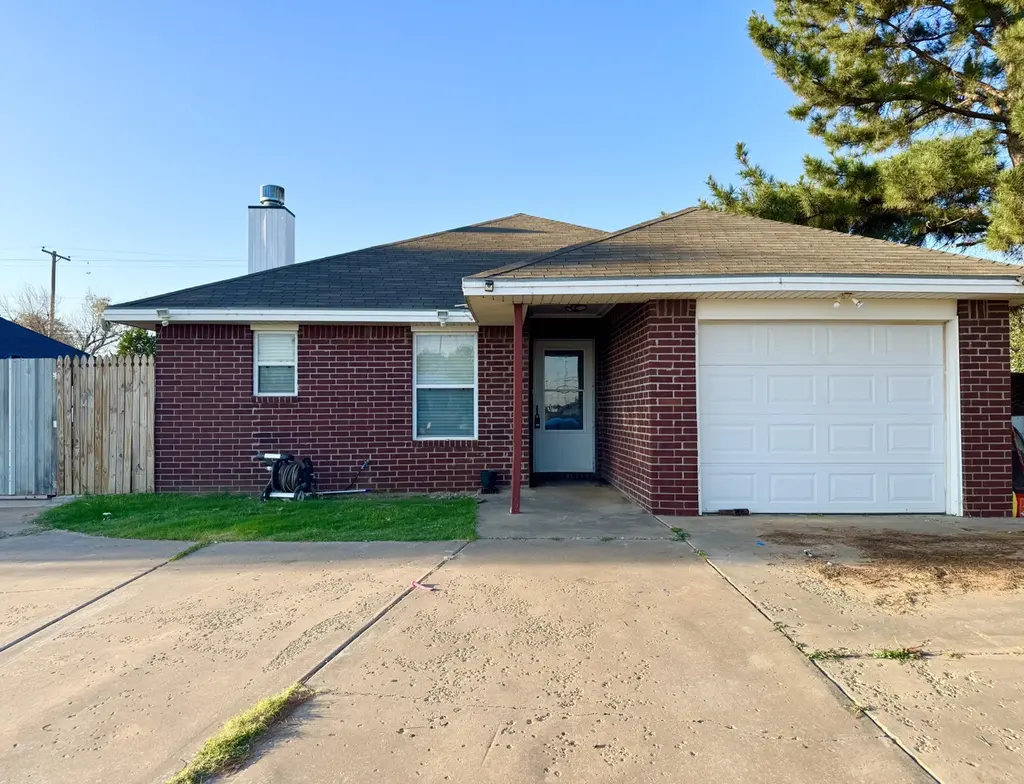
303 77th St · Lubbock, TX
Flood risk 4/10 · Minor
- FEMA flood zone
- X (unshaded)
- Chance of flooding over 30 yrs
- 0.21%
- Est. flood insurance / yr
- $507 – $1,088
Fire risk 3/10 · Minor
- Est. fire insurance / yr
- $1,222 – $2,270
Heat risk 5/10 · Moderate
- Hot days now (above 99°F)
- 7 days/yr
- Hot days in 30 yrs
- 21 days/yr
Wind risk 2/10 · Minimal
- Chance of severe wind over 30 yrs
- 0.0%
Air-quality risk 1/10 · Minimal
- Unhealthy air days now
- 0 days/yr
- Unhealthy air days in 30 yrs
- 0 days/yr
Risk factors via First Street. Map © Google.
Why this score? — see what drove the D- grade
The composite is a weighted blend of 9 inputs, each scored 0–100. Each bar is that input's sub-score; the figure is the points it added to the 100-point composite (weight × sub-score).
- Cash flow +11.3/30.0
- Appreciation +6.6/10.0
- 1% rule +4.3/10.0
- Livability +4.0/5.0
- DSCR +3.3/10.0
- Schools +3.1/10.0
- Rent growth +2.5/5.0
- Condition / age +2.5/5.0
- ARV discount +0.0/15.0
$179,900
🖨 Deal sheet 📄 Offer letter ✓ Due diligence
Listing remarks MLS
Move-In Ready 4 Bedroom, 2 bath home featuring a charming brick exterior and a 1-car garage. Step inside to find a thoughtfully updated interior with newer carpet and modern finishes throughout. The spacious layout offers comfortable living with a bright living area and generously sized bedrooms. Pride of ownership shows in every corner of this well-cared-for home.
Key facts
- 8,400 sq ft lot
- Garage
- Built 2005
Neighborhood map
What this means for you Summary
Snapshot
- This is a 4-bed/2.0-bath single-family listed at $180k.
Deal economics
- At list price, monthly cash flow is $-65 ($-781/yr) — negative.
- To cash-flow at today's rent, offer at most $168k (6.4% below list).
- To meet the 1% rule (rent ≥ 1% of price), the offer needs to be $168k (6.7% below list).
- Recommended offer: $168k (6.7% below list) — sets the bar for 1% rule.
Location & tenants
- Location reads 80/100 on livability (#37 in TX, #1,749 nationally) — a professional / high-income tenant draw. Strengths: commute A+, cost of living A+, housing A+; Watch: employment C-, schools D+, crime F.
- Lubbock ISD (urban): math 36% / reading 39% proficiency, ranked #481 of 826 in TX (top 58%) — families likely to look elsewhere, expect single-tenant / working-renter base with shorter leases; 60% free/reduced lunch — lower-income household profile, screen leases tightly.
- Market conditions: 91 active listings in the ZIP; 14 comparable units currently listed for rent nearby; rentals lingering (median 44d on market — plan ~5-8 weeks vacancy on turnover, expect pricing pressure); 50% of comp listings sitting > 30 days — soft ceiling on asking rent; 2,219 units permitted in Lubbock County in 2024 (252 in 5+ unit buildings).
- This rent runs 39% of the median local income ($52k/yr) — at the standard rent-burdened threshold; future hikes will face affordability resistance.
Forward outlook
- In year one you build about $7k of equity ($1k loan paydown + $6k appreciation (3.2% local appreciation)).
- Lubbock County population projected at +39% by 2050 — long-run rental-demand tailwind backs the buy-and-hold thesis.
- At projected returns (3.2% appreciation + 3.0% rent growth), your $50k cash investment doubles in ~7 years — after that, you're playing with house money.
- By year 5, paydown + projected appreciation supports a ~$30k cash-out refi (75% LTV) — recoverable capital for the next deal without selling this one.
Negotiation context
- It's been on market 72 days — a 6% lower offer ($169k) is reasonable based on typical stale-listing flexibility.
- 6 sale attempts since 9y ago with the ask held roughly flat each time — persistent listings suggest the price (not the market) is what's stuck; bring a comps-based counter.
Risks & watch-outs
- Climate carrying-cost: extreme-heat days projected 7→21/yr by 2055 (HVAC capex compounding) — expect insurance premiums to compound above CPI over the hold.
Questions for the listing agent
- What do current leases actually rent for vs. the listed asking? Can we see a recent rent roll and the last 12 months of T-12 income?
- It's been on market 72 days. Have you received any prior offers? Is the seller open to a 7% concession, seller financing, or rate buy-down credit?
- Why hasn't it sold? Are there any deal-killer items the seller is aware of (foundation, flood, title, zoning, code violations)?
- Is there a deadline driving the sale (1031 exchange, divorce, estate, relocation)? That informs how much negotiation room exists.
- Schools are D-rated, which usually means shorter tenancies and higher turnover. Who's the typical renter profile here, and what's been the actual vacancy rate?
- Crime grade is F in this area — have there been break-ins, vandalism, or insurance claims at this property in the last 3 years? What carrier currently insures it and at what premium?
- The area grade is low — what's the realistic commute time and amenity access for the typical tenant pool here? Any planned neighborhood developments (good or bad) we should know about?
- What's the average days-on-market for RENTAL listings here right now (not sales)? A rising rental-DOM trend means longer vacancies and softer asking-rent achievability than the comps imply.
- What's the recent tenant-quality profile in this submarket — average credit score on applications, eviction rate, late-payment / NSF rate, and stable-employment percentage? A property-management company in the area should have these aggregated.
- How much new for-sale + rental construction is in the pipeline within 1–3 miles? Heavy new supply typically softens prices + rents 12–24 months out; constrained supply supports both.
Investment metrics
- 1% rule
- 0.93% ✗
- Cap rate
- 5.86%
- Cash-on-cash
- -1.55%
- DSCR
- 0.93
- GRM
- 8.9
CMA / ARV
- ARV (median comp)
- $151,125
- List price
- $179,900
- Delta
- 19.04%
- Verdict
- OVERPRICED
- Comps
- 2 within 2.0 mi
Projected returns pro-forma
3.22% appreciation · 3.0% rent growth · sell at horizon
- IRR
- 6.8%
- Equity multiple
- 1.39×
- Total profit
- $19,780
- Equity at exit
- $83,163
- IRR
- 9.5%
- Equity multiple
- 2.46×
- Total profit
- $73,786
- Equity at exit
- $129,960
Cash invested: $50,372 (down + closing). Projections, not guarantees.
Landlord ↔ Tenant lean methodology
- Overall (STATE)
- 87 Strongly Landlord-Friendly
- State Texas
- 87 Strongly Landlord-Friendly · R+5
- County
- — inherits STATE
- City
- — inherits STATE
ZIP-level market 79404
- Home prices YoY
- 2.0%
- Active inventory
- 91
- Price-to-rent
- 8.9×
Monthly cashflow live
- Estimated rent
- $1,679 high interval (Pro) →
- Mortgage (P&I)
- −$943
- Tax from tax record
- −$373 /mo · $4,473/yr
- Insurance
- −$75
- HOA
- −$0
- Vacancy / Maint / Mgmt
- −$352
- Net cashflow
- $-65
Break-even live
UW: 25.0% down · 7.5% · 30yr · 1.5% tax · 5.0% vac · 8.0% maint · 8.0% mgmt
Financing live
Cash to close
- Down payment
- $44,975
- Closing costs
- $5,397
- Reserves months
- —
- Total cash needed
- —
Loan-product check · same deal, 3 products live
Conventional
25% down · 7.5% · 30yr
- Down + closing
- —
- Monthly P&I
- —
- Monthly cashflow
- —
- DSCR
- —
- Eligible?
- —
Personal DTI + credit; lowest rate.
DSCR
20% down · 8.5% · 30yr
- Down + closing
- —
- Monthly P&I
- —
- Monthly cashflow
- —
- DSCR
- —
- Eligible?
- —
No personal income docs; deal must DSCR.
Hard money
10% down · 12.0% · 12mo
- Down + closing
- —
- Monthly P&I
- —
- Monthly cashflow
- —
- DSCR
- —
- Eligible?
- —
Short-term bridge; refi at stabilization.
Rent comps 14 comps
| Address | Beds | Baths | Sqft | Rent | $/sqft | DOM | Units | Dist |
|---|---|---|---|---|---|---|---|---|
| 312 E 76th St Lubbock, TX | 3.0 | 2.0 | 1430 | $1,599 | $1.12 | 13d | 1 | 0.30mi |
| 7715 Date Ave Lubbock, TX | 3.0 | 2.0 | 1430 | $1,599 | $1.12 | 21d | 1 | 0.36mi |
| 7717 Date Ave Lubbock, TX | 3.0 | 2.0 | 1430 | $1,899 | $1.33 | 13d | 1 | 0.36mi |
| 7702 Elm Ave Lubbock, TX | 3.0 | 2.0 | 1470 | $1,600 | $1.09 | 13d | 1 | 0.36mi |
| 1113 80th St Unit A Lubbock, TX | 3.0 | 2.0 | 1443 | $1,250 | $0.87 | 43d | 1 | 0.64mi |
| 1115 80th St Unit A Lubbock, TX | 3.0 | 2.0 | 1443 | $1,250 | $0.87 | 43d | 1 | 0.65mi |
| 1625 79th Pl Lubbock, TX | 3.0 | 2.0 | 1541 | $1,650 | $1.07 | 44d | 1 | 1.02mi |
| 7006 Avenue S Lubbock, TX | 4.0 | 2.0 | 1498 | $1,800 | $1.20 | 43d | 1 | 1.10mi |
| 1816 75th St Lubbock, TX | 4.0 | 2.0 | 1516 | $2,000 | $1.32 | 21d | 1 | 1.12mi |
| 1927 71st St Lubbock, TX | 4.0 | 2.0 | 1807 | $1,600 | $0.89 | 21d | 1 | 1.22mi |
| 1915 76th St Lubbock, TX | 3.0 | 2.0 | 1911 | $1,550 | $0.81 | 13d | 1 | 1.22mi |
| 1923 76th St Lubbock, TX | 3.0 | 2.0 | 1622 | $1,699 | $1.05 | 43d | 1 | 1.27mi |
| 1940 77th St Lubbock, TX | 3.0 | 2.0 | 1700 | $1,500 | $0.88 | 43d | 1 | 1.36mi |
| 1923 67th St Lubbock, TX | 4.0 | 2.0 | 1467 | $1,525 | $1.04 | 43d | 1 | 1.38mi |
Listing history 32 events
-
2026-06-18days on market $179,900 Active 72 DOM
-
2026-06-17days on market $179,900 Active 71 DOM
-
2026-06-16days on market $179,900 Active 70 DOM
-
2026-06-15days on market $179,900 Active 69 DOM
-
2026-06-14days on market $179,900 Active 67 DOM
-
2026-06-13days on market $179,900 Active 66 DOM
-
2026-06-10days on market $179,900 Active 64 DOM
-
2026-06-09days on market $179,900 Active 63 DOM
-
2026-06-08days on market $179,900 Active 62 DOM
-
2026-06-07days on market $179,900 Active 61 DOM
-
2026-06-05days on market $179,900 Active 58 DOM
-
2026-06-03days on market $179,900 Active 57 DOM
-
2026-06-02days on market $179,900 Active 56 DOM
-
2026-06-01days on market $179,900 Active 55 DOM
-
2026-05-31days on market $179,900 Active 54 DOM
-
2026-05-30days on market $179,900 Active 53 DOM
-
2026-04-07$179,900 Active 367-char remark
Show marketing remark (367 chars)
Move-In Ready 4 Bedroom, 2 bath home featuring a charming brick exterior and a 1-car garage. Step inside to find a thoughtfully updated interior with newer carpet and modern finishes throughout. The spacious layout offers comfortable living with a bright living area and generously sized bedrooms. Pride of ownership shows in every corner of this well-cared-for home.
-
2025-09-27historical $1,610
-
2025-09-02price $1,610
-
2025-08-31$1,399
-
2024-10-17historical $1,399
-
2024-10-11price $1,399
-
2024-09-29price $1,449
-
2024-09-13$1,499
-
2024-09-07historical $1,499
-
2024-09-05historical $1,499
-
2024-09-05$1,499
-
2024-08-22$1,499
-
2017-11-03soldstatus
-
2017-11-02soldstatus 71-char remark
Show marketing remark (71 chars)
4/3/2 brick home. New paint, carpet, range, microwave, & lighting.
-
2017-09-10$109,000 71-char remark
Show marketing remark (71 chars)
4/3/2 brick home. New paint, carpet, range, microwave, & lighting.
-
2006-02-09soldstatus
ⓘ Source: listings_history table (triggers on properties + properties_extension) + one-shot
backfill from property_details.listing_events for pre-trigger history.
Tax reassessment forecast TX · Resets to sale price
- Current annual tax
- $4,473 · $373/mo
- Projected year-2 tax
- $4,473 · $373/mo
- Expected delta
- $0/yr ($0/mo · 0.0%)
ⓘ Screening estimate from a state-policy table — verify with the county assessor before closing.
Climate risk First Street
- Flood 4/10 Moderate FEMA zone X (unshaded) · 21% chance over 30 yrs
- Wildfire 3/10 Moderate
- Heat 5/10 Major 7 d/yr ≥99°F today · 21 d/yr by 30 yrs out
- Wind 2/10 Low 0% chance of damaging wind over 30 yrs
- Air quality 1/10 Low 0 unhealthy d/yr today · 0 by 30 yrs out
Nearby sold comps map
Loading sold comps map…
Walkable amenities ~0.75 mi
Loading nearby amenities…
Taxation est. · year 1
- Rental income
- $20,143
- − Mortgage interest
- −$10,077
- − Property taxes
- −$4,473
- − Insurance
- −$900
- − Repairs & maintenance
- −$1,611
- − Management
- −$1,611
- − Depreciation
- −$5,233
- Taxable loss
- −$3,763
- Est. tax savings @ 24.0%
- +$903
- After-tax cash flow
- $122/yr
For passive investors: Depreciation is non-cash, so a rental often shows a tax loss while cash-flowing — sheltering income. Rental losses are passive: they offset passive income freely, and up to $25,000/yr can offset ordinary (W-2) income if you actively participate and your MAGI is under $100k (phasing out to $0 by $150k); unused losses carry forward. On sale, claimed depreciation is recaptured at up to 25%, and gains may owe capital-gains tax (a 1031 exchange can defer both). Figures are a year-1 estimate at your 24.0% rate — not tax advice; consult a CPA.
Schools (NCES district)
- District
- Lubbock ISD
- NCES district ID
- 4828500
- Math proficiency
- 36% ▼ -8.00%
- Reading proficiency
- 39% ▼ -1.00%
- Median HH income
- $39,820
- Composite
- 31.44/100
- National rank
- #5984
- State rank
- #481 of 826 in TX
Livability — Lubbock
- Score
- 80/100
- State rank
- #37
- US rank
- #1749
Category grades
Schools grade is shown separately in the Schools card above.
Census & demographics
- Census place
- Lubbock, TX
- County
- Lubbock County · 293,542 people
- City population
- 283,030
- Metro
- Lubbock, TX
- Population (ZIP)
- 8,529
- Household income
- $51,630
- Rent vs Own
- Severe rent burden
- 366.0
Population outlook (Lubbock County) Hauer SSP2
- Today (2025)
- 345,960 people
- By 2030
- 371,449 · +7.4%
- By 2040
- 424,539 · +22.7%
- By 2050
- 481,150 · +39.1%
- By 2075
- 633,467 · +83.1%
- By 2100
- 746,853 · +115.9%
Race, ethnicity, and origin ACS 2023
- Neighborhood character
- Diverse neighborhood (Simpson 0.60)
- Race & ethnicity
- Hispanic / Latino 55% Black 22% White 20% Two or more races 17% Native American 2%
- Hispanic origin (detail)
- Mexican 46%
- Common ancestry
- Romanian 1% Lithuanian 0%
- Foreign-born
- 5% · Canada
- Languages at home
- 64% English-only · Spanish 36%
Political lean MEDSL · Lubbock
- 2024 margin
- Solid R (+39.5) · D 29.7% · R 69.2% · Other 1.0%
- 2008→2024 swing
- -2.8pp toward R · 2008: -36.7pp · 2024: -39.5pp
- All cycles
- 2024: R+39.5 2020: R+32.2 2016: R+38.4 2012: R+40.9 2008: R+36.7
Not yet ingested
- Civics
- —
Market trends
- HPI YoY
- ▲ 3.22%
- Current HPI
- 163.854
- Rent YoY
- —
- Metro
- Lubbock, TX
- State GDP YoY
- ▲ 3.95%
- F500 in state
- 110
Industry mix (Fortune 500 HQ in TX)
| Industry | F500 HQs | Revenue |
|---|---|---|
| Energy | 16 | $1,198B |
|
||
| Technology | 5 | $198B |
|
||
| Engineering / Construction | 4 | $72B |
|
||
| Energy Services | 3 | $60B |
|
||
| Utilities | 3 | $41B |
|
||
| Healthcare | 2 | $330B |
|
||
Price history
+65.0% since first listed16 events — show timeline
- 2026-04-07 Listed $179,900 LARMLS
- 2025-09-27 Rental Removed $1,610 SHOWMOJO
- 2025-09-02 Price Changed $1,610 SHOWMOJO
- 2025-08-31 Listed for Rent $1,399 SHOWMOJO
- 2024-10-17 Rental Removed $1,399 RENTALBEAST
- 2024-10-11 Price Changed $1,399 RENTALBEAST
- 2024-09-29 Price Changed $1,449 RENTALBEAST
- 2024-09-13 Listed for Rent $1,499 RENTALBEAST
- 2024-09-07 Rental Removed $1,499 RENTALBEAST
- 2024-09-05 Rental Removed $1,499 SHOWMOJO
- 2024-09-05 Listed for Rent $1,499 RENTALBEAST
- 2024-08-22 Listed for Rent $1,499 SHOWMOJO
- 2017-11-03 Sold (Public Records) — Public Records
- 2017-11-02 Sold (MLS) — LARMLS
- 2017-09-10 Listed $109,000 LARMLS
- 2006-02-09 Sold (Public Records) — Public Records
Property tax history
+5.0%/yrLatest (2025): $4,473 · +7.2% YoY. Source: county tax records.
Cash-flow waterfall
monthlySold comps — $/sqft
last 12 mo · ≤1 miLoading sold comps…