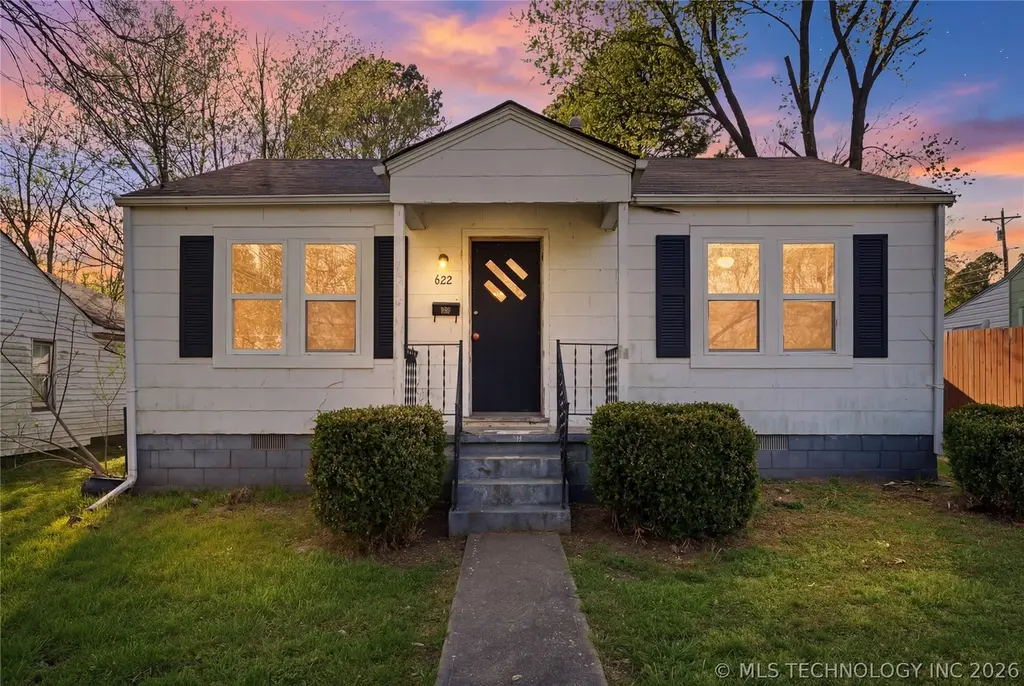
622 S Mission Ave · Tahlequah, OK
Flood risk 1/10 · Minimal
- FEMA flood zone
- X (unshaded)
- Chance of flooding over 30 yrs
- 0.0%
- Est. flood insurance / yr
- $507 – $1,088
Fire risk 7/10 · Major
- Est. fire insurance / yr
- $2,463 – $4,575
Heat risk 6/10 · Moderate
- Hot days now (above 110°F)
- 7 days/yr
- Hot days in 30 yrs
- 19 days/yr
Wind risk 2/10 · Minimal
- Chance of severe wind over 30 yrs
- 4.0%
Air-quality risk 2/10 · Minimal
- Unhealthy air days now
- 1 days/yr
- Unhealthy air days in 30 yrs
- 2 days/yr
Risk factors via First Street. Map © Google.
Why this score? — see what drove the C- grade
The composite is a weighted blend of 9 inputs, each scored 0–100. Each bar is that input's sub-score; the figure is the points it added to the 100-point composite (weight × sub-score).
- Cash flow +19.0/30.0
- ARV discount +8.8/15.0
- DSCR +6.0/10.0
- Rent growth +4.8/5.0
- 1% rule +4.0/10.0
- Livability +3.3/5.0
- Condition / age +2.5/5.0
- Schools +2.1/10.0
- Appreciation +0.0/10.0
$139,999
🖨 Deal sheet 📄 Offer letter ✓ Due diligence
Listing remarks MLS
For Sale By Owner. This remodeled 2 Bedroom, 2 Bathroom home presents an excellent long-term investment opportunity in a high-demand rental area 1.4 miles from Northeastern State University. The home was remodeled in 2023 and features a new HVAC system, providing modern updates and energy-efficient comfort, new energy efficient windows and refinished hardwood floors in the living room and one bedroom. New pex line plumbing throughout the house, new flooring, paint, granite counter tops, new cabinets in 2026. The functional layout includes a utility room, carport and fenced yard. It's close proximity to NSU campus, dining, and shopping makes this property ideal for college student rentals, faculty housing, or long-term tenants. Properties in this area consistently attract renters due to walkable amenities and easy campus access. Situated in close proximity to dining, shopping, and Northeastern State University, this property is ideal for college students, faculty housing, or rental investment.
Key facts
- Hardwood refinish
- New plumbing
- New hvac
Tags
Property features AI
Finance
- HOA & community: Gutters listed as community feature
Exterior
- Security: No safety shelter
- Utilities: Electricity available; Natural gas available; Public water; Public sewer
- Home design: Single-story; Faces east; Crawlspace foundation
- Construction: Built with wood frame; Asphalt/fiberglass roof
- Exterior features: Covered patio; Patio; Rain gutters; Dirt driveway
Interior
- Kitchen: Oven; Range; Stove
- Flooring: Vinyl flooring; Wood flooring
- Bathrooms: 2 full bathrooms
- Heating & cooling: Central heating (gas); Central air conditioning
- Interior features: Granite counters; Gas range connection; Gas oven connection; Vinyl windows; Other interior features
- Laundry & utility: Electric dryer hookup
Neighborhood map
What this means for you Summary
Snapshot
- This is a 3-bed/1.0-bath single-family listed at $140k.
Deal economics
- At list price, monthly cash flow is $147 ($2k/yr) — positive.
- The deal already cash-flows at list — no discount required.
- To meet the 1% rule (rent ≥ 1% of price), the offer needs to be $126k (10.3% below list).
- Recommended offer: $126k (10.3% below list) — sets the bar for 1% rule.
- Cap rate 7.6% vs local median 4.3% in Tahlequah — top-decile yield for the area; either an underpriced asset or a hidden risk that comps aren't pricing in. Stress-test before assuming the spread holds.
Location & tenants
- Location reads 66/100 on livability (#124 in OK) — a middle-class / working-renter tenant base. Strengths: cost of living A+, housing A; Watch: schools D, amenities D, commute F.
- Tahlequah (town): math 27% / reading 25% proficiency, ranked #109 of 270 in OK (top 40%) — low school quality limits family demand, transient renter base, plan for 1-2y turnover; 64% free/reduced lunch — lower-income household profile, screen leases tightly.
- Market conditions: Rents rising fast (+9.2%/yr); 367 active listings in the ZIP; 48 units permitted in Cherokee County in 2024 (0 in 5+ unit buildings).
Forward outlook
- Local home prices are declining (-3.0%/yr); year-one equity from $968 of loan paydown is wiped out by about $4k of value loss. Plan a longer hold.
- Cherokee County population projected at +15% by 2050 — modest demand growth; plan on rents tracking national, not racing it.
- At projected returns (-3.0% appreciation + 8.0% rent growth), your $39k cash investment doubles in ~10 years — after that, you're playing with house money.
Negotiation context
- It's been on market 77 days — a 6% lower offer ($132k) is reasonable based on typical stale-listing flexibility.
- 4 sale attempts since 17y ago with the ask held roughly flat each time — persistent listings suggest the price (not the market) is what's stuck; bring a comps-based counter.
- Current owner paid $85k; list at $140k implies a 65% gain — meaningful room to come down on a strong offer.
Risks & watch-outs
- Watch-outs: built in 1953 — expect roof / HVAC / electrical / plumbing capex.
- Climate carrying-cost: major wildfire risk; extreme-heat days projected 7→19/yr by 2055 (HVAC capex compounding) — expect insurance premiums to compound above CPI over the hold.
Questions for the listing agent
- It's been on market 77 days. Have you received any prior offers? Is the seller open to a 10% concession, seller financing, or rate buy-down credit?
- Built in 1953 — when were the roof, HVAC, electrical panel, plumbing, and water heater last replaced?
- Why hasn't it sold? Are there any deal-killer items the seller is aware of (foundation, flood, title, zoning, code violations)?
- Is there a deadline driving the sale (1031 exchange, divorce, estate, relocation)? That informs how much negotiation room exists.
- Schools are D-rated, which usually means shorter tenancies and higher turnover. Who's the typical renter profile here, and what's been the actual vacancy rate?
- What's the average days-on-market for RENTAL listings here right now (not sales)? A rising rental-DOM trend means longer vacancies and softer asking-rent achievability than the comps imply.
- What's the recent tenant-quality profile in this submarket — average credit score on applications, eviction rate, late-payment / NSF rate, and stable-employment percentage? A property-management company in the area should have these aggregated.
- How much new for-sale + rental construction is in the pipeline within 1–3 miles? Heavy new supply typically softens prices + rents 12–24 months out; constrained supply supports both.
Investment metrics
- 1% rule
- 0.90% ✗
- Cap rate
- 7.55%
- Cash-on-cash
- 4.50%
- DSCR
- 1.20
- GRM
- 9.3
CMA / ARV
- ARV (on-the-fly)
- $144,000
- Comps found
- 12
Show comp detail 12 sales within ~0.75 mi
| Address | Dist | Beds/Ba | Sqft | Sold | Price | $/sf | Match |
|---|---|---|---|---|---|---|---|
| 411 S Lee Ave | 0.30mi | 2/2.0 (-1) | 961 (+0%) | 0mo | $172,000 | $179 | 76 |
| 835 Lamer Ave | 0.13mi | 3/2.0 | 912 (-5%) | 13mo | $149,900 | $164 | 70 |
| 799 College Ct | 0.36mi | 3/1.0 | 978 (+2%) | 15mo | $142,500 | $146 | 67 |
| 504 S College Ave | 0.30mi | 2/1.0 (-1) | 973 (+1%) | 14mo | $160,100 | $165 | 67 |
| 535 S Mission Ave | 0.12mi | 2/1.0 (-1) | 868 (-10%) | 9mo | $108,900 | $125 | 66 |
| 761 Bluff Ave | 0.49mi | 2/1.0 (-1) | 944 (-2%) | 5mo | $132,900 | $141 | 65 |
| 759 Bluff St | 0.49mi | 2/1.0 (-1) | 931 (-3%) | 3mo | $134,900 | $145 | 64 |
| 510 S Cherokee Ave | 0.23mi | 2/1.0 (-1) | 1,064 (+11%) | 6mo | $164,000 | $154 | 61 |
| 811 W Choctaw St | 0.51mi | 3/1.0 | 1,041 (+8%) | 17mo | $157,000 | $151 | 48 |
| 757 Bluff St | 0.49mi | 3/1.0 | 1,103 (+15%) | 6mo | $144,000 | $131 | 48 |
| 813 W Choctaw St | 0.52mi | 3/1.0 | 1,104 (+15%) | 5mo | $120,000 | $109 | 46 |
| 404 E Ross St | 0.70mi | 3/1.0 | 1,100 (+15%) | 16mo | $165,000 | $150 | 30 |
Match score weights: distance 35% · size 25% · config 20% · recency 20%. Top-matched comps best support the ARV.
Projected returns pro-forma
-3.0% appreciation · 8.0% rent growth · sell at horizon
- IRR
- -4.4%
- Equity multiple
- 0.83×
- Total profit
- $-6,737
- Equity at exit
- $20,874
- IRR
- 9.9%
- Equity multiple
- 1.92×
- Total profit
- $36,183
- Equity at exit
- $12,105
Cash invested: $39,200 (down + closing). Projections, not guarantees.
Landlord ↔ Tenant lean methodology
- Overall (STATE)
- 83 Strongly Landlord-Friendly
- State Oklahoma
- 83 Strongly Landlord-Friendly · R+20
- County
- — inherits STATE
- City
- — inherits STATE
ZIP-level market 74464
- Rents YoY
- 9.2%
- Active inventory
- 367
- Price-to-rent
- 9.3×
Monthly cashflow live
- Estimated rent
- $1,256 medium interval (Pro) →
- Mortgage (P&I)
- −$734
- Tax from tax record
- −$53 /mo · $635/yr
- Insurance
- −$58
- HOA
- −$0
- Vacancy / Maint / Mgmt
- −$264
- Net cashflow
- $147
Break-even live
UW: 25.0% down · 7.5% · 30yr · 1.5% tax · 5.0% vac · 8.0% maint · 8.0% mgmt
Financing live
Cash to close
- Down payment
- $35,000
- Closing costs
- $4,200
- Reserves months
- —
- Total cash needed
- —
Loan-product check · same deal, 3 products live
Conventional
25% down · 7.5% · 30yr
- Down + closing
- —
- Monthly P&I
- —
- Monthly cashflow
- —
- DSCR
- —
- Eligible?
- —
Personal DTI + credit; lowest rate.
DSCR
20% down · 8.5% · 30yr
- Down + closing
- —
- Monthly P&I
- —
- Monthly cashflow
- —
- DSCR
- —
- Eligible?
- —
No personal income docs; deal must DSCR.
Hard money
10% down · 12.0% · 12mo
- Down + closing
- —
- Monthly P&I
- —
- Monthly cashflow
- —
- DSCR
- —
- Eligible?
- —
Short-term bridge; refi at stabilization.
Listing history 27 events
-
2026-06-19days on market $139,999 Active 77 DOM
-
2026-06-18days on market $139,999 Active 76 DOM
-
2026-06-17days on market $139,999 Active 75 DOM
-
2026-06-16days on market $139,999 Active 74 DOM
-
2026-06-15days on market $139,999 Active 73 DOM
-
2026-06-14days on market $139,999 Active 71 DOM
-
2026-06-12days on market $139,999 Active 70 DOM
-
2026-06-09days on market $139,999 Active 67 DOM
-
2026-06-08days on market $139,999 Active 66 DOM
-
2026-06-07days on market $139,999 Active 65 DOM
-
2026-06-05days on market $139,999 Active 62 DOM
-
2026-06-03days on market $139,999 Active 61 DOM
-
2026-06-02days on market $139,999 Active 60 DOM
-
2026-06-01days on market $139,999 Active 59 DOM
-
2026-05-31days on market $139,999 Active 58 DOM
-
2026-05-30days on market $139,999 Active 57 DOM
-
2026-05-18price $139,999
-
2026-04-28price $144,900
-
2026-04-04$147,000 Active
-
2026-01-29$142,000 Active 1007-char remark
Show marketing remark (1007 chars)
For Sale By Owner. This remodeled 2 Bedroom, 2 Bathroom home presents an excellent long-term investment opportunity in a high-demand rental area 1.4 miles from Northeastern State University. The home was remodeled in 2023 and features a new HVAC system, providing modern updates and energy-efficient comfort, new energy efficient windows and refinished hardwood floors in the living room and one bedroom. New pex line plumbing throughout the house, new flooring, paint, granite counter tops, new cabinets in 2026. The functional layout includes a utility room, carport and fenced yard. It's close proximity to NSU campus, dining, and shopping makes this property ideal for college student rentals, faculty housing, or long-term tenants. Properties in this area consistently attract renters due to walkable amenities and easy campus access. Situated in close proximity to dining, shopping, and Northeastern State University, this property is ideal for college students, faculty housing, or rental investment.
-
2023-05-01soldstatus $84,900 Closed 111-char remark
Show marketing remark (111 chars)
INVESTORS! bring you tools! Come see this nice 3 bedroom, 1 bathroom home. Selling AS IS. Owner/Licensed Agent.
-
2023-03-17status Pending 111-char remark
Show marketing remark (111 chars)
INVESTORS! bring you tools! Come see this nice 3 bedroom, 1 bathroom home. Selling AS IS. Owner/Licensed Agent.
-
2023-03-13$84,900 Active 111-char remark
Show marketing remark (111 chars)
INVESTORS! bring you tools! Come see this nice 3 bedroom, 1 bathroom home. Selling AS IS. Owner/Licensed Agent.
-
2009-04-30soldstatus $60,000
-
2009-04-29soldstatus $59,900
-
2009-03-31historical
-
2009-02-20$62,500
ⓘ Source: listings_history table (triggers on properties + properties_extension) + one-shot
backfill from property_details.listing_events for pre-trigger history.
Tax reassessment forecast OK · Resets to sale price
- Current annual tax
- $635 · $53/mo
- Projected year-2 tax
- $1,260 · $105/mo
- Expected delta
- +$625/yr (+$52/mo · 98.4%)
ⓘ Screening estimate from a state-policy table — verify with the county assessor before closing.
Climate risk First Street
- Flood 1/10 Low FEMA zone X (unshaded) · 0% chance over 30 yrs
- Wildfire 7/10 Severe
- Heat 6/10 Major 7 d/yr ≥110°F today · 19 d/yr by 30 yrs out
- Wind 2/10 Low 4% chance of damaging wind over 30 yrs
- Air quality 2/10 Low 1 unhealthy d/yr today · 2 by 30 yrs out
Nearby sold comps map
Loading sold comps map…
Walkable amenities ~0.75 mi
Loading nearby amenities…
Taxation est. · year 1
- Rental income
- $15,075
- − Mortgage interest
- −$7,842
- − Property taxes
- −$635
- − Insurance
- −$700
- − Repairs & maintenance
- −$1,206
- − Management
- −$1,206
- − Depreciation
- −$4,073
- Taxable loss
- −$586
- Est. tax savings @ 24.0%
- +$141
- After-tax cash flow
- $1,905/yr
For passive investors: Depreciation is non-cash, so a rental often shows a tax loss while cash-flowing — sheltering income. Rental losses are passive: they offset passive income freely, and up to $25,000/yr can offset ordinary (W-2) income if you actively participate and your MAGI is under $100k (phasing out to $0 by $150k); unused losses carry forward. On sale, claimed depreciation is recaptured at up to 25%, and gains may owe capital-gains tax (a 1031 exchange can defer both). Figures are a year-1 estimate at your 24.0% rate — not tax advice; consult a CPA.
Schools (NCES district)
- District
- Tahlequah
- NCES district ID
- 4029380
- Math proficiency
- 27% ▼ -14.00%
- Reading proficiency
- 25% ▼ -11.00%
- Median HH income
- $32,990
- Composite
- 21.28/100
- National rank
- #8393
- State rank
- #109 of 270 in OK
Livability — Tahlequah
- Score
- 66/100
- State rank
- #124
- US rank
- #12171
Category grades
Schools grade is shown separately in the Schools card above.
Census & demographics
- Census place
- Tahlequah, OK
- County
- Cherokee County · 31,116 people
- City population
- 31,116
- Metro
- Tahlequah, OK
- Population (ZIP)
- 31,116
- Household income
- $51,262
- Rent vs Own
- Severe rent burden
- 1058.0
Population outlook (Cherokee County) Hauer SSP2
- Today (2025)
- 51,747 people
- By 2030
- 53,481 · +3.4%
- By 2040
- 56,503 · +9.2%
- By 2050
- 59,370 · +14.7%
- By 2075
- 67,178 · +29.8%
- By 2100
- 70,900 · +37.0%
Race, ethnicity, and origin ACS 2023
- Neighborhood character
- Highly diverse neighborhood (Simpson 0.82)
- Race & ethnicity
- White 41% Native American 35% Two or more races 16% Hispanic / Latino 10% Black 2%
- Hispanic origin (detail)
- Mexican 8%
- Common ancestry
- Italian 2% Slovak 2% Lithuanian 1%
- Foreign-born
- 4% · Canada
- Languages at home
- 90% English-only · Spanish 6%
Political lean MEDSL · Cherokee
- 2024 margin
- Solid R (+32.6) · D 32.7% · R 65.3% · Other 2.0%
- 2008→2024 swing
- -20.4pp toward R · 2008: -12.2pp · 2024: -32.6pp
- All cycles
- 2024: R+32.6 2020: R+29.3 2016: R+27.5 2012: R+14.1 2008: R+12.2
Not yet ingested
- Civics
- —
Market trends
- HPI YoY
- ▼ -184.14%
- Current HPI
- 226.4004
- Rent YoY
- ▲ 9.23%
- Metro
- Tahlequah, OK
- State GDP YoY
- ▲ 1.55%
- F500 in state
- 6
Industry mix (Fortune 500 HQ in OK)
| Industry | F500 HQs | Revenue |
|---|---|---|
| Energy | 3 | $48B |
|
||
Price history
+124.0% since first listed11 events — show timeline
- 2026-05-18 Price Changed $139,999 MLS Technology, Inc.
- 2026-04-28 Price Changed $144,900 MLS Technology, Inc.
- 2026-04-04 Listed $147,000 MLS Technology, Inc.
- 2026-01-29 Listed $142,000 Fizber.com
- 2023-05-01 Sold (MLS) $84,900 MLS Technology, Inc.
- 2023-03-17 Pending — MLS Technology, Inc.
- 2023-03-13 Listed $84,900 MLS Technology, Inc.
- 2009-04-30 Sold (Public Records) $60,000 Public Records
- 2009-04-29 Sold (MLS) $59,900 MLS Technology, Inc.
- 2009-03-31 Listing Removed — MLS Technology, Inc.
- 2009-02-20 Listed $62,500 MLS Technology, Inc.
Property tax history
+0.4%/yrLatest (2025): $635 · -28.3% YoY. Source: county tax records.
Cash-flow waterfall
monthlySold comps — $/sqft
last 12 mo · ≤1 miLoading sold comps…