255 NW Golden Hills Dr. #46 Dr #46 · Pullman, WA
Flood risk No data
- FEMA flood zone
- —
- Chance of flooding over 30 yrs
- —
- Est. flood insurance / yr
- —
Fire risk No data
- Est. fire insurance / yr
- —
Heat risk No data
- Hot days now (above threshold)
- —
- Hot days in 30 yrs
- —
Wind risk No data
- Chance of severe wind over 30 yrs
- —
Air-quality risk No data
- Unhealthy air days now
- —
- Unhealthy air days in 30 yrs
- —
Risk factors via First Street. Map © Google.
Why this score? — see what drove the B+ grade
The composite is a weighted blend of 9 inputs, each scored 0–100. Each bar is that input's sub-score; the figure is the points it added to the 100-point composite (weight × sub-score).
- Cash flow +30.0/30.0
- ARV discount +11.1/15.0
- 1% rule +10.0/10.0
- DSCR +10.0/10.0
- Schools +5.8/10.0
- Livability +4.2/5.0
- Rent growth +3.4/5.0
- Condition / age +2.5/5.0
- Appreciation +0.0/10.0
$60,000
🖨 Deal sheet 📄 Offer letter ✓ Due diligence
Listing remarks MLS
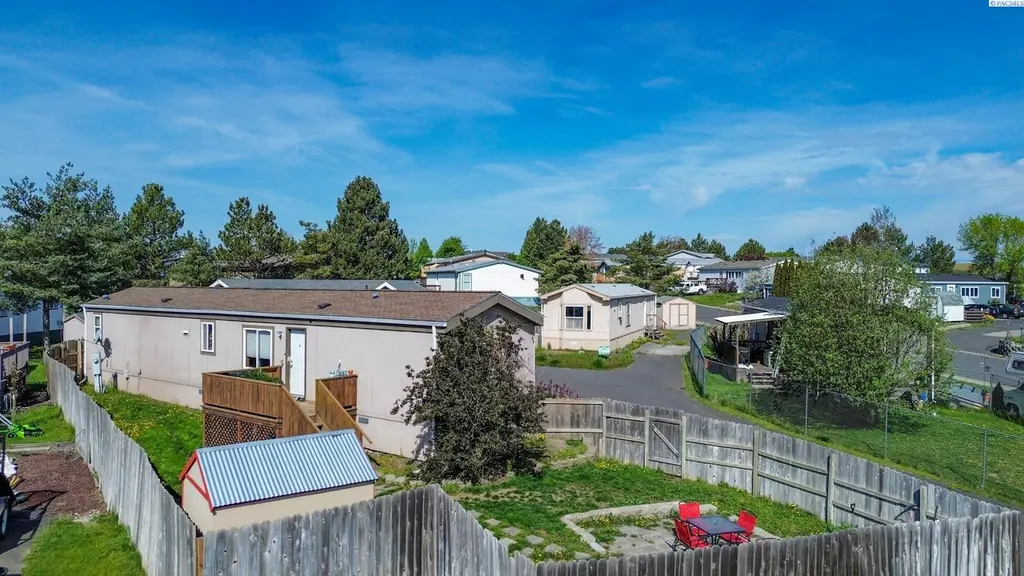
2 bedroom, 2 bathroom home in Golden Hills with a fenced yard, deck, storage shed, and off street parking. The home offers a split layout with the master bedroom on one end and the 2nd bedroom and bathroom at the other end. Great spaces a must see!
Key facts
- Bright kitchen
- Split bedroom layout
- Added work shed
Tags
Property features AI
Exterior
- Parking: No garage, off-street parking
- Utilities: Public water; Electric service on property; Electricity connected; Sewer connected
- Home design: Manufactured home (single wide); One story; Located in a manufactured home park (Golden Hills MHP); New construction
- Construction: Marlette manufactured home; Composition roof; Built as a single-level home
- Exterior features: Full yard fencing; Paved road access
Interior
- Kitchen: Dishwasher; Range; Refrigerator
- Flooring: Laminate flooring; Vinyl flooring
- Bathrooms: 2 full bathrooms
- Heating & cooling: Electric forced-air heating
- Interior features: Window coverings; Disposal; Water heater
- Laundry & utility: Washer; Dryer
Neighborhood map
What this means for you Summary
Snapshot
- This is a 2-bed/2.0-bath manufactured listed at $60k.
Deal economics
- At list price, monthly cash flow is $765 ($9k/yr) — positive.
- The deal already cash-flows at list — no discount required.
- Meets the 1% rule at list price ($1k rent vs $60k).
- Recommended offer: $58k (3.0% below list) — sets the bar for market timing.
- Cap rate 21.6% vs local median 2.2% in Pullman — top-decile yield for the area; either an underpriced asset or a hidden risk that comps aren't pricing in. Stress-test before assuming the spread holds.
Location & tenants
- Location reads 85/100 on livability (#32 in WA, #542 nationally) — a professional / high-income tenant draw. Strengths: crime A+, amenities A+, commute A+; Watch: housing C-, employment F.
- Pullman School District (town): math 63% / reading 76% proficiency, ranked #30 of 291 in WA (top 10%) — acceptable for families but not a draw, mixed tenant base, ~2y average lease.
- Market conditions: Rents rising (+3.4%/yr); 192 active listings in the ZIP; 4 comparable units currently listed for rent nearby; rentals lingering (median 44d on market — plan ~5-8 weeks vacancy on turnover, expect pricing pressure); 100% of comp listings sitting > 30 days — soft ceiling on asking rent; 49 units permitted in Whitman County in 2024 (0 in 5+ unit buildings).
- This rent runs 36% of the median local income ($48k/yr) — at the standard rent-burdened threshold; future hikes will face affordability resistance.
Forward outlook
- Local home prices are declining (-3.0%/yr); year-one equity from $415 of loan paydown is wiped out by about $2k of value loss. Plan a longer hold.
- Whitman County population projected at +57% by 2050 — long-run rental-demand tailwind backs the buy-and-hold thesis.
- At projected returns (-3.0% appreciation + 3.4% rent growth), your $17k cash investment doubles in ~3 years — after that, you're playing with house money.
Negotiation context
- It's been on market 48 days — a 3% lower offer ($58k) is reasonable based on typical stale-listing flexibility.
- 3 sale attempts since 10y ago with the ask held roughly flat each time — persistent listings suggest the price (not the market) is what's stuck; bring a comps-based counter.
Questions for the listing agent
- It's been on market 48 days. Have you received any prior offers? Is the seller open to a 3% concession, seller financing, or rate buy-down credit?
- Is there a deadline driving the sale (1031 exchange, divorce, estate, relocation)? That informs how much negotiation room exists.
- Schools are A-rated — typically a magnet for longer-tenancy family renters. What's the average tenant stay here, and is there a school-zone premium baked into asking?
- What's the average days-on-market for RENTAL listings here right now (not sales)? A rising rental-DOM trend means longer vacancies and softer asking-rent achievability than the comps imply.
- What's the recent tenant-quality profile in this submarket — average credit score on applications, eviction rate, late-payment / NSF rate, and stable-employment percentage? A property-management company in the area should have these aggregated.
- How much new for-sale + rental construction is in the pipeline within 1–3 miles? Heavy new supply typically softens prices + rents 12–24 months out; constrained supply supports both.
Investment metrics
- 1% rule
- 2.44% ✓
- Cap rate
- 21.59%
- Cash-on-cash
- 54.63%
- DSCR
- 3.43
- GRM
- 3.4
CMA / ARV
- ARV (median comp)
- $65,265
- List price
- $60,000
- Delta
- -8.07%
- Verdict
- FAIR
- Comps
- 20 within 1.0 mi
Show comp detail 12 sales within ~0.75 mi
| Address | Dist | Beds/Ba | Sqft | Sold | Price | $/sf | Match |
|---|---|---|---|---|---|---|---|
| 260 NW Golden Hills Dr #6 | 0.03mi | 2/2.0 | 980 (0%) | 3mo | $44,000 | $45 | 96 |
| 260 NW Golden Hills #61 Dr #61 | 0.03mi | 2/2.0 | 980 (0%) | 5mo | $63,000 | $64 | 94 |
| 260 NW Golden Hills #46 Dr | 0.01mi | 2/2.0 | 980 (0%) | 7mo | $55,000 | $56 | 94 |
| 260 NW Golden Hills #43 Dr #43 | 0.03mi | 2/2.0 | 924 (-6%) | 0mo | $56,000 | $61 | 89 |
| 260 NW Golden Hills #54 Dr #54 | 0.03mi | 2/2.0 | 924 (-6%) | 2mo | $51,500 | $56 | 88 |
| 260 NW Golden Hls #13 | 0.03mi | 2/2.0 | 924 (-6%) | 3mo | $55,000 | $60 | 87 |
| 255 NW Golden Hills Dr #49 Dr #49 | 0.14mi | 2/2.0 | 924 (-6%) | 3mo | $54,500 | $59 | 81 |
| 255 NW Golden Hills Drive #33 Dr | 0.02mi | 2/2.0 | 1,056 (+8%) | 10mo | $83,000 | $79 | 78 |
| 260 NW Golden Hills Dr. #10 Dr #10 | 0.03mi | 3/2.0 (+1) | 1,066 (+9%) | 2mo | $125,000 | $117 | 77 |
| 116 NW Glenhaven Dr | 0.28mi | 2/2.0 | 1,120 (+14%) | 3mo | $100,000 | $89 | 61 |
| 506 NW Park West Dr | 0.60mi | 2/1.0 | 924 (-6%) | 7mo | $30,000 | $32 | 53 |
| 508 NW Parkwest | 0.57mi | 2/1.0 | 1,056 (+8%) | 6mo | $25,000 | $24 | 51 |
Match score weights: distance 35% · size 25% · config 20% · recency 20%. Top-matched comps best support the ARV.
Projected returns pro-forma
-3.0% appreciation · 3.43% rent growth · sell at horizon
- IRR
- 53.3%
- Equity multiple
- 3.36×
- Total profit
- $39,637
- Equity at exit
- $8,946
- IRR
- 58.7%
- Equity multiple
- 6.95×
- Total profit
- $99,916
- Equity at exit
- $5,188
Cash invested: $16,800 (down + closing). Projections, not guarantees.
Landlord ↔ Tenant lean methodology
- Overall (STATE)
- 28 Tenant-Leaning
- State Washington
- 28 Tenant-Leaning · D+8
- County
- — inherits STATE
- City
- — inherits STATE
ZIP-level market 99163
- Rents YoY
- 3.4%
- Active inventory
- 192
- Price-to-rent
- 3.4×
Monthly cashflow live
- Estimated rent
- $1,466 medium interval (Pro) →
- Mortgage (P&I)
- −$315
- Tax from tax record
- −$54 /mo · $648/yr
- Insurance
- −$25
- HOA
- −$0
- Vacancy / Maint / Mgmt
- −$308
- Net cashflow
- $765
Break-even live
UW: 25.0% down · 7.5% · 30yr · 1.5% tax · 5.0% vac · 8.0% maint · 8.0% mgmt
Financing live
Cash to close
- Down payment
- $15,000
- Closing costs
- $1,800
- Reserves months
- —
- Total cash needed
- —
Loan-product check · same deal, 3 products live
Conventional
25% down · 7.5% · 30yr
- Down + closing
- —
- Monthly P&I
- —
- Monthly cashflow
- —
- DSCR
- —
- Eligible?
- —
Personal DTI + credit; lowest rate.
DSCR
20% down · 8.5% · 30yr
- Down + closing
- —
- Monthly P&I
- —
- Monthly cashflow
- —
- DSCR
- —
- Eligible?
- —
No personal income docs; deal must DSCR.
Hard money
10% down · 12.0% · 12mo
- Down + closing
- —
- Monthly P&I
- —
- Monthly cashflow
- —
- DSCR
- —
- Eligible?
- —
Short-term bridge; refi at stabilization.
Rent comps 4 comps
| Address | Beds | Baths | Sqft | Rent | $/sqft | DOM | Units | Dist |
|---|---|---|---|---|---|---|---|---|
| 640 SW Golden Hills Dr Pullman, WA | 1.0–3.0 | 1.0–2.0 | 1002 | $1,884 | $1.88 | 43d | 1 | 0.56mi |
| 605 S Grand Ave Apt M Pullman, WA | 2.0 | 2.0 | 1000 | $1,350 | $1.35 | 43d | 1 | 1.21mi |
| 605 S Grand Ave Apt B Pullman, WA | 1.0 | 1.0 | 790 | $1,000 | $1.27 | 43d | 1 | 1.21mi |
| 455 E Main St Pullman, WA | 2.0–5.0 | 2.0–5.0 | 975 | $539 | $0.55 | 43d | 1 | 1.49mi |
Listing history 20 events
-
2026-06-19days on market $60,000 Active 48 DOM
-
2026-06-18days on market $60,000 Active 47 DOM
-
2026-06-17days on market $60,000 Active 46 DOM
-
2026-06-16days on market $60,000 Active 45 DOM
-
2026-06-15days on market $60,000 Active 44 DOM
-
2026-06-14days on market $60,000 Active 42 DOM
-
2026-06-12days on market $60,000 Active 41 DOM
-
2026-06-09days on market $60,000 Active 38 DOM
-
2026-06-08days on market $60,000 Active 37 DOM
-
2026-06-07days on market $60,000 Active 36 DOM
-
2026-06-05days on market $60,000 Active 33 DOM
-
2026-06-02days on market $60,000 Active 31 DOM
-
2026-06-01days on market $60,000 Active 30 DOM
-
2026-05-31days on market $60,000 Active 29 DOM
-
2026-05-30days on market $60,000 Active 28 DOM
-
2026-05-02$60,000 Active 1334-char remark
-
2020-06-05soldstatus $55,500 248-char remark
Show marketing remark (248 chars)
2 bedroom, 2 bathroom home in Golden Hills with a fenced yard, deck, storage shed, and off street parking. The home offers a split layout with the master bedroom on one end and the 2nd bedroom and bathroom at the other end. Great spaces a must see!
-
2020-03-02$56,000 248-char remark
Show marketing remark (248 chars)
2 bedroom, 2 bathroom home in Golden Hills with a fenced yard, deck, storage shed, and off street parking. The home offers a split layout with the master bedroom on one end and the 2nd bedroom and bathroom at the other end. Great spaces a must see!
-
2016-05-23soldstatus $39,900
Show marketing remark (147 chars)
Well maintained 2 bedroom 2 bathroom home with fenced yard, deck, and storage shed. New roof in 2016, great parking space, all appliances included.
-
2016-03-20$43,000
Show marketing remark (147 chars)
Well maintained 2 bedroom 2 bathroom home with fenced yard, deck, and storage shed. New roof in 2016, great parking space, all appliances included.
ⓘ Source: listings_history table (triggers on properties + properties_extension) + one-shot
backfill from property_details.listing_events for pre-trigger history.
Tax reassessment forecast WA · Resets to sale price
- Current annual tax
- $648 · $54/mo
- Projected year-2 tax
- $648 · $54/mo
- Expected delta
- $0/yr ($0/mo · 0.0%)
ⓘ Screening estimate from a state-policy table — verify with the county assessor before closing.
Nearby sold comps map
Loading sold comps map…
Walkable amenities ~0.75 mi
Loading nearby amenities…
Taxation est. · year 1
- Rental income
- $17,597
- − Mortgage interest
- −$3,361
- − Property taxes
- −$648
- − Insurance
- −$300
- − Repairs & maintenance
- −$1,408
- − Management
- −$1,408
- − Depreciation
- −$1,745
- Taxable income
- $8,727
- Est. tax owed @ 24.0%
- −$2,095
- After-tax cash flow
- $7,084/yr
For passive investors: Depreciation is non-cash, so a rental often shows a tax loss while cash-flowing — sheltering income. Rental losses are passive: they offset passive income freely, and up to $25,000/yr can offset ordinary (W-2) income if you actively participate and your MAGI is under $100k (phasing out to $0 by $150k); unused losses carry forward. On sale, claimed depreciation is recaptured at up to 25%, and gains may owe capital-gains tax (a 1031 exchange can defer both). Figures are a year-1 estimate at your 24.0% rate — not tax advice; consult a CPA.
Schools (NCES district)
- District
- Pullman School District
- NCES district ID
- 5306930
- Math proficiency
- 63% ▼ -1.00%
- Reading proficiency
- 76% ▲ 1.00%
- Median HH income
- $29,034
- Composite
- 58.15/100
- National rank
- #2131
- State rank
- #30 of 291 in WA
Livability — Pullman
- Score
- 85/100
- State rank
- #32
- US rank
- #542
Category grades
Schools grade is shown separately in the Schools card above.
Census & demographics
- Census place
- Pullman, WA
- County
- Whitman County · 34,022 people
- City population
- 34,022
- Metro
- Pullman, WA
- Population (ZIP)
- 34,022
- Household income
- $48,231
- Rent vs Own
- Severe rent burden
- 3453.0
Population outlook (Whitman County) Hauer SSP2
- Today (2025)
- 57,639 people
- By 2030
- 63,440 · +10.1%
- By 2040
- 75,870 · +31.6%
- By 2050
- 90,294 · +56.7%
- By 2075
- 131,756 · +128.6%
- By 2100
- 169,239 · +193.6%
Race, ethnicity, and origin ACS 2023
- Neighborhood character
- Predominantly White (69%)
- Race & ethnicity
- White 69% Two or more races 12% Asian 10% Hispanic / Latino 9% Black 2%
- Hispanic origin (detail)
- Mexican 6%
- Common ancestry
- Italian 5% Portuguese 5% Slovak 3%
- Foreign-born
- 10% · China, Canada, Vietnam
- Languages at home
- 86% English-only · Spanish 4% Chinese 4% Other Indo-European 2%
Political lean MEDSL · Whitman
- 2024 margin
- Lean D (+9.0) · D 52.8% · R 43.8% · Other 3.4%
- 2008→2024 swing
- +3.5pp toward D · 2008: 5.5pp · 2024: 9.0pp
- All cycles
- 2024: D+9.0 2020: D+10.0 2016: D+0.5 2012: R+3.7 2008: D+5.5
Not yet ingested
- Civics
- —
Market trends
- HPI YoY
- ▼ -367.44%
- Current HPI
- 153.4778
- Rent YoY
- ▲ 3.43%
- Metro
- Pullman, WA
- State GDP YoY
- ▲ 4.65%
- F500 in state
- 22
Industry mix (Fortune 500 HQ in WA)
| Industry | F500 HQs | Revenue |
|---|---|---|
| Retail | 2 | $269B |
|
||
| Technology / Retail | 1 | $638B |
|
||
| Technology | 1 | $245B |
|
||
| Telecommunications | 1 | $38B |
|
||
| Food / Beverage | 1 | $36B |
|
||
| Automotive / Trucks | 1 | $34B |
|
||
Price history
+39.5% since first listed5 events — show timeline
- 2026-05-02 Listed $60,000 PACMLS
- 2020-06-05 Sold (MLS) $55,500 PACMLS
- 2020-03-02 Listed $56,000 PACMLS
- 2016-05-23 Sold (MLS) $39,900 PACMLS
- 2016-03-20 Listed $43,000 PACMLS
Property tax history
+1.3%/yrLatest (2026): $648 · -5.2% YoY. Source: county tax records.
Cash-flow waterfall
monthlySold comps — $/sqft
last 12 mo · ≤1 miLoading sold comps…