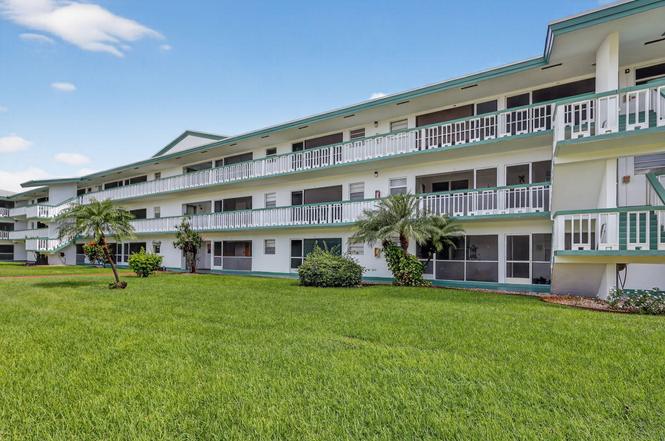
5300 Washington St Unit J116 · Hollywood, FL
Flood risk 1/10 · Minimal
- FEMA flood zone
- X (shaded)
- Chance of flooding over 30 yrs
- 0.0%
- Est. flood insurance / yr
- $507 – $1,088
Fire risk 1/10 · Minimal
- Est. fire insurance / yr
- $947 – $1,759
Heat risk 10/10 · Severe
- Hot days now (above 105°F)
- 6 days/yr
- Hot days in 30 yrs
- 24 days/yr
Wind risk 10/10 · Severe
- Chance of severe wind over 30 yrs
- 99.0%
Air-quality risk 2/10 · Minimal
- Unhealthy air days now
- 2 days/yr
- Unhealthy air days in 30 yrs
- 2 days/yr
Risk factors via First Street. Map © Google.
Why this score? — see what drove the B grade
The composite is a weighted blend of 9 inputs, each scored 0–100. Each bar is that input's sub-score; the figure is the points it added to the 100-point composite (weight × sub-score).
- Cash flow +30.0/30.0
- 1% rule +10.0/10.0
- DSCR +10.0/10.0
- ARV discount +7.5/15.0
- Schools +4.1/10.0
- Livability +3.8/5.0
- Rent growth +3.1/5.0
- Condition / age +2.5/5.0
- Appreciation +0.0/10.0
$99,500
🖨 Deal sheet 📄 Offer letter ✓ Due diligence
Listing remarks
Beautifully maintained 2-bed, 2-bath condo in the gated 55+ Beverly Hills community of Hollywood. Bright and spacious with tile floors, open living/dining area, and a screened patio perfect for morning coffee. Enjoy resort-style amenities including a pool, clubhouse, fitness room, and BBQ area. Convenient first-floor location with easy access to parking and community facilities. Just minutes to shopping, dining, the beach, and major highways. A perfect blend of comfort, convenience, and active adult living!
Key facts
- Gated community
- Screened patio
- Clubhouse
Tags
Property features AI
Finance
- Financial info: Pets not allowed; Senior community
- HOA & community: Has association; Monthly HOA fee (amount listed separately); Association amenities: billiard room, elevators, jogging path, laundry, community room, courtesy bus; HOA includes cable TV, grounds maintenance, elevator
Exterior
- Parking: Assigned parking; Guest parking
- Security: Gated community (no guard)
- Utilities: Three phase electric; Cable available
- Home design: Condominium; Resale; Faces west; 3 total stories; Living area listed as 880
- Construction: Built with block/concrete/CBS construction
- Exterior features: Screened porch; Porch; Not waterfront
Interior
- Kitchen: Electric range; Dishwasher; Refrigerator; Electric water heater
- Bedrooms: 2 bedrooms on main level
- Flooring: Ceramic tile
- Bathrooms: 1 full bathroom; 1 half bathroom (2 bathrooms total)
- Heating & cooling: Central heating; Central air; Ceiling fans; Paddle fans
- Interior features: Walk-in closets; Unfurnished
- Laundry & utility: Laundry available (community/association laundry listed)
Neighborhood map
What this means for you Summary
Snapshot
- This is a 2-bed/1.5-bath condo listed at $100k.
Deal economics
- At list price, monthly cash flow is $372 ($4k/yr) — positive.
- The deal already cash-flows at list — no discount required.
- Meets the 1% rule at list price ($2k rent vs $100k).
- Recommended offer: $88k (12.0% below list) — sets the bar for market timing.
- Cap rate 10.8% vs local median 3.2% in Hollywood — top-decile yield for the area; either an underpriced asset or a hidden risk that comps aren't pricing in. Stress-test before assuming the spread holds.
Location & tenants
- Location reads 76/100 on livability (#232 in FL, #3,548 nationally) — a middle-class / working-renter tenant base. Strengths: commute A+, housing A+, crime B+; Watch: amenities D.
- Broward (suburban): math 42% / reading 53% proficiency, ranked #46 of 73 in FL (top 63%) — families likely to look elsewhere, expect single-tenant / working-renter base with shorter leases.
- Market conditions: Rents rising (+2.4%/yr); 529 active listings in the ZIP; 40 comparable units currently listed for rent nearby; rentals at typical pace (median 17d on market — plan ~3-4 weeks tenant-placement turnaround); 2,111 units permitted in Broward County in 2024 (1,265 in 5+ unit buildings).
- This rent runs 34% of the median local income ($71k/yr) — at the standard rent-burdened threshold; future hikes will face affordability resistance.
Forward outlook
- Local home prices are declining (-3.0%/yr); year-one equity from $688 of loan paydown is wiped out by about $3k of value loss. Plan a longer hold.
- Broward County population projected at +34% by 2050 — long-run rental-demand tailwind backs the buy-and-hold thesis.
- At projected returns (-3.0% appreciation + 2.4% rent growth), your $28k cash investment doubles in ~8 years — after that, you're playing with house money.
Negotiation context
- It's been on market 232 days — a 12% lower offer ($88k) is reasonable based on typical stale-listing flexibility.
- 4 sale attempts since 2y ago; this cycle's ask has dropped $26k (20%) from the opening price — seller is motivated, your offer sets the floor, not the list.
Risks & watch-outs
- Watch-outs: HOA is 26% of rent.
- Climate carrying-cost: severe wind risk, 99% chance of damaging wind over 30y; extreme-heat days projected 6→24/yr by 2055 (HVAC capex compounding) — expect insurance premiums to compound above CPI over the hold.
Questions for the listing agent
- It's been on market 232 days. Have you received any prior offers? Is the seller open to a 12% concession, seller financing, or rate buy-down credit?
- Built in 1969 — when were the roof, HVAC, electrical panel, plumbing, and water heater last replaced?
- What does the HOA fee cover, when was the last increase, and are there any pending special assessments or reserve-fund shortfalls?
- Any open or pending special assessments — roof, HVAC, plumbing, elevator, façade? What's the per-unit balance and payoff schedule, and is the seller paying it off at close or rolling it to the buyer?
- Why hasn't it sold? Are there any deal-killer items the seller is aware of (foundation, flood, title, zoning, code violations)?
- Is there a deadline driving the sale (1031 exchange, divorce, estate, relocation)? That informs how much negotiation room exists.
- What's the average days-on-market for RENTAL listings here right now (not sales)? A rising rental-DOM trend means longer vacancies and softer asking-rent achievability than the comps imply.
- What's the recent tenant-quality profile in this submarket — average credit score on applications, eviction rate, late-payment / NSF rate, and stable-employment percentage? A property-management company in the area should have these aggregated.
- How much new apartment / multifamily construction is in the pipeline within 1–3 miles? Heavy new supply (>2% of stock underway) typically softens rents 12–24 months out; light construction supports rent growth.
Investment metrics
- 1% rule
- 2.03% ✓
- Cap rate
- 10.78%
- Cash-on-cash
- 16.04%
- DSCR
- 1.71
- GRM
- 4.1
CMA / ARV
No comps found within radius.
Projected returns pro-forma
-3.0% appreciation · 2.41% rent growth · sell at horizon
- IRR
- 6.3%
- Equity multiple
- 1.24×
- Total profit
- $6,765
- Equity at exit
- $14,836
- IRR
- 15.1%
- Equity multiple
- 2.19×
- Total profit
- $33,064
- Equity at exit
- $8,603
Cash invested: $27,860 (down + closing). Projections, not guarantees.
Landlord ↔ Tenant lean methodology
- Overall (STATE)
- 87 Strongly Landlord-Friendly
- State Florida
- 87 Strongly Landlord-Friendly · R+3
- County
- — inherits STATE
- City
- — inherits STATE
ZIP-level market 33021
- Rents YoY
- 2.4%
- Active inventory
- 529
- Price-to-rent
- 4.1×
Monthly cashflow live
- Estimated rent
- $2,015 high interval (Pro) →
- Mortgage (P&I)
- −$522
- Tax est. 1.5%
- −$124 /mo · $1,492/yr
- Insurance
- −$41
- HOA
- −$532
- Vacancy / Maint / Mgmt
- −$423
- Net cashflow
- $372
Break-even live
UW: 25.0% down · 7.5% · 30yr · 1.5% tax · 5.0% vac · 8.0% maint · 8.0% mgmt
Financing live
Cash to close
- Down payment
- $24,875
- Closing costs
- $2,985
- Reserves months
- —
- Total cash needed
- —
Loan-product check · same deal, 3 products live
Conventional
25% down · 7.5% · 30yr
- Down + closing
- —
- Monthly P&I
- —
- Monthly cashflow
- —
- DSCR
- —
- Eligible?
- —
Personal DTI + credit; lowest rate.
DSCR
20% down · 8.5% · 30yr
- Down + closing
- —
- Monthly P&I
- —
- Monthly cashflow
- —
- DSCR
- —
- Eligible?
- —
No personal income docs; deal must DSCR.
Hard money
10% down · 12.0% · 12mo
- Down + closing
- —
- Monthly P&I
- —
- Monthly cashflow
- —
- DSCR
- —
- Eligible?
- —
Short-term bridge; refi at stabilization.
Rent comps 40 comps
| Address | Beds | Baths | Sqft | Rent | $/sqft | DOM | Units | Dist |
|---|---|---|---|---|---|---|---|---|
| 5300 Washington St Hollywood, FL | 2.0 | 1.5–2.0 | 979 | $1,832 | $1.87 | 5d | 3 | 0.02mi |
| 5500 Washington St Hollywood, FL | 1.0–3.0 | 1.0–2.0 | 1000 | $2,095 | $2.10 | 3d | 18 | 0.16mi |
| 981 Hillcrest Ct #114 Hollywood, FL | 2.0 | 2.0 | 899 | $2,000 | $2.22 | 24d | 1 | 0.22mi |
| 4902 Washington St #4 Hollywood, FL | 2.0 | 2.0 | 1080 | $2,650 | $2.45 | 13d | 1 | 0.23mi |
| 4902 Washington St #4 Hollywood, FL | 2.0 | 2.0 | 1080 | $2,650 | $2.45 | 3d | 1 | 0.23mi |
| 4902 Washington St #4 Hollywood, FL | 2.0 | 2.0 | 1080 | $2,750 | $2.55 | 17d | 1 | 0.23mi |
| 4917 Washington St Hollywood, FL | 1.0 | 1.0 | 600 | $1,300 | $2.17 | 8d | 1 | 0.24mi |
| 4812 Washington St Unit 147 Hollywood, FL | 2.0 | 2.0 | 1080 | $2,200 | $2.04 | 8d | 1 | 0.26mi |
| 4812 Washington St #7 Hollywood, FL | 2.0 | 2.0 | 1080 | $2,200 | $2.04 | 19d | 1 | 0.26mi |
| 4802 Washington St #5 Hollywood, FL | 2.0 | 2.0 | 1080 | $2,500 | $2.31 | 24d | 1 | 0.28mi |
| 4700 Washington St Hollywood, FL | 1.0 | 1.5 | 775 | $1,725 | $2.23 | 13d | 3 | 0.33mi |
| 4700 Washington St Hollywood, FL | 1.0 | 1.5 | 775 | $1,725 | $2.23 | 8d | 3 | 0.33mi |
| 950 Hillcrest Dr Hollywood, FL | 1.0 | 1.5 | 775 | $1,675 | $2.16 | 15d | 2 | 0.38mi |
| 5805 Washington St #14 Hollywood, FL | 2.0 | 2.0 | 884 | $1,900 | $2.15 | 21d | 1 | 0.42mi |
| 5821 Washington St Hollywood, FL | 1.0 | 1.0 | 650 | $1,775 | $2.73 | 24d | 2 | 0.43mi |
| 5835 Washington St #52 Hollywood, FL | 1.0 | 1.0 | 650 | $1,625 | $2.50 | 11d | 1 | 0.46mi |
| 5835 Washington St #52 Hollywood, FL | 1.0 | 1.0 | 650 | $1,600 | $2.46 | 5d | 1 | 0.46mi |
| 901 Hillcrest Dr #208 Hollywood, FL | 1.0 | 1.5 | 830 | $1,700 | $2.05 | 24d | 1 | 0.46mi |
| 901 Hillcrest Dr #307 Hollywood, FL | 1.0 | 1.5 | 830 | $1,750 | $2.11 | 24d | 1 | 0.46mi |
| 5901 Washington St #247 Hollywood, FL | 1.0 | 1.0 | 650 | $1,600 | $2.46 | 24d | 1 | 0.47mi |
| 5901 Washington St #247 Hollywood, FL | 1.0 | 1.0 | 650 | $1,650 | $2.54 | 8d | 1 | 0.47mi |
| 5740 Mayo St #4 Hollywood, FL | 2.0 | 1.0 | 550 | $1,895 | $3.45 | 24d | 1 | 0.48mi |
| 919 Hillcrest Dr #511 Hollywood, FL | 1.0 | 1.5 | 830 | $1,700 | $2.05 | 24d | 1 | 0.50mi |
| 919 Hillcrest Dr #303 Hollywood, FL | 2.0 | 2.0 | 1100 | $2,000 | $1.82 | 24d | 1 | 0.50mi |
| 5921 Washington St #124 Hollywood, FL | 2.0 | 2.0 | 858 | $1,850 | $2.16 | 5d | 1 | 0.51mi |
| 5921 Washington St #124 Hollywood, FL | 2.0 | 2.0 | 858 | $1,850 | $2.16 | 24d | 1 | 0.51mi |
| 1200 Tallwood Ave #302 Hollywood, FL | 2.0 | 2.0 | 840 | $2,225 | $2.65 | 3d | 1 | 0.54mi |
| 1200 Tallwood Ave #302 Hollywood, FL | 2.0 | 2.0 | 840 | $2,250 | $2.68 | 24d | 1 | 0.54mi |
| 900 Tallwood Ave #207 Hollywood, FL | 1.0 | 1.0 | 640 | $1,575 | $2.46 | 21d | 1 | 0.54mi |
| 5401 SW 20th St Unit B West Park, FL | 1.0 | 1.0 | 600 | $1,500 | $2.50 | 24d | 1 | 0.57mi |
| 224 S 57th Ave Unit 1-3 Hollywood, FL | 1.0 | 1.0 | 900 | $1,550 | $1.72 | 8d | 1 | 0.59mi |
| 5230 Hollywood Blvd Hollywood, FL | 1.0–4.0 | 1.0–2.0 | 956 | $1,667 | $1.74 | 24d | 1 | 0.61mi |
| 5112 Hollywood Blvd #3 Hollywood, FL | 1.0 | 1.0 | 650 | $1,550 | $2.38 | 17d | 1 | 0.61mi |
| 5112 Hollywood Blvd Hollywood, FL | 1.0–2.0 | 1.0 | 727 | $2,000 | $2.75 | 19d | 2 | 0.61mi |
| 5420 Hollywood Blvd Unit 208 Hollywood, FL | 1.0 | 1.0 | 700 | $1,775 | $2.54 | 3d | 1 | 0.62mi |
| 5420 Hollywood Blvd Unit 208 Hollywood, FL | 1.0 | 1.0 | 700 | $1,775 | $2.54 | 4d | 1 | 0.62mi |
| 5931 Wiley St Unit 5931 Hollywood, FL | 1.0 | 1.0 | 650 | $1,600 | $2.46 | 24d | 1 | 0.66mi |
| 5141 Hollywood Blvd Unit 209 Hollywood, FL | 2.0 | 1.0 | 700 | $2,175 | $3.11 | 3d | 1 | 0.66mi |
| 5141 Hollywood Blvd Apt 206 Hollywood, FL | 1.0 | 1.0 | 700 | $1,825 | $2.61 | 3d | 1 | 0.67mi |
| 4933 Hollywood Blvd Unit 5450-209 Hollywood, FL | 2.0 | 1.5 | 950 | $2,250 | $2.37 | 24d | 1 | 0.68mi |
HOA detail condo
- Monthly dues
- $532 · $6,384/yr
- Likely covers
- poolsecurity
- Assessments
- None detected in remarks — confirm with the listing agent.
Listing history 26 events
-
2026-06-18days on market $99,500 Active 232 DOM
-
2026-06-17days on market $99,500 Active 231 DOM
-
2026-06-16days on market $99,500 Active 230 DOM
-
2026-06-15days on market $99,500 Active 229 DOM
-
2026-06-13days on market $99,500 Active 227 DOM
-
2026-06-09days on market $99,500 Active 223 DOM
-
2026-06-07days on market $99,500 Active 221 DOM
-
2026-06-04days on market $99,500 Active 218 DOM
-
2026-06-03days on market $99,500 Active 217 DOM
-
2026-06-02days on market $99,500 Active 216 DOM
-
2026-06-01days on market $99,500 Active 215 DOM
-
2026-05-31days on market $99,500 Active 214 DOM
-
2026-03-16price $99,500
-
2026-01-19price $115,000
-
2025-10-29$125,000 Active
-
2025-09-03historical
-
2025-08-07price $119,500
-
2025-06-23price $134,000
-
2025-04-25$139,000 Active
-
2025-04-25status Active
-
2025-04-14status Pending
-
2025-03-04historical
-
2025-02-26historical Active Under Contract
-
2025-02-12price $139,000
-
2024-10-18price $145,000
-
2024-09-05$155,000 Active
ⓘ Source: listings_history table (triggers on properties + properties_extension) + one-shot
backfill from property_details.listing_events for pre-trigger history.
Climate risk First Street
- Flood 1/10 Low FEMA zone X (shaded) · 0% chance over 30 yrs
- Wildfire 1/10 Low
- Heat 10/10 Extreme 6 d/yr ≥105°F today · 24 d/yr by 30 yrs out
- Wind 10/10 Extreme 99% chance of damaging wind over 30 yrs
- Air quality 2/10 Low 2 unhealthy d/yr today · 2 by 30 yrs out
Nearby sold comps map
Loading sold comps map…
Walkable amenities ~0.75 mi
Loading nearby amenities…
Taxation est. · year 1
- Rental income
- $24,183
- − Mortgage interest
- −$5,574
- − Property taxes
- −$1,492
- − Insurance
- −$498
- − Repairs & maintenance
- −$1,935
- − Management
- −$1,935
- − HOA
- −$6,384
- − Depreciation
- −$2,895
- Taxable income
- $3,472
- Est. tax owed @ 24.0%
- −$833
- After-tax cash flow
- $3,636/yr
For passive investors: Depreciation is non-cash, so a rental often shows a tax loss while cash-flowing — sheltering income. Rental losses are passive: they offset passive income freely, and up to $25,000/yr can offset ordinary (W-2) income if you actively participate and your MAGI is under $100k (phasing out to $0 by $150k); unused losses carry forward. On sale, claimed depreciation is recaptured at up to 25%, and gains may owe capital-gains tax (a 1031 exchange can defer both). Figures are a year-1 estimate at your 24.0% rate — not tax advice; consult a CPA.
Schools (NCES district)
- District
- Broward
- NCES district ID
- 1200180
- Math proficiency
- 42% ▼ -18.00%
- Reading proficiency
- 53% ▼ -5.00%
- Median HH income
- $52,139
- Composite
- 40.88/100
- National rank
- #3621
- State rank
- #46 of 73 in FL
Livability — Hollywood
- Score
- 76/100
- State rank
- #232
- US rank
- #3548
Category grades
Schools grade is shown separately in the Schools card above.
Census & demographics
- Census place
- Hollywood, FL
- County
- Broward County · 1,963,430 people
- City population
- 109,079
- Metro
- Miami-Fort Lauderdale-Pompano Beach, FL
- Population (ZIP)
- 48,464
- Household income
- $71,318
- Rent vs Own
- Severe rent burden
- 2151.0
Population outlook (Broward County) Hauer SSP2
- Today (2025)
- 2,207,033 people
- By 2030
- 2,360,704 · +7.0%
- By 2040
- 2,661,208 · +20.6%
- By 2050
- 2,946,698 · +33.5%
- By 2075
- 3,602,273 · +63.2%
- By 2100
- 3,970,984 · +79.9%
Race, ethnicity, and origin ACS 2023
- Neighborhood character
- Diverse neighborhood (Simpson 0.65)
- Race & ethnicity
- White 45% Hispanic / Latino 37% Two or more races 17% Black 13% Asian 3%
- Hispanic origin (detail)
- Puerto Rican 5% Cuban 10% Dominican 2%
- Common ancestry
- Romanian 3% Scotch-Irish 2% Hispanic 2%
- Foreign-born
- 35% · Canada, Jamaica, Dominican Republic
- Languages at home
- 53% English-only · Spanish 33% French/Haitian/Cajun 4% Russian/Polish/Slavic 2%
Political lean MEDSL · Broward
- 2024 margin
- D (+17.0) · D 58.0% · R 41.0%
- 2008→2024 swing
- -17.8pp toward R · 2008: 34.7pp · 2024: 17.0pp
- All cycles
- 2024: D+17.0 2020: D+29.8 2016: D+35.0 2012: D+34.9 2008: D+34.7
Not yet ingested
- Civics
- —
Market trends
- HPI YoY
- ▼ -404.28%
- Current HPI
- 429.7129
- Rent YoY
- ▲ 2.41%
- Metro
- Miami-Fort Lauderdale-Pompano Beach, FL
- State GDP YoY
- ▲ 3.28%
- F500 in state
- 36
Industry mix (Fortune 500 HQ in FL)
| Industry | F500 HQs | Revenue |
|---|---|---|
| Industrial Technology | 2 | $29B |
|
||
| Insurance | 2 | $17B |
|
||
| Retail | 1 | $60B |
|
||
| Technology Distribution | 1 | $58B |
|
||
| Homebuilding | 1 | $35B |
|
||
| Technology Manufacturing | 1 | $35B |
|
||
Price history
-35.8% since first listed14 events — show timeline
- 2026-03-16 Price Changed $99,500 Beaches MLS
- 2026-01-19 Price Changed $115,000 Beaches MLS
- 2025-10-29 Listed $125,000 Beaches MLS
- 2025-09-03 Listing Removed — MARMLS
- 2025-08-07 Price Changed $119,500 MARMLS
- 2025-06-23 Price Changed $134,000 MARMLS
- 2025-04-25 Listed $139,000 MARMLS
- 2025-04-25 Relisted — MARMLS
- 2025-04-14 Pending — MARMLS
- 2025-03-04 Listing Removed — MARMLS
- 2025-02-26 Contingent — MARMLS
- 2025-02-12 Price Changed $139,000 MARMLS
- 2024-10-18 Price Changed $145,000 MARMLS
- 2024-09-05 Listed $155,000 MARMLS
Cash-flow waterfall
monthlySold comps — $/sqft
last 12 mo · ≤1 miLoading sold comps…