 Multi-family
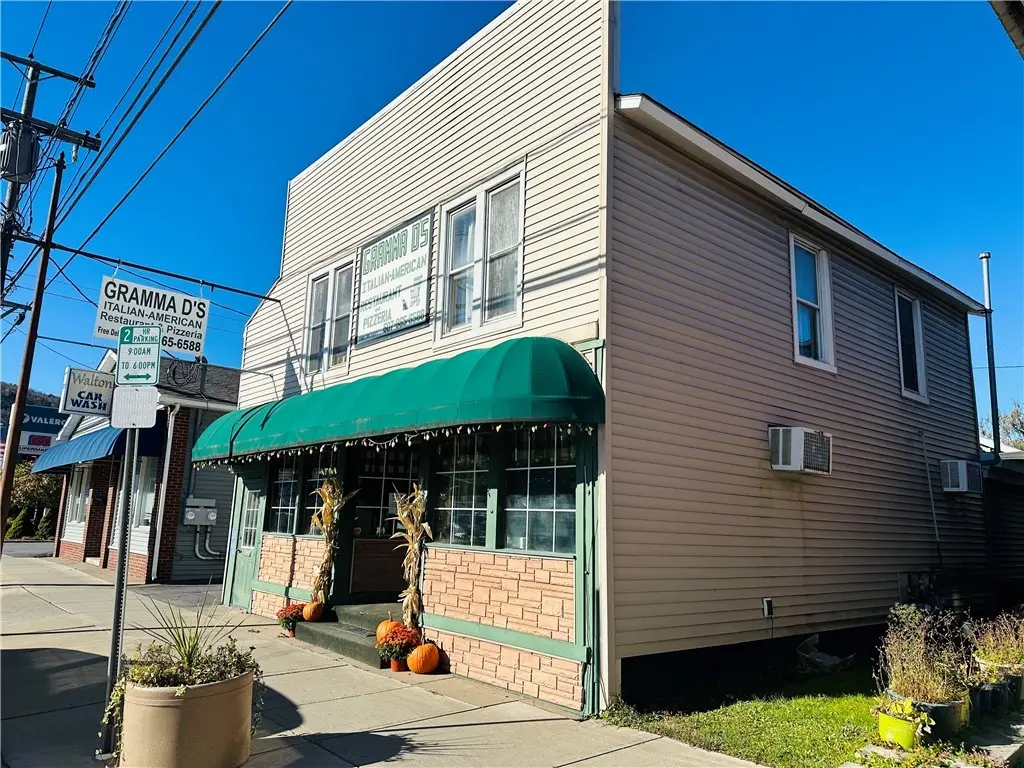
192 Delaware St · Walton, NY
Flood risk No data
- FEMA flood zone
- —
- Chance of flooding over 30 yrs
- —
- Est. flood insurance / yr
- —
Fire risk No data
- Est. fire insurance / yr
- —
Heat risk No data
- Hot days now (above threshold)
- —
- Hot days in 30 yrs
- —
Wind risk No data
- Chance of severe wind over 30 yrs
- —
Air-quality risk No data
- Unhealthy air days now
- —
- Unhealthy air days in 30 yrs
- —
Risk factors via First Street. Map © Google.
Why this score? — see what drove the B grade
The composite is a weighted blend of 9 inputs, each scored 0–100. Each bar is that input's sub-score; the figure is the points it added to the 100-point composite (weight × sub-score).
- Cash flow +30.0/30.0
- 1% rule +10.0/10.0
- DSCR +10.0/10.0
- Appreciation +7.9/10.0
- ARV discount +5.2/15.0
- Schools +3.5/10.0
- Livability +3.5/5.0
- Rent growth +2.5/5.0
- Condition / age +2.2/5.0
$320,000
🖨 Deal sheet 📄 Offer letter ✓ Due diligence
Multi-family units
County records classify this as Multi-Family (2-4 Unit). Listing-text estimate: 1 unit. estimate disagrees with records
Listing remarks
A True Walton Landmark with 30 Years of Local Flavor! Here’s your chance to own a true staple of Walton! A beloved pizza restaurant that’s been serving the community for over 30 years! Perfectly located in the heart of town, this well-established business is ready for its next owner to carry on the tradition or bring new ideas to life. The restaurant offers a fully equipped kitchen, spacious dining area and excellent visibility in a high-traffic location. Locals know it as the go-to spot for great food and friendly service. A place where memories (and pizzas) have been made for decades. Adding to its value, the property includes a 2 bedroom apartment above the restaurant. Ideal
Key facts
- 5,663 sq ft lot
- 3 garage spots
- Built 1900
Property features AI
Finance
- Financial info: Operating expense details: see remarks; Owner pays: other (see remarks); Rent includes: see remarks
Exterior
- Parking: Three-car garage; Two or more parking spaces
- Utilities: Public water connected; Sewer connected
- Home design: Two-story property; Resale property; Business zoning
- Construction: Vinyl siding construction; Metal roof
- Exterior features: Rectangular lot; Main thoroughfare frontage
Interior
- Kitchen: Dishwasher; Oven/Range; Refrigerator; Microwave; Dining area open to kitchen
- Bedrooms: One unit includes 2 bedrooms
- Flooring: Carpet; Laminate; Varies
- Bathrooms: Three full bathrooms total; One unit has 2 full bathrooms; the other unit has 1 full bathroom
- Heating & cooling: Gas heating; Baseboard heating; Has heating
- Interior features: Ceiling fan(s)
- Laundry & utility: Electric water heater
Neighborhood map
What this means for you Summary
Snapshot
- This is a 2-bed/3.0-bath multifamily listed at $320k. Condition is rated fair.
Deal economics
- At list price, monthly cash flow is $2k ($23k/yr) — positive.
- The deal already cash-flows at list — no discount required.
- Meets the 1% rule at list price ($5k rent vs $320k).
- Recommended offer: $310k (3.0% below list) — sets the bar for market timing.
- Cap rate 13.5% vs local median 7.8% in Walton — top-decile yield for the area; either an underpriced asset or a hidden risk that comps aren't pricing in. Stress-test before assuming the spread holds.
Location & tenants
- Location reads 70/100 on livability (#443 in NY) — a middle-class / working-renter tenant base. Strengths: cost of living A+, health & safety A+; Watch: schools D+, amenities F, commute F.
- Walton Central School District (town): math 36% / reading 47% proficiency, ranked #510 of 590 in NY (top 86%) — families likely to look elsewhere, expect single-tenant / working-renter base with shorter leases.
- Market conditions: 57 active listings in the ZIP; 66 units permitted in Delaware County in 2024 (0 in 5+ unit buildings).
Forward outlook
- In year one you build about $21k of equity ($2k loan paydown + $19k appreciation (5.8% local appreciation)).
- Delaware County population projected at -27% by 2050 — secular population decline; favor cash flow + early exit over multi-decade hold.
- At projected returns (5.8% appreciation + 3.0% rent growth), your $90k cash investment doubles in ~2 years — after that, you're playing with house money.
- By year 2, paydown + projected appreciation supports a ~$33k cash-out refi (75% LTV) — recoverable capital for the next deal without selling this one.
Negotiation context
- It's been on market 44 days — a 3% lower offer ($310k) is reasonable based on typical stale-listing flexibility.
- 3 sale attempts since 2y ago with the ask held roughly flat each time — persistent listings suggest the price (not the market) is what's stuck; bring a comps-based counter.
Risks & watch-outs
- Watch-outs: built in 1900 — expect roof / HVAC / electrical / plumbing capex.
Questions for the listing agent
- It's been on market 44 days. Have you received any prior offers? Is the seller open to a 3% concession, seller financing, or rate buy-down credit?
- Have any recent inspections been done? Can we get a copy of the seller's disclosures and any deferred-maintenance estimates?
- Built in 1900 — when were the roof, HVAC, electrical panel, plumbing, and water heater last replaced?
- Is there a deadline driving the sale (1031 exchange, divorce, estate, relocation)? That informs how much negotiation room exists.
- Schools are D-rated, which usually means shorter tenancies and higher turnover. Who's the typical renter profile here, and what's been the actual vacancy rate?
- What's the average days-on-market for RENTAL listings here right now (not sales)? A rising rental-DOM trend means longer vacancies and softer asking-rent achievability than the comps imply.
- What's the recent tenant-quality profile in this submarket — average credit score on applications, eviction rate, late-payment / NSF rate, and stable-employment percentage? A property-management company in the area should have these aggregated.
- How much new apartment / multifamily construction is in the pipeline within 1–3 miles? Heavy new supply (>2% of stock underway) typically softens rents 12–24 months out; light construction supports rent growth.
Investment metrics
- 1% rule
- 1.63% ✓
- Cap rate
- 13.48%
- Cash-on-cash
- 25.65%
- DSCR
- 2.14
- GRM
- 5.1
CMA / ARV
- ARV (median comp)
- $304,712
- List price
- $320,000
- Delta
- 5.02%
- Verdict
- FAIR
- Comps
- 7 within 1.0 mi
Projected returns pro-forma
5.79% appreciation · 3.0% rent growth · sell at horizon
- IRR
- 36.7%
- Equity multiple
- 3.35×
- Total profit
- $210,569
- Equity at exit
- $197,015
- IRR
- 34.3%
- Equity multiple
- 6.86×
- Total profit
- $525,082
- Equity at exit
- $353,750
Cash invested: $89,600 (down + closing). Projections, not guarantees.
Landlord ↔ Tenant lean methodology
- Overall (STATE)
- 15 Strongly Tenant-Friendly
- State New York
- 15 Strongly Tenant-Friendly · D+10
- County
- — inherits STATE
- City
- — inherits STATE
ZIP-level market 13856
- Home prices YoY
- 1.8%
- Active inventory
- 57
- Price-to-rent
- 10.2×
Monthly cashflow live
- Estimated rent
- $5,224 medium interval (Pro) →
- Mortgage (P&I)
- −$1,678
- Tax est. 1.5%
- −$400 /mo · $4,800/yr
- Insurance
- −$133
- HOA
- −$0
- Vacancy / Maint / Mgmt
- −$1,097
- Net cashflow
- $1,916
Break-even live
2-unit breakdown (identical units grouped — click to expand)
| Units | Beds | Baths | Est. rent |
|---|---|---|---|
| 2× units | 2 | 1.5 | $5,224 |
| #1 | 2 | 1.5 | $2,612 |
| #2 | 2 | 1.5 | $2,612 |
| Total (2 units) | $5,224 | ||
UW: 25.0% down · 7.5% · 30yr · 1.5% tax · 5.0% vac · 8.0% maint · 8.0% mgmt
Financing live
Cash to close
- Down payment
- $80,000
- Closing costs
- $9,600
- Reserves months
- —
- Total cash needed
- —
Loan-product check · same deal, 3 products live
Conventional
25% down · 7.5% · 30yr
- Down + closing
- —
- Monthly P&I
- —
- Monthly cashflow
- —
- DSCR
- —
- Eligible?
- —
Personal DTI + credit; lowest rate.
DSCR
20% down · 8.5% · 30yr
- Down + closing
- —
- Monthly P&I
- —
- Monthly cashflow
- —
- DSCR
- —
- Eligible?
- —
No personal income docs; deal must DSCR.
Hard money
10% down · 12.0% · 12mo
- Down + closing
- —
- Monthly P&I
- —
- Monthly cashflow
- —
- DSCR
- —
- Eligible?
- —
Short-term bridge; refi at stabilization.
Listing history 21 events
-
2026-06-18days on market $320,000 Active 44 DOM
-
2026-06-17days on market $320,000 Active 43 DOM
-
2026-06-16days on market $320,000 Active 42 DOM
-
2026-06-15days on market $320,000 Active 41 DOM
-
2026-06-13days on market $320,000 Active 39 DOM
-
2026-06-12days on market $320,000 Active 38 DOM
-
2026-06-09days on market $320,000 Active 35 DOM
-
2026-06-08days on market $320,000 Active 34 DOM
-
2026-06-07days on market $320,000 Active 33 DOM
-
2026-06-07days on market $320,000 Active 32 DOM
-
2026-06-04days on market $320,000 Active 29 DOM
-
2026-06-02days on market $320,000 Active 28 DOM
-
2026-06-01days on market $320,000 Active 27 DOM
-
2026-05-31days on market $320,000 Active 26 DOM
-
2026-05-04$320,000 Active 954-char remark
-
2026-04-16historical
-
2026-03-09$325,000 Active
-
2025-09-20historical
-
2025-07-13price $325,000
-
2025-04-21price $475,000
-
2024-09-23$500,000 Active
ⓘ Source: listings_history table (triggers on properties + properties_extension) + one-shot
backfill from property_details.listing_events for pre-trigger history.
Nearby sold comps map
Loading sold comps map…
Walkable amenities ~0.75 mi
Loading nearby amenities…
Taxation est. · year 1
- Rental income
- $62,688
- − Mortgage interest
- −$17,925
- − Property taxes
- −$4,800
- − Insurance
- −$1,600
- − Repairs & maintenance
- −$5,015
- − Management
- −$5,015
- − Depreciation
- −$9,309
- Taxable income
- $19,024
- Est. tax owed @ 24.0%
- −$4,566
- After-tax cash flow
- $18,420/yr
For passive investors: Depreciation is non-cash, so a rental often shows a tax loss while cash-flowing — sheltering income. Rental losses are passive: they offset passive income freely, and up to $25,000/yr can offset ordinary (W-2) income if you actively participate and your MAGI is under $100k (phasing out to $0 by $150k); unused losses carry forward. On sale, claimed depreciation is recaptured at up to 25%, and gains may owe capital-gains tax (a 1031 exchange can defer both). Figures are a year-1 estimate at your 24.0% rate — not tax advice; consult a CPA.
Condition & rehab AI · 2 photos
This multi-family property, while in fair condition, requires moderate repairs to the exterior and roof. A fresh coat of paint and some landscaping improvements would significantly enhance its resale and rental value.
Repairs flagged
- Major roof — Significant discoloration suggests potential water damage
- Major exterior siding — Weathered and discolored, indicating need for repainting or replacement
Value-add opportunities
- Both paint exterior — Fresh paint would improve curb appeal and property value
- Both landscaping — Well-maintained landscaping enhances curb appeal and property value
Renovation cost estimate screening
| Repair item | Severity | Est. cost |
|---|---|---|
| roof · Significant discoloration suggests potential water damage | Major | $15,000–50,000 |
| exterior siding · Weathered and discolored, indicating need for repainting or replacement | Major | $15,000–50,000 |
| Total estimated repair cost · 2 items | $30,000–100,000 |
Value-add ROI direction
- Both paint exterior — Fresh paint would improve curb appeal and property value ↑
- Both landscaping — Well-maintained landscaping enhances curb appeal and property value ↑
ⓘ Cost ranges are severity-bucket heuristics (US national rule-of-thumb). Get contractor quotes + a written scope before underwriting a rehab budget.
Schools (NCES district)
- District
- Walton Central School District
- NCES district ID
- 3629820
- Math proficiency
- 36% ▬ 0.00%
- Reading proficiency
- 47% ▲ 3.00%
- Median HH income
- $41,231
- Composite
- 34.86/100
- National rank
- #5088
- State rank
- #510 of 590 in NY
Livability — Walton
- Score
- 70/100
- State rank
- #443
- US rank
- #7789
Category grades
Schools grade is shown separately in the Schools card above.
Census & demographics
- Census place
- Walton, NY
- Population (ZIP)
- 5,915
Population outlook (Delaware County) Hauer SSP2
- Today (2025)
- 42,668 people
- By 2030
- 40,337 · -5.5%
- By 2040
- 35,514 · -16.8%
- By 2050
- 31,265 · -26.7%
- By 2075
- 24,455 · -42.7%
- By 2100
- 19,529 · -54.2%
Race, ethnicity, and origin ACS 2023
- Neighborhood character
- Predominantly White (90%)
- Race & ethnicity
- White 90% Black 5% Two or more races 5% Hispanic / Latino 2%
- Common ancestry
- Iranian 7% Slovak 3% Lithuanian 3%
- Foreign-born
- 3% · Canada, Philippines
- Languages at home
- 94% English-only · Spanish 2% Other Indo-European 1% French/Haitian/Cajun 1%
Political lean MEDSL · Delaware
- 2024 margin
- R (+19.8) · D 40.1% · R 59.9%
- 2008→2024 swing
- -14.6pp toward R · 2008: -5.2pp · 2024: -19.8pp
- All cycles
- 2024: R+19.8 2020: R+18.4 2016: R+29.2 2012: R+9.6 2008: R+5.2
Not yet ingested
- Civics
- —
Market trends
- HPI YoY
- ▲ 5.79%
- Current HPI
- 331.9799
- Rent YoY
- —
- Metro
- —
- State GDP YoY
- ▲ 2.60%
- F500 in state
- 92
Industry mix (Fortune 500 HQ in NY)
| Industry | F500 HQs | Revenue |
|---|---|---|
| Financial Services | 10 | $950B |
|
||
| Consumer Goods | 9 | $162B |
|
||
| Insurance | 4 | $225B |
|
||
| Telecommunications | 2 | $144B |
|
||
| Pharmaceuticals | 2 | $112B |
|
||
| Media / Entertainment | 2 | $69B |
|
||
Price history
-36.0% since first listed7 events — show timeline
- 2026-05-04 Listed $320,000 UNYREIS
- 2026-04-16 Listing Removed — UNYREIS
- 2026-03-09 Listed $325,000 UNYREIS
- 2025-09-20 Listing Removed — UNYREIS
- 2025-07-13 Price Changed $325,000 UNYREIS
- 2025-04-21 Price Changed $475,000 UNYREIS
- 2024-09-23 Listed $500,000 UNYREIS
Cash-flow waterfall
monthlySold comps — $/sqft
last 12 mo · ≤1 miLoading sold comps…