71756 Spike Dr · Covington, LA
Flood risk 1/10 · Minimal
- FEMA flood zone
- X
- Chance of flooding over 30 yrs
- 0.0%
- Est. flood insurance / yr
- $507 – $1,088
Fire risk 4/10 · Minor
- Est. fire insurance / yr
- $1,269 – $2,357
Heat risk 9/10 · Severe
- Hot days now (above 109°F)
- 7 days/yr
- Hot days in 30 yrs
- 21 days/yr
Wind risk 9/10 · Severe
- Chance of severe wind over 30 yrs
- 99.0%
Air-quality risk 2/10 · Minimal
- Unhealthy air days now
- 0 days/yr
- Unhealthy air days in 30 yrs
- 1 days/yr
Risk factors via First Street. Map © Google.
Why this score? — see what drove the D grade
The composite is a weighted blend of 9 inputs, each scored 0–100. Each bar is that input's sub-score; the figure is the points it added to the 100-point composite (weight × sub-score).
- Cash flow +13.7/30.0
- ARV discount +7.2/15.0
- 1% rule +4.5/10.0
- Schools +4.3/10.0
- DSCR +4.1/10.0
- Condition / age +4.0/5.0
- Livability +3.8/5.0
- Rent growth +2.5/5.0
- Appreciation +0.0/10.0
$215,845
🖨 Deal sheet (PDF) 📄 Offer letter ✓ Due diligence
Listing remarks MLS
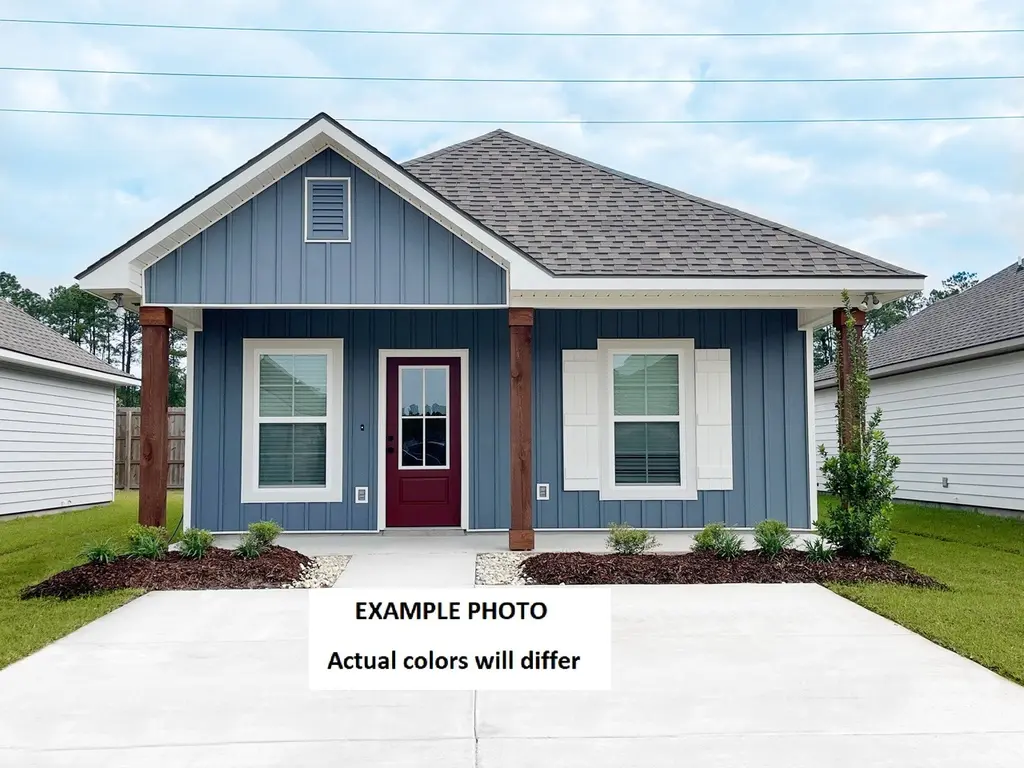
* 2/1 buydown with rate as low as 3.99% for the first 12 months. Contact Builder Sales Rep(s) for current incentive details. * LOCATED ON A GARDEN LOT! This RYAN II M has an open floor plan with upgraded cabinets, luxury vinyl plank flooring added in primary bedroom & more. Special plan interior features: granite counters, stainless appliances, kitchen island, smart connect Wi-Fi thermostat, walk-in closet in primary suite & much more! Energy Efficient Features: Low E Tilt-in windows, radiant barrier roof decking, high efficiency HVAC & electric heat pump, R-15 wall insulation & R-38 attic insulation & the list goes on!
Key facts
- Smart home package
- Free refrigerator
- New construction
Tags
Neighborhood map
What this means for you Summary
Snapshot
- This is a 3-bed/2.0-bath single-family listed at $216k. Condition is rated good.
Deal economics
- At list price, monthly cash flow is $14 ($168/yr) — positive.
- The deal already cash-flows at list — no discount required.
- To meet the 1% rule (rent ≥ 1% of price), the offer needs to be $205k (5.1% below list).
- Recommended offer: $205k (5.1% below list) — sets the bar for 1% rule.
- Cap rate 6.4% vs local median 3.9% in Covington — top-decile yield for the area; either an underpriced asset or a hidden risk that comps aren't pricing in. Stress-test before assuming the spread holds.
Location & tenants
- Location reads 75/100 on livability (#17 in LA, #3,876 nationally) — a middle-class / working-renter tenant base. Strengths: employment A+, housing A+, health & safety A+; Watch: amenities F, commute F.
- St. Tammany Parish (suburban): math 43% / reading 55% proficiency, ranked #11 of 98 in LA (top 11%) — families likely to look elsewhere, expect single-tenant / working-renter base with shorter leases.
- Zoned schools: Joseph B. Lancaster Elementary School (math 58% / reading 73%, grade B+, #38 of 646 statewide, top 6%, 1,505 students, 21% FRL); Madisonville Junior High School (math 41% / reading 58%, grade C, #28 of 218 statewide, top 13%, 655 students, 21% FRL); Mandeville High School (math 59% / reading 63%, grade C+, #19 of 265 statewide, top 7%, 2,259 students, 22% FRL) — zoned schools average 21% FRL vs 40% district-wide (19 pts lower); this property's tenant base skews higher-income than the district average.
- Market conditions: 249 active listings in the ZIP; 4 comparable units currently listed for rent nearby; rentals at typical pace (median 26d on market — plan ~3-4 weeks tenant-placement turnaround); high-income renter base; 1,064 units permitted in St. Tammany Parish in 2024 (0 in 5+ unit buildings).
Forward outlook
- Local home prices are declining (-3.0%/yr); year-one equity from $1k of loan paydown is wiped out by about $6k of value loss. Plan a longer hold.
- St. Tammany County population projected at +27% by 2050 — long-run rental-demand tailwind backs the buy-and-hold thesis.
Negotiation context
- It's been on market 46 days — a 3% lower offer ($209k) is reasonable based on typical stale-listing flexibility.
- 3 sale attempts with the ask held roughly flat each time — persistent listings suggest the price (not the market) is what's stuck; bring a comps-based counter.
Risks & watch-outs
- Climate carrying-cost: severe wind risk, 99% chance of damaging wind over 30y; extreme-heat days projected 7→21/yr by 2055 (HVAC capex compounding) — expect insurance premiums to compound above CPI over the hold.
Questions for the listing agent
- It's been on market 46 days. Have you received any prior offers? Is the seller open to a 5% concession, seller financing, or rate buy-down credit?
- What does the HOA fee cover, when was the last increase, and are there any pending special assessments or reserve-fund shortfalls?
- Is there a deadline driving the sale (1031 exchange, divorce, estate, relocation)? That informs how much negotiation room exists.
- Schools are B-rated — typically a magnet for longer-tenancy family renters. What's the average tenant stay here, and is there a school-zone premium baked into asking?
- The area grade is low — what's the realistic commute time and amenity access for the typical tenant pool here? Any planned neighborhood developments (good or bad) we should know about?
- What's the average days-on-market for RENTAL listings here right now (not sales)? A rising rental-DOM trend means longer vacancies and softer asking-rent achievability than the comps imply.
- What's the recent tenant-quality profile in this submarket — average credit score on applications, eviction rate, late-payment / NSF rate, and stable-employment percentage? A property-management company in the area should have these aggregated.
- How much new for-sale + rental construction is in the pipeline within 1–3 miles? Heavy new supply typically softens prices + rents 12–24 months out; constrained supply supports both.
Investment metrics
- 1% rule
- 0.95% ✗
- Cap rate
- 6.37%
- Cash-on-cash
- 0.28%
- DSCR
- 1.01
- GRM
- 8.8
CMA / ARV
- ARV (median comp)
- $214,535
- List price
- $215,845
- Delta
- 0.61%
- Verdict
- FAIR
- Comps
- 20 within 1.0 mi
Show comp detail 12 sales within ~0.75 mi
| Address | Dist | Beds/Ba | Sqft | Sold | Price | $/sf | Match |
|---|---|---|---|---|---|---|---|
| 71768 Spike Dr | 0.01mi | 3/2.0 | 1,067 (0%) | 1mo | $215,240 | $202 | 98 |
| 71732 Spike Dr | 0.05mi | 3/2.0 | 1,067 (0%) | 0mo | $215,165 | $202 | 98 |
| 71736 Spike Dr | 0.04mi | 3/2.0 | 1,067 (0%) | 1mo | $215,127 | $202 | 97 |
| 71724 Spike Dr | 0.06mi | 3/2.0 | 1,067 (0%) | 2mo | $219,907 | $206 | 95 |
| 71720 Spike Dr | 0.07mi | 3/2.0 | 1,104 (+4%) | 2mo | $216,096 | $196 | 90 |
| 71772 Spike Dr | 0.02mi | 3/2.0 | 1,001 (-6%) | 1mo | $205,061 | $205 | 88 |
| 71712 Spike Dr | 0.08mi | 3/2.0 | 1,104 (+4%) | 4mo | $215,691 | $195 | 87 |
| 71704 Spike Dr | 0.09mi | 3/2.0 | 1,001 (-6%) | 0mo | $205,040 | $205 | 85 |
| 71604 Spike Dr | 0.12mi | 3/2.0 | 1,021 (-4%) | 2mo | $211,130 | $207 | 85 |
| 71784 Spike Dr | 0.03mi | 3/2.0 | 1,001 (-6%) | 4mo | $206,343 | $206 | 85 |
| 71572 Spike Dr | 0.12mi | 3/2.0 | 1,001 (-6%) | 3mo | $208,223 | $208 | 81 |
| 71672 Spike Dr | 0.13mi | 3/2.0 | 1,001 (-6%) | 4mo | $206,158 | $206 | 80 |
Match score weights: distance 35% · size 25% · config 20% · recency 20%. Top-matched comps best support the ARV.
Projected returns pro-forma
-3.0% appreciation · 3.0% rent growth · sell at horizon
- IRR
- -15.8%
- Equity multiple
- 0.44×
- Total profit
- $-33,984
- Equity at exit
- $32,183
- IRR
- -7.3%
- Equity multiple
- 0.54×
- Total profit
- $-28,037
- Equity at exit
- $18,662
Cash invested: $60,437 (down + closing). Projections, not guarantees.
Landlord ↔ Tenant lean methodology
- Overall (STATE)
- 90 Strongly Landlord-Friendly
- State Louisiana
- 90 Strongly Landlord-Friendly · R+12
- County
- — inherits STATE
- City
- — inherits STATE
ZIP-level market 70447
- Home prices YoY
- -28.1%
- Active inventory
- 249
- Price-to-rent
- 8.8×
Monthly cashflow live
- Estimated rent
- $2,048 medium interval (Pro) →
- Mortgage (P&I)
- −$1,132
- Tax est. 1.5%
- −$270 /mo · $3,238/yr
- Insurance
- −$90
- HOA
- −$112
- Vacancy / Maint / Mgmt
- −$430
- Net cashflow
- $14
Break-even live
Sensitivity live
| Price | -10% $163 | -5% $89 | +0% $14 | +5% $-61 | +10% $-135 |
|---|---|---|---|---|---|
| Rent | -10% $-148 | -5% $-67 | +0% $14 | +5% $95 | +10% $176 |
| Rate | -1.0pp $123 | -0.5pp $69 | base $14 | +0.5pp $-42 | +1.0pp $-99 |
UW: 25.0% down · 7.5% · 30yr · 1.5% tax · 5.0% vac · 8.0% maint · 8.0% mgmt
Financing live
Cash to close
- Down payment
- $53,961
- Closing costs
- $6,475
- Reserves months
- —
- Total cash needed
- —
Loan-product check · same deal, 3 products live
Conventional
25% down · 7.5% · 30yr
- Down + closing
- —
- Monthly P&I
- —
- Monthly cashflow
- —
- DSCR
- —
- Eligible?
- —
Personal DTI + credit; lowest rate.
DSCR
20% down · 8.5% · 30yr
- Down + closing
- —
- Monthly P&I
- —
- Monthly cashflow
- —
- DSCR
- —
- Eligible?
- —
No personal income docs; deal must DSCR.
Hard money
10% down · 12.0% · 12mo
- Down + closing
- —
- Monthly P&I
- —
- Monthly cashflow
- —
- DSCR
- —
- Eligible?
- —
Short-term bridge; refi at stabilization.
Rent comps 4 comps
| Address | Beds | Baths | Sqft | Rent | $/sqft | DOM | Units | Dist |
|---|---|---|---|---|---|---|---|---|
| 71772 Spike Dr Madisonville, LA | 3.0 | 2.0 | 1001 | $1,800 | $1.80 | 5d | 1 | 0.03mi |
| 71736 Spike Dr Madisonville, LA | 3.0 | 2.0 | 1067 | $1,550 | $1.45 | 25d | 1 | 0.05mi |
| 126 Scott St Madisonville, LA | 3.0 | 2.0 | 1264 | $1,750 | $1.38 | 22d | 1 | 1.44mi |
| 118 Poe St Madisonville, LA | 3.0 | 2.0 | 1287 | $1,650 | $1.28 | 25d | 1 | 1.48mi |
HOA detail
- Monthly dues
- $112 · $1,344/yr
- Likely covers
- electricinternet
Listing history 3 events
-
2026-04-14$215,845 Active 659-char remark
Show marketing remark (659 chars)
* 2/1 buydown with rate as low as 3.99% for the first 12 months. Contact Builder Sales Rep(s) for current incentive details. * LOCATED ON A GARDEN LOT! This RYAN II M has an open floor plan with upgraded cabinets, luxury vinyl plank flooring added in primary bedroom & more. Special plan interior features: granite counters, stainless appliances, kitchen island, smart connect Wi-Fi thermostat, walk-in closet in primary suite & much more! Energy Efficient Features: Low E Tilt-in windows, radiant barrier roof decking, high efficiency HVAC & electric heat pump, R-15 wall insulation & R-38 attic insulation & the list goes on!
-
2026-04-13$215,845 Active 671-char remark
Show marketing remark (671 chars)
Awesome builder rate + FREE front gutters OR window blinds(restrictions apply)! Brand NEW Construction in DEER CROSSING built by DSLD HOMES! LOCATED ON A GARDEN LOT! This RYAN II M has an open floor plan with upgraded cabinets, luxury vinyl plank flooring added in primary bedroom & more. Special plan interior features: granite counters, stainless appliances, kitchen island, smart connect Wi-Fi thermostat, walk-in closet in primary suite & much more! Energy Efficient Features: Low E Tilt-in windows, radiant barrier roof decking, high efficiency HVAC & electric heat pump, R-15 wall insulation & R-38 attic insulation & the list goes on!
ⓘ Source: listings_history table (triggers on properties + properties_extension) + one-shot
backfill from property_details.listing_events for pre-trigger history.
Climate risk First Street
- Flood 1/10 Low FEMA zone X · 0% chance over 30 yrs
- Wildfire 4/10 Moderate
- Heat 9/10 Extreme 7 d/yr ≥109°F today · 21 d/yr by 30 yrs out
- Wind 9/10 Extreme 99% chance of damaging wind over 30 yrs
- Air quality 2/10 Low 0 unhealthy d/yr today · 1 by 30 yrs out
Nearby sold comps map
Loading sold comps map…
Walkable amenities ~0.75 mi
Loading nearby amenities…
Taxation est. · year 1
- Rental income
- $24,572
- − Mortgage interest
- −$12,091
- − Property taxes
- −$3,238
- − Insurance
- −$1,079
- − Repairs & maintenance
- −$1,966
- − Management
- −$1,966
- − HOA
- −$1,344
- − Depreciation
- −$6,279
- Taxable loss
- −$3,390
- Est. tax savings @ 24.0%
- +$814
- After-tax cash flow
- $982/yr
For passive investors: Depreciation is non-cash, so a rental often shows a tax loss while cash-flowing — sheltering income. Rental losses are passive: they offset passive income freely, and up to $25,000/yr can offset ordinary (W-2) income if you actively participate and your MAGI is under $100k (phasing out to $0 by $150k); unused losses carry forward. On sale, claimed depreciation is recaptured at up to 25%, and gains may owe capital-gains tax (a 1031 exchange can defer both). Figures are a year-1 estimate at your 24.0% rate — not tax advice; consult a CPA.
Condition & rehab AI · 6 photos
This home is in excellent condition with upgraded features and a well-maintained exterior. Minor updates to the exterior and energy-efficient upgrades would further enhance its value.
Value-add opportunities
- Both Paint exterior siding — Enhances curb appeal and value
- Both Replace ceiling fans with energy-efficient models — Saves on energy costs and improves aesthetics
- Both Install smart home security system — Enhances safety and adds modern amenities
Renovation cost estimate screening
Value-add ROI direction
- Both Paint exterior siding — Enhances curb appeal and value ↑
- Both Replace ceiling fans with energy-efficient models — Saves on energy costs and improves aesthetics ↑
- Both Install smart home security system — Enhances safety and adds modern amenities ↑
ⓘ Cost ranges are severity-bucket heuristics (US national rule-of-thumb). Get contractor quotes + a written scope before underwriting a rehab budget.
Schools (NCES district)
- District
- St. Tammany Parish
- NCES district ID
- 2201650
- Math proficiency
- 43% ▼ -32.00%
- Reading proficiency
- 55% ▼ -26.00%
- Median HH income
- $61,752
- Composite
- 43.04/100
- National rank
- #3098
- State rank
- #11 of 98 in LA
Livability — Covington
- Score
- 75/100
- State rank
- #17
- US rank
- #3876
Category grades
Schools grade is shown separately in the Schools card above.
Census & demographics
- County
- Saint Tammany Parish · 228,296 people
- City population
- 64,351
- Metro
- New Orleans-Metairie, LA
- Population (ZIP)
- 17,897
- Household income
- $122,574
- Rent vs Own
- Severe rent burden
- 47.0
Population outlook (St. Tammany County) Hauer SSP2
- Today (2025)
- 286,725 people
- By 2030
- 304,175 · +6.1%
- By 2040
- 336,203 · +17.3%
- By 2050
- 364,590 · +27.2%
- By 2075
- 433,362 · +51.1%
- By 2100
- 470,333 · +64.0%
Race, ethnicity, and origin ACS 2023
- Neighborhood character
- Predominantly White (84%)
- Race & ethnicity
- White 84% Two or more races 7% Hispanic / Latino 6% Black 2%
- Hispanic origin (detail)
- Mexican 1%
- Common ancestry
- Lithuanian 19% Slovak 3% Romanian 2%
- Foreign-born
- 5% · Canada
- Languages at home
- 97% English-only · Spanish 1% Other Asian/Pacific 1% Russian/Polish/Slavic 1%
Political lean MEDSL · St. Tammany
- 2024 margin
- Solid R (+43.8) · D 27.3% · R 71.1% · Other 1.6%
- 2008→2024 swing
- +9.6pp toward D · 2008: -53.4pp · 2024: -43.8pp
- All cycles
- 2024: R+43.8 2020: R+44.2 2016: R+50.8 2012: R+52.2 2008: R+53.4
Not yet ingested
- Civics
- —
Market trends
- HPI YoY
- ▼ -68.07%
- Current HPI
- 174.0804
- Rent YoY
- —
- Metro
- New Orleans-Metairie, LA
- State GDP YoY
- ▲ 3.29%
- F500 in state
- 10
Industry mix (Fortune 500 HQ in LA)
| Industry | F500 HQs | Revenue |
|---|---|---|
| Telecommunications | 2 | $23B |
|
||
| Utilities | 1 | $12B |
|
||
| Wholesale / Distribution | 1 | $5B |
|
||
| Advertising | 1 | $2B |
|
||
Price history
+0.0% since first listed3 events — show timeline
- 2026-04-14 Listed $215,845 Zillow
- 2026-04-13 Listed $215,845 AcadianaMLS
- 2026-04-13 Listed $215,845 GSREIN
Cash-flow waterfall
monthlySold comps — $/sqft
last 12 mo · ≤1 miLoading sold comps…