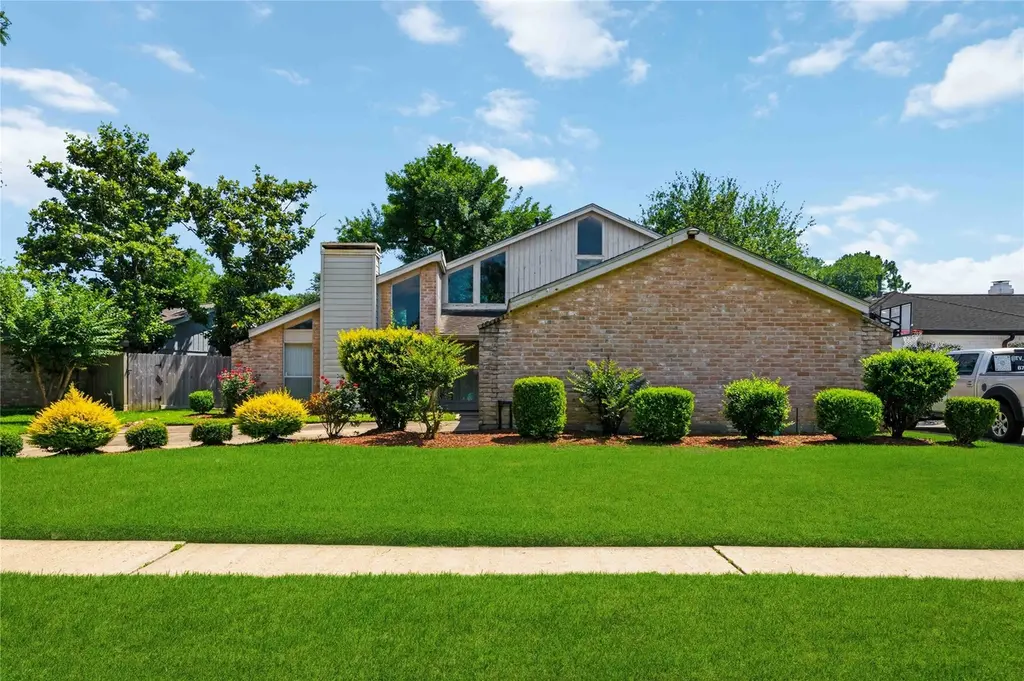
1823 Hilton Head Dr · Missouri City, TX
Flood risk 6/10 · Moderate
- FEMA flood zone
- X (unshaded)
- Chance of flooding over 30 yrs
- 0.71%
- Est. flood insurance / yr
- $507 – $1,088
Fire risk 2/10 · Minimal
- Est. fire insurance / yr
- $1,222 – $2,270
Heat risk 9/10 · Severe
- Hot days now (above 110°F)
- 7 days/yr
- Hot days in 30 yrs
- 23 days/yr
Wind risk 9/10 · Severe
- Chance of severe wind over 30 yrs
- 99.0%
Air-quality risk 3/10 · Minor
- Unhealthy air days now
- 2 days/yr
- Unhealthy air days in 30 yrs
- 3 days/yr
Risk factors via First Street. Map © Google.
Why this score? — see what drove the B- grade
The composite is a weighted blend of 9 inputs, each scored 0–100. Each bar is that input's sub-score; the figure is the points it added to the 100-point composite (weight × sub-score).
- Cash flow +21.5/30.0
- ARV discount +15.0/15.0
- 1% rule +7.1/10.0
- DSCR +6.9/10.0
- Schools +4.5/10.0
- Appreciation +4.2/10.0
- Livability +3.4/5.0
- Rent growth +2.5/5.0
- Condition / age +2.5/5.0
$200,000
🖨 Deal sheet 📄 Offer letter ✓ Due diligence
Listing remarks
Situated on a large, picturesque Quail Valley lot w/ beautiful mature surroundings & attractive curb appeal, this unique 2-story property offers an exciting opportunity for buyers with a vision. Featuring 2,058sqft, 3 bedrooms, 2.5 bathrooms, formal dining or additional living room, & a 2-car garage, the home showcases distinctive architectural character & an uncommon floor plan full of potential! While the property does require interior & exterior cosmetic improvements, the opportunity is significant. With good architectural bones, spacious living areas, & a convenient location within an established golf course community, this home is ready to be transformed int
Key facts
- Uncommon floor plan
- Convenient location
- 7,326 sq ft lot
Tags
Property features AI
Finance
- HOA & community: Community association (Thunderbird North Community Assoc); Association amenities include pool and tennis courts; Annual association fee of $188; Community features include curbs and golf access
Exterior
- Parking: Attached 2-car garage; Attached garage parking
- Utilities: Public water; Public sewer; Concrete road access
- Home design: Residential property; Slab foundation; Composition roof; Built in 1977; Living area approximately 2,058
- Construction: Wood siding construction
- Exterior features: Deck; Patio; Private yard; Fenced backyard; Tennis courts; Association pool
Interior
- Kitchen: Dishwasher; Electric cooktop; Electric oven; Microwave
- Bedrooms: Primary bedroom on first floor (14x15); Two additional bedrooms on second floor (13x12 and 12x11)
- Flooring: Tile flooring
- Bathrooms: 2 full bathrooms; 1 half bathroom
- Heating & cooling: Central heating (electric); Central air (electric)
- Interior features: High ceilings; Double vanity in bath; Primary bedroom with private bath; Tub/shower; One fireplace; 7 total rooms
- Laundry & utility: Washer hookup; Electric dryer hookup; Gas dryer hookup; Utility room on first floor
Neighborhood map
What this means for you Summary
Snapshot
- This is a 4-bed/3.0-bath single-family listed at $200k.
Deal economics
- At list price, monthly cash flow is $300 ($4k/yr) — positive.
- The deal already cash-flows at list — no discount required.
- Meets the 1% rule at list price ($2k rent vs $200k).
- Recommended offer: $197k (1.5% below list) — sets the bar for market timing.
- Cap rate 8.1% vs local median 3.5% in Missouri City — top-decile yield for the area; either an underpriced asset or a hidden risk that comps aren't pricing in. Stress-test before assuming the spread holds.
Location & tenants
- Location reads 67/100 on livability (#526 in TX) — a middle-class / working-renter tenant base. Strengths: housing A+, crime A, employment A; Watch: amenities F, commute F, health & safety F.
- Fort Bend ISD (suburban): math 44% / reading 53% proficiency, ranked #140 of 826 in TX (top 17%) — families likely to look elsewhere, expect single-tenant / working-renter base with shorter leases.
- Zoned schools: Lantern Lane El (math 17% / reading 37%, grade F, #2,791 of 4,322 statewide, top 68%, 472 students, 77% FRL); Quail Valley Middle (math 55% / reading 57%, grade B-, #234 of 1,662 statewide, top 14%, 1,043 students, 45% FRL) — zoned schools average 61% FRL vs 35% district-wide (26 pts higher); higher-poverty schools than district average — tighter screening recommended.
- Market conditions: Rents soft (-0.1%/yr); 1215 active listings in the ZIP; 16 comparable units currently listed for rent nearby; rentals at typical pace (median 22d on market — plan ~3-4 weeks tenant-placement turnaround); 44% of comp listings sitting > 30 days — soft ceiling on asking rent; high-income renter base; 12,093 units permitted in Fort Bend County in 2024 (815 in 5+ unit buildings).
Forward outlook
- Local home prices are declining (-1.7%/yr); year-one equity from $1k of loan paydown is wiped out by about $3k of value loss. Plan a longer hold.
- Fort Bend County population projected at +75% by 2050 — long-run rental-demand tailwind backs the buy-and-hold thesis.
Negotiation context
- It's been on market 27 days — a 2% lower offer ($197k) is reasonable based on typical stale-listing flexibility.
- 2 sale attempts; this cycle's ask has dropped $18k (8%) from the opening price — seller is motivated, your offer sets the floor, not the list.
Risks & watch-outs
- Watch-outs: property tax is 2.8% of price.
- Climate carrying-cost: major flood risk; severe wind risk, 99% chance of damaging wind over 30y; extreme-heat days projected 7→23/yr by 2055 (HVAC capex compounding) — expect insurance premiums to compound above CPI over the hold.
Questions for the listing agent
- Built in 1977 — when were the roof, HVAC, electrical panel, plumbing, and water heater last replaced?
- Property tax is high relative to price — has the assessment been appealed recently, and will the sale trigger a re-assessment?
- What does the HOA fee cover, when was the last increase, and are there any pending special assessments or reserve-fund shortfalls?
- Is there a deadline driving the sale (1031 exchange, divorce, estate, relocation)? That informs how much negotiation room exists.
- Schools are B-rated — typically a magnet for longer-tenancy family renters. What's the average tenant stay here, and is there a school-zone premium baked into asking?
- What's the average days-on-market for RENTAL listings here right now (not sales)? A rising rental-DOM trend means longer vacancies and softer asking-rent achievability than the comps imply.
- What's the recent tenant-quality profile in this submarket — average credit score on applications, eviction rate, late-payment / NSF rate, and stable-employment percentage? A property-management company in the area should have these aggregated.
- How much new for-sale + rental construction is in the pipeline within 1–3 miles? Heavy new supply typically softens prices + rents 12–24 months out; constrained supply supports both.
Investment metrics
- 1% rule
- 1.21% ✓
- Cap rate
- 8.09%
- Cash-on-cash
- 6.43%
- DSCR
- 1.29
- GRM
- 6.9
CMA / ARV
- ARV (median comp)
- $272,683
- List price
- $200,000
- Delta
- -26.65%
- Verdict
- UNDERPRICED
- Comps
- 20 within 1.0 mi
Show comp detail 12 sales within ~0.75 mi
| Address | Dist | Beds/Ba | Sqft | Sold | Price | $/sf | Match |
|---|---|---|---|---|---|---|---|
| 1747 Hilton Head Dr | 0.06mi | 4/2.5 | 2,030 (-1%) | 2mo | $300,000 | $148 | 92 |
| 1858 Hilton Head Dr | 0.11mi | 3/2.0 (-1) | 1,859 (-10%) | 6mo | $189,000 | $102 | 65 |
| 2726 Valley Forest Dr | 0.59mi | 4/2.0 | 1,937 (-6%) | 4mo | $298,000 | $154 | 56 |
| 3234 Cherry Springs Dr | 0.42mi | 4/2.5 | 2,292 (+11%) | 4mo | $238,500 | $104 | 56 |
| 8618 Quail Vista Dr | 0.58mi | 3/2.0 (-1) | 1,980 (-4%) | 3mo | $267,000 | $135 | 55 |
| 3519 Telford Ln Ln | 0.67mi | 4/2.0 | 2,165 (+5%) | 2mo | $345,000 | $159 | 54 |
| 3434 Harper Meadow Ln | 0.64mi | 4/2.0 | 2,147 (+4%) | 5mo | $355,000 | $165 | 54 |
| 2818 Eaglerock Cir | 0.71mi | 4/2.0 | 2,146 (+4%) | 2mo | $289,000 | $135 | 54 |
| 1519 Wells Manor Ln | 0.61mi | 4/2.0 | 1,881 (-9%) | 1mo | $327,000 | $174 | 52 |
| 1927 S Bend Cir | 0.74mi | 3/3.0 (-1) | 1,985 (-4%) | 4mo | $265,000 | $134 | 51 |
| 3626 Telford Ln | 0.70mi | 4/3.0 | 2,330 (+13%) | 0mo | $365,000 | $157 | 45 |
| 2230 Quail Valley East Dr | 0.62mi | 3/2.0 (-1) | 1,838 (-11%) | 2mo | $224,900 | $122 | 42 |
Match score weights: distance 35% · size 25% · config 20% · recency 20%. Top-matched comps best support the ARV.
Projected returns pro-forma
-1.67% appreciation · 0.0% rent growth · sell at horizon
- IRR
- -3.9%
- Equity multiple
- 0.84×
- Total profit
- $-8,824
- Equity at exit
- $41,946
- IRR
- 0.1%
- Equity multiple
- 1.01×
- Total profit
- $548
- Equity at exit
- $38,852
Cash invested: $56,000 (down + closing). Projections, not guarantees.
Landlord ↔ Tenant lean methodology
- Overall (STATE)
- 87 Strongly Landlord-Friendly
- State Texas
- 87 Strongly Landlord-Friendly · R+5
- County
- — inherits STATE
- City
- — inherits STATE
ZIP-level market 77459
- Home prices YoY
- -0.8%
- Rents YoY
- -0.1%
- Active inventory
- 1215
- Price-to-rent
- 6.9×
Monthly cashflow live
- Estimated rent
- $2,423 high interval (Pro) →
- Mortgage (P&I)
- −$1,049
- Tax from tax record
- −$466 /mo · $5,592/yr
- Insurance
- −$83
- HOA
- −$16
- Vacancy / Maint / Mgmt
- −$509
- Net cashflow
- $300
Break-even live
UW: 25.0% down · 7.5% · 30yr · 1.5% tax · 5.0% vac · 8.0% maint · 8.0% mgmt
Financing live
Cash to close
- Down payment
- $50,000
- Closing costs
- $6,000
- Reserves months
- —
- Total cash needed
- —
Loan-product check · same deal, 3 products live
Conventional
25% down · 7.5% · 30yr
- Down + closing
- —
- Monthly P&I
- —
- Monthly cashflow
- —
- DSCR
- —
- Eligible?
- —
Personal DTI + credit; lowest rate.
DSCR
20% down · 8.5% · 30yr
- Down + closing
- —
- Monthly P&I
- —
- Monthly cashflow
- —
- DSCR
- —
- Eligible?
- —
No personal income docs; deal must DSCR.
Hard money
10% down · 12.0% · 12mo
- Down + closing
- —
- Monthly P&I
- —
- Monthly cashflow
- —
- DSCR
- —
- Eligible?
- —
Short-term bridge; refi at stabilization.
Rent comps 16 comps
| Address | Beds | Baths | Sqft | Rent | $/sqft | DOM | Units | Dist |
|---|---|---|---|---|---|---|---|---|
| 2010 Quail Valley East Dr Missouri City, TX | 5.0 | 3.0 | 2651 | $2,695 | $1.02 | 43d | 1 | 0.34mi |
| 1919 Doliver Cir Missouri City, TX | 3.0 | 2.0 | 1515 | $2,000 | $1.32 | 43d | 1 | 0.46mi |
| 2910 Fawn Ct Missouri City, TX | 4.0 | 2.5 | 2330 | $2,220 | $0.95 | 43d | 1 | 0.48mi |
| 17318 Edgehaven Dr Missouri City, TX | 3.0 | 2.0 | 1448 | $1,695 | $1.17 | 20d | 1 | 0.56mi |
| 3618 Quail Meadow Dr Missouri City, TX | 3.0 | 2.0 | 1618 | $1,966 | $1.22 | 43d | 1 | 0.67mi |
| 2307 Hilton Head Dr Missouri City, TX | 4.0 | 2.0 | 2606 | $2,239 | $0.86 | 16d | 1 | 0.69mi |
| 1323 Park Crest Dr Missouri City, TX | 5.0 | 3.0 | 2607 | $2,600 | $1.00 | 43d | 1 | 0.72mi |
| 2319 Quail Valley East Dr Missouri City, TX | 5.0 | 3.0 | 2235 | $2,000 | $0.89 | 43d | 1 | 0.76mi |
| 4039 Mission Valley Dr Missouri City, TX | 4.0 | 2.5 | 2364 | $2,495 | $1.06 | 22d | 1 | 0.92mi |
| 1109 Lakes Edge Ln Missouri City, TX | 4.0 | 3.0 | 2847 | $2,800 | $0.98 | 20d | 1 | 1.05mi |
| 3907 Kiamesha Dr Missouri City, TX | 4.0 | 2.5 | 2896 | $2,750 | $0.95 | 17d | 1 | 1.08mi |
| 16310 Setter Ct Missouri City, TX | 3.0 | 2.0 | 1672 | $1,700 | $1.02 | 43d | 1 | 1.29mi |
| 1806 Courtside Place Dr Missouri City, TX | 4.0 | 2.5 | 1974 | $1,915 | $0.97 | 12d | 1 | 1.30mi |
| 2026 Summer Place Dr Missouri City, TX | 3.0 | 2.0 | 1837 | $1,861 | $1.01 | 20d | 1 | 1.33mi |
| 1935 Poco Dr Missouri City, TX | 4.0 | 3.0 | 2868 | $2,326 | $0.81 | 22d | 1 | 1.33mi |
| 2222 Mountshire Dr Missouri City, TX | 4.0 | 2.5 | 2278 | $2,700 | $1.19 | 20d | 1 | 1.48mi |
HOA detail
- Monthly dues
- $16 · $192/yr
Listing history 11 events
-
2026-06-18days on market $200,000 Pending 27 DOM
-
2026-06-17status $200,000 Pending 26 DOM
-
2026-06-17days on market $200,000 Active 26 DOM
-
2026-06-16days on market $200,000 Active 25 DOM
-
2026-06-15days on market $200,000 Active 24 DOM
-
2026-06-13pricestatusdays on market $200,000 Active 22 DOM
-
2026-06-09days on market $207,500 Pending 18 DOM
-
2026-06-04days on market $207,500 Pending 17 DOM
-
2026-05-31days on market $207,500 Pending 16 DOM
-
2026-05-15$217,500 Active 1003-char remark
-
2026-04-27soldstatus
ⓘ Source: listings_history table (triggers on properties + properties_extension) + one-shot
backfill from property_details.listing_events for pre-trigger history.
Tax reassessment forecast TX · Resets to sale price
- Current annual tax
- $5,592 · $466/mo
- Projected year-2 tax
- $5,592 · $466/mo
- Expected delta
- $0/yr ($0/mo · 0.0%)
ⓘ Screening estimate from a state-policy table — verify with the county assessor before closing.
Climate risk First Street
- Flood 6/10 Major FEMA zone X (unshaded) · 71% chance over 30 yrs
- Wildfire 2/10 Low
- Heat 9/10 Extreme 7 d/yr ≥110°F today · 23 d/yr by 30 yrs out
- Wind 9/10 Extreme 99% chance of damaging wind over 30 yrs
- Air quality 3/10 Moderate 2 unhealthy d/yr today · 3 by 30 yrs out
Nearby sold comps map
Loading sold comps map…
Walkable amenities ~0.75 mi
Loading nearby amenities…
Taxation est. · year 1
- Rental income
- $29,077
- − Mortgage interest
- −$11,203
- − Property taxes
- −$5,592
- − Insurance
- −$1,000
- − Repairs & maintenance
- −$2,326
- − Management
- −$2,326
- − HOA
- −$192
- − Depreciation
- −$5,818
- Taxable income
- $619
- Est. tax owed @ 24.0%
- −$148
- After-tax cash flow
- $3,452/yr
For passive investors: Depreciation is non-cash, so a rental often shows a tax loss while cash-flowing — sheltering income. Rental losses are passive: they offset passive income freely, and up to $25,000/yr can offset ordinary (W-2) income if you actively participate and your MAGI is under $100k (phasing out to $0 by $150k); unused losses carry forward. On sale, claimed depreciation is recaptured at up to 25%, and gains may owe capital-gains tax (a 1031 exchange can defer both). Figures are a year-1 estimate at your 24.0% rate — not tax advice; consult a CPA.
Schools (NCES district)
- District
- Fort Bend ISD
- NCES district ID
- 4819650
- Math proficiency
- 44% ▼ -15.00%
- Reading proficiency
- 53% ▼ -4.00%
- Median HH income
- $82,360
- Composite
- 44.61/100
- National rank
- #2779
- State rank
- #140 of 826 in TX
Livability — Missouri City
- Score
- 67/100
- State rank
- #526
- US rank
- #10308
Category grades
Schools grade is shown separately in the Schools card above.
Census & demographics
- Census place
- Missouri City, TX
- County
- Fort Bend County · 836,777 people
- City population
- 123,513
- Metro
- Houston-The Woodlands-Sugar Land, TX
- Population (ZIP)
- 84,221
- Household income
- $129,151
- Rent vs Own
- Severe rent burden
- 1004.0
Population outlook (Fort Bend County) Hauer SSP2
- Today (2025)
- 1,004,526 people
- By 2030
- 1,153,104 · +14.8%
- By 2040
- 1,453,718 · +44.7%
- By 2050
- 1,753,781 · +74.6%
- By 2075
- 2,455,772 · +144.5%
- By 2100
- 2,930,528 · +191.7%
Race, ethnicity, and origin ACS 2023
- Neighborhood character
- Highly diverse neighborhood (Simpson 0.75)
- Race & ethnicity
- White 34% Black 26% Asian 22% Hispanic / Latino 13% Two or more races 10%
- Hispanic origin (detail)
- Mexican 7%
- Common ancestry
- Lithuanian 2% Slovak 1% Italian 1%
- Foreign-born
- 21% · Canada, China, Vietnam
- Languages at home
- 73% English-only · Other Asian/Pacific 8% Spanish 7% Other Indo-European 5%
Political lean MEDSL · Fort Bend
- 2024 margin
- Toss-up / Even · D 49.5% · R 47.9% · Other 2.6%
- 2008→2024 swing
- +4.0pp toward D · 2008: -2.4pp · 2024: 1.6pp
- All cycles
- 2024: D+1.6 2020: D+10.6 2016: D+6.6 2012: R+6.8 2008: R+2.4
Not yet ingested
- Civics
- —
Market trends
- HPI YoY
- ▼ -1.67%
- Current HPI
- 212.3573
- Rent YoY
- ▼ -0.15%
- Metro
- Houston-The Woodlands-Sugar Land, TX
- State GDP YoY
- ▲ 3.95%
- F500 in state
- 110
Industry mix (Fortune 500 HQ in TX)
| Industry | F500 HQs | Revenue |
|---|---|---|
| Energy | 16 | $1,198B |
|
||
| Technology | 5 | $198B |
|
||
| Engineering / Construction | 4 | $72B |
|
||
| Energy Services | 3 | $60B |
|
||
| Utilities | 3 | $41B |
|
||
| Healthcare | 2 | $330B |
|
||
Price history
-8.0% since first listed11 events — show timeline
- 2026-06-17 Pending — HARMLS
- 2026-06-10 Relisted — HARMLS
- 2026-06-10 Price Changed $200,000 HARMLS
- 2026-06-08 Pending — HARMLS
- 2026-06-04 Pending — HARMLS
- 2026-06-03 Pending — HARMLS
- 2026-06-01 Pending — HARMLS
- 2026-05-26 Pending — HARMLS
- 2026-05-20 Price Changed $207,500 HARMLS
- 2026-05-15 Listed $217,500 HARMLS
- 2026-04-27 Sold (Public Records) — Public Records
Property tax history
+5.1%/yrLatest (2025): $5,592 · -4.3% YoY. Source: county tax records.
Cash-flow waterfall
monthlySold comps — $/sqft
last 12 mo · ≤1 miLoading sold comps…