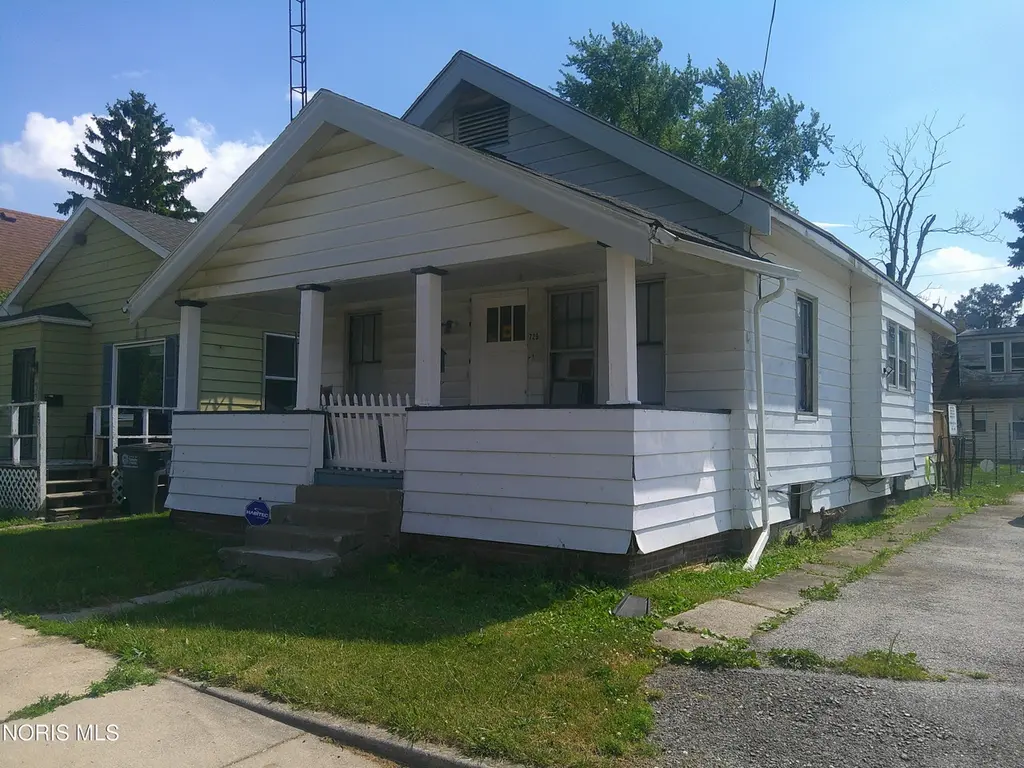
729 Chicago St · Toledo, OH
Flood risk 1/10 · Minimal
- FEMA flood zone
- X (unshaded)
- Chance of flooding over 30 yrs
- 0.0%
- Est. flood insurance / yr
- $473 – $860
Fire risk 1/10 · Minimal
- Est. fire insurance / yr
- $713 – $1,323
Heat risk 3/10 · Minor
- Hot days now (above 100°F)
- 7 days/yr
- Hot days in 30 yrs
- 16 days/yr
Wind risk 2/10 · Minimal
- Chance of severe wind over 30 yrs
- —
Air-quality risk 2/10 · Minimal
- Unhealthy air days now
- 1 days/yr
- Unhealthy air days in 30 yrs
- 3 days/yr
Risk factors via First Street. Map © Google.
Why this score? — see what drove the C grade
The composite is a weighted blend of 9 inputs, each scored 0–100. Each bar is that input's sub-score; the figure is the points it added to the 100-point composite (weight × sub-score).
- Cash flow +30.0/30.0
- 1% rule +10.0/10.0
- DSCR +10.0/10.0
- Livability +3.3/5.0
- Rent growth +2.5/5.0
- Condition / age +2.5/5.0
- Schools +1.6/10.0
- ARV discount +0.0/15.0
- Appreciation +0.0/10.0
$55,000
🖨 Deal sheet 📄 Offer letter ✓ Due diligence
Listing remarks MLS
This 2 bedroom home is ready for a new owner. Brand new flooring and light fixtures. This home is a nice addition to an investment portfolio. Additional parking lot no longer for sale.
Key facts
- 3,100 sq ft lot
- Built 1923
- Listed 10 days
Property features AI
Exterior
- Parking: Asphalt driveway with alley access and additional parking
- Utilities: Electricity connected (100 Amp service); Natural gas available; Public water; Public sewer; Cable available; WiFi available
- Home design: Single-family house; One story; No shared/common walls; Entry level is main
- Construction: Aluminum siding; Block foundation; Full block basement
- Exterior features: Private yard; Front porch; Shingle roof
Interior
- Kitchen: Kitchen on main level
- Bedrooms: Second bedroom on main level; All bedrooms on main level
- Flooring: Vinyl flooring
- Bathrooms: 1 bathroom
- Heating & cooling: Forced air heating
- Interior features: Five total rooms; Other interior features
- Laundry & utility: Laundry located in the basement
Neighborhood map
What this means for you Summary
Snapshot
- This is a 2-bed/1.0-bath single-family listed at $55k.
Deal economics
- At list price, monthly cash flow is $371 ($4k/yr) — positive.
- The deal already cash-flows at list — no discount required.
- Meets the 1% rule at list price ($926 rent vs $55k).
- Cap rate 14.4% vs local median 7.6% in Toledo — top-decile yield for the area; either an underpriced asset or a hidden risk that comps aren't pricing in. Stress-test before assuming the spread holds.
Location & tenants
- Location reads 66/100 on livability (#645 in OH) — a middle-class / working-renter tenant base. Strengths: cost of living A+, housing A+, health & safety A+; Watch: amenities C-, crime F, commute F.
- Toledo City (urban): math 15% / reading 24% proficiency, ranked #634 of 656 in OH (top 97%) — low school quality limits family demand, transient renter base, plan for 1-2y turnover; 72% free/reduced lunch — lower-income household profile, screen leases tightly.
- Zoned schools: Riverside Elementary School (math 8% / reading 12%, grade F, #1,471 of 1,584 statewide, top 95%, 361 students, 0% FRL); Jesup W. Scott High School (math 8% / reading 17%, grade F, #726 of 781 statewide, top 94%, 736 students, 0% FRL) — zoned schools average 0% FRL vs 72% district-wide (72 pts lower); this property's tenant base skews higher-income than the district average.
- Market conditions: 64 active listings in the ZIP; 25 comparable units currently listed for rent nearby; rentals at typical pace (median 24d on market — plan ~3-4 weeks tenant-placement turnaround); 44% of comp listings sitting > 30 days — soft ceiling on asking rent; 415 units permitted in Lucas County in 2024 (122 in 5+ unit buildings).
- This rent is only 18% of the median local income ($62k/yr) — well below the 30% rent-burden line; pricing power to push rent on renewal without tenant pushback.
Forward outlook
- Local home prices are declining (-3.0%/yr); year-one equity from $380 of loan paydown is wiped out by about $2k of value loss. Plan a longer hold.
- Lucas County population projected at -16% by 2050 — secular population decline; favor cash flow + early exit over multi-decade hold.
- At projected returns (-3.0% appreciation + 3.0% rent growth), your $15k cash investment doubles in ~5 years — after that, you're playing with house money.
Negotiation context
- Only 10 days on market — expect competitive offers; lowballing is unlikely to land.
- 6 sale attempts since 24y ago with the ask held roughly flat each time — persistent listings suggest the price (not the market) is what's stuck; bring a comps-based counter.
- Current owner paid $45k; 22% above their basis — modest negotiation headroom, anchor on the comps not their cost.
Risks & watch-outs
- Watch-outs: built in 1923 — expect roof / HVAC / electrical / plumbing capex.
Questions for the listing agent
- Built in 1923 — when were the roof, HVAC, electrical panel, plumbing, and water heater last replaced?
- Is there a deadline driving the sale (1031 exchange, divorce, estate, relocation)? That informs how much negotiation room exists.
- Schools are D-rated, which usually means shorter tenancies and higher turnover. Who's the typical renter profile here, and what's been the actual vacancy rate?
- Crime grade is F in this area — have there been break-ins, vandalism, or insurance claims at this property in the last 3 years? What carrier currently insures it and at what premium?
- What's the average days-on-market for RENTAL listings here right now (not sales)? A rising rental-DOM trend means longer vacancies and softer asking-rent achievability than the comps imply.
- What's the recent tenant-quality profile in this submarket — average credit score on applications, eviction rate, late-payment / NSF rate, and stable-employment percentage? A property-management company in the area should have these aggregated.
- How much new for-sale + rental construction is in the pipeline within 1–3 miles? Heavy new supply typically softens prices + rents 12–24 months out; constrained supply supports both.
Investment metrics
- 1% rule
- 1.68% ✓
- Cap rate
- 14.39%
- Cash-on-cash
- 28.90%
- DSCR
- 2.29
- GRM
- 4.9
CMA / ARV
- ARV (on-the-fly)
- $45,076
- Comps found
- 7
Show comp detail 7 sales within ~0.75 mi
| Address | Dist | Beds/Ba | Sqft | Sold | Price | $/sf | Match |
|---|---|---|---|---|---|---|---|
| 729 Chicago St | 0.00mi | 2/1.0 | 764 (0%) | 6mo | $45,000 | $59 | 95 |
| 2422 N Ontario St | 0.27mi | 2/1.0 | 814 (+6%) | 2mo | $55,000 | $68 | 74 |
| 2816 N Michigan St | 0.59mi | 2/1.0 | 774 (+1%) | 5mo | $64,362 | $83 | 66 |
| 1823 Booth Ave | 0.72mi | 2/1.0 | 760 (-0%) | 22mo | $20,900 | $28 | 47 |
| 1631 N Erie St | 0.72mi | 2/1.0 | 856 (+12%) | 4mo | $17,000 | $20 | 43 |
| 1519 Clay Ave | 0.70mi | 2/1.0 | 704 (-8%) | 19mo | $33,000 | $47 | 39 |
| 1828 Homer Ave | 0.75mi | 2/1.0 | 850 (+11%) | 17mo | $68,000 | $80 | 32 |
Match score weights: distance 35% · size 25% · config 20% · recency 20%. Top-matched comps best support the ARV.
Projected returns pro-forma
-3.0% appreciation · 3.0% rent growth · sell at horizon
- IRR
- 23.3%
- Equity multiple
- 1.96×
- Total profit
- $14,713
- Equity at exit
- $8,201
- IRR
- 31.2%
- Equity multiple
- 3.81×
- Total profit
- $43,240
- Equity at exit
- $4,755
Cash invested: $15,400 (down + closing). Projections, not guarantees.
Landlord ↔ Tenant lean methodology
- Overall (STATE)
- 73 Landlord-Friendly
- State Ohio
- 73 Landlord-Friendly · R+6
- County
- — inherits STATE
- City
- — inherits STATE
ZIP-level market 43611
- Home prices YoY
- -24.4%
- Active inventory
- 64
- Price-to-rent
- 4.9×
Monthly cashflow live
- Estimated rent
- $926 high interval (Pro) →
- Mortgage (P&I)
- −$288
- Tax from tax record
- −$50 /mo · $594/yr
- Insurance
- −$23
- HOA
- −$0
- Vacancy / Maint / Mgmt
- −$195
- Net cashflow
- $371
Break-even live
UW: 25.0% down · 7.5% · 30yr · 1.5% tax · 5.0% vac · 8.0% maint · 8.0% mgmt
Financing live
Cash to close
- Down payment
- $13,750
- Closing costs
- $1,650
- Reserves months
- —
- Total cash needed
- —
Loan-product check · same deal, 3 products live
Conventional
25% down · 7.5% · 30yr
- Down + closing
- —
- Monthly P&I
- —
- Monthly cashflow
- —
- DSCR
- —
- Eligible?
- —
Personal DTI + credit; lowest rate.
DSCR
20% down · 8.5% · 30yr
- Down + closing
- —
- Monthly P&I
- —
- Monthly cashflow
- —
- DSCR
- —
- Eligible?
- —
No personal income docs; deal must DSCR.
Hard money
10% down · 12.0% · 12mo
- Down + closing
- —
- Monthly P&I
- —
- Monthly cashflow
- —
- DSCR
- —
- Eligible?
- —
Short-term bridge; refi at stabilization.
Rent comps 25 comps
| Address | Beds | Baths | Sqft | Rent | $/sqft | DOM | Units | Dist |
|---|---|---|---|---|---|---|---|---|
| 2023 N Erie St Toledo, OH | 1.0 | 1.0 | 951 | $685 | $0.72 | 21d | 1 | 0.23mi |
| 1951 N Summit St Unit 2 Toledo, OH | 2.0 | 1.0 | 835 | $800 | $0.96 | 44d | 1 | 0.41mi |
| 413 Sandusky St Toledo, OH | 2.0 | 1.0 | 900 | $775 | $0.86 | 23d | 1 | 0.42mi |
| 2932 N Ontario St Toledo, OH | 2.0 | 1.0 | 750 | $750 | $1.00 | 23d | 1 | 0.72mi |
| 2929 N Summit St Toledo, OH | 1.0 | 1.0 | 650 | $550 | $0.85 | 14d | 1 | 0.76mi |
| 3405 Beaumont Dr Toledo, OH | 2.0 | 1.0 | 855 | $745 | $0.87 | 14d | 1 | 0.90mi |
| 3439 Jeannette Ave Toledo, OH | 3.0 | 1.0 | 1098 | $1,095 | $1.00 | 44d | 1 | 0.99mi |
| 2039 Genesee St Toledo, OH | 1.0 | 1.0 | 660 | $625 | $0.95 | 44d | 1 | 1.03mi |
| 3474 Maher St Toledo, OH | 2.0 | 1.0 | 736 | $1,125 | $1.53 | 44d | 1 | 1.06mi |
| 630 Mulberry St Toledo, OH | 2.0 | 1.0 | 1000 | $950 | $0.95 | 23d | 1 | 1.08mi |
| 2514 York St Unit Back Toledo, OH | 2.0 | 1.0 | 696 | $850 | $1.22 | 14d | 1 | 1.17mi |
| 1848 Genesee St Toledo, OH | 3.0 | 1.0 | 1069 | $1,300 | $1.22 | 23d | 1 | 1.18mi |
| 1848 Genesee St Toledo, OH | 3.0 | 1.0 | 1069 | $1,200 | $1.12 | 44d | 1 | 1.18mi |
| 21 Magyar St Toledo, OH | 2.0 | 1.0 | 680 | $1,050 | $1.54 | 44d | 1 | 1.25mi |
| 2807 Chestnut St Unit 2 Toledo, OH | 1.0 | 1.0 | 745 | $495 | $0.66 | 21d | 1 | 1.25mi |
| 1119 N Summit St Toledo, OH | 1.0–2.0 | 1.0–2.0 | 1023 | $1,750 | $1.71 | 14d | 2 | 1.30mi |
| 420 Everett St Toledo, OH | 2.0 | 1.0 | 1000 | $975 | $0.97 | 23d | 1 | 1.32mi |
| 524 E Hudson St Toledo, OH | 2.0 | 1.0 | 1050 | $825 | $0.79 | 44d | 1 | 1.36mi |
| 329 Mettler St Toledo, OH | 2.0 | 1.0 | 908 | $975 | $1.07 | 14d | 1 | 1.40mi |
| 128 Carbon St Toledo, OH | 3.0 | 1.0 | 1113 | $1,200 | $1.08 | 23d | 1 | 1.40mi |
| 3563 E Manhattan Blvd Toledo, OH | 1.0–2.0 | 1.0 | 707 | $850 | $1.20 | 14d | 1 | 1.40mi |
| 319 Dexter St Toledo, OH | 2.0 | 1.0 | 990 | $1,005 | $1.02 | 44d | 1 | 1.44mi |
| 622 Whitlock Ave Toledo, OH | 3.0 | 1.0 | 925 | $1,195 | $1.29 | 44d | 1 | 1.47mi |
| 227 Everett St Toledo, OH | 2.0 | 1.0 | 914 | $850 | $0.93 | 44d | 1 | 1.47mi |
| 251 Graham St Apt A Toledo, OH | 2.0 | 1.0 | 625 | $850 | $1.36 | 44d | 1 | 1.47mi |
Listing history 8 events
-
2026-06-18days on market $55,000 Active 10 DOM
-
2026-06-17days on market $55,000 Active 9 DOM
-
2026-06-16days on market $55,000 Active 8 DOM
-
2026-06-15days on market $55,000 Active 7 DOM
-
2026-06-14days on market $55,000 Active 5 DOM
-
2026-06-10days on market $55,000 Active 2 DOM
-
2026-06-09remarks 151-char remark
-
2026-06-09$55,000 Active 1 DOM
ⓘ Source: listings_history table (triggers on properties + properties_extension) + one-shot
backfill from property_details.listing_events for pre-trigger history.
Tax reassessment forecast OH · Partial reset (capped growth)
- Current annual tax
- $594 · $50/mo
- Projected year-2 tax
- $726 · $61/mo
- Expected delta
- +$132/yr (+$11/mo · 22.2%)
ⓘ Screening estimate from a state-policy table — verify with the county assessor before closing.
Climate risk First Street
- Flood 1/10 Low FEMA zone X (unshaded) · 0% chance over 30 yrs
- Wildfire 1/10 Low
- Heat 3/10 Moderate 7 d/yr ≥100°F today · 16 d/yr by 30 yrs out
- Wind 2/10 Low
- Air quality 2/10 Low 1 unhealthy d/yr today · 3 by 30 yrs out
Nearby sold comps map
Loading sold comps map…
Walkable amenities ~0.75 mi
Loading nearby amenities…
Taxation est. · year 1
- Rental income
- $11,116
- − Mortgage interest
- −$3,081
- − Property taxes
- −$594
- − Insurance
- −$275
- − Repairs & maintenance
- −$889
- − Management
- −$889
- − Depreciation
- −$1,600
- Taxable income
- $3,787
- Est. tax owed @ 24.0%
- −$909
- After-tax cash flow
- $3,542/yr
For passive investors: Depreciation is non-cash, so a rental often shows a tax loss while cash-flowing — sheltering income. Rental losses are passive: they offset passive income freely, and up to $25,000/yr can offset ordinary (W-2) income if you actively participate and your MAGI is under $100k (phasing out to $0 by $150k); unused losses carry forward. On sale, claimed depreciation is recaptured at up to 25%, and gains may owe capital-gains tax (a 1031 exchange can defer both). Figures are a year-1 estimate at your 24.0% rate — not tax advice; consult a CPA.
Schools (NCES district)
- District
- Toledo City
- NCES district ID
- 3904490
- Math proficiency
- 15% ▼ -16.00%
- Reading proficiency
- 24% ▼ -13.00%
- Median HH income
- $32,137
- Composite
- 15.76/100
- National rank
- #9276
- State rank
- #634 of 656 in OH
Livability — Toledo
- Score
- 66/100
- State rank
- #645
- US rank
- #11442
Category grades
Schools grade is shown separately in the Schools card above.
Census & demographics
- Census place
- Toledo, OH
- County
- Lucas County · 380,724 people
- City population
- 280,811
- Metro
- Toledo, OH
- Population (ZIP)
- 18,664
- Household income
- $62,042
- Rent vs Own
- Severe rent burden
- 298.0
Population outlook (Lucas County) Hauer SSP2
- Today (2025)
- 420,751 people
- By 2030
- 410,187 · -2.5%
- By 2040
- 384,019 · -8.7%
- By 2050
- 355,125 · -15.6%
- By 2075
- 291,683 · -30.7%
- By 2100
- 233,670 · -44.5%
Race, ethnicity, and origin ACS 2023
- Neighborhood character
- Predominantly White (77%)
- Race & ethnicity
- White 77% Black 11% Hispanic / Latino 8% Two or more races 6%
- Hispanic origin (detail)
- Mexican 6%
- Common ancestry
- Romanian 13% Lithuanian 5% Slovak 2%
- Foreign-born
- 1% · Canada
- Languages at home
- 96% English-only · Spanish 2% French/Haitian/Cajun 1%
Political lean MEDSL · Lucas
- 2024 margin
- D (+12.6) · D 55.8% · R 43.2%
- 2008→2024 swing
- -18.9pp toward R · 2008: 31.4pp · 2024: 12.6pp
- All cycles
- 2024: D+12.6 2020: D+16.8 2016: D+17.4 2012: D+30.4 2008: D+31.4
Not yet ingested
- Civics
- —
Market trends
- HPI YoY
- ▼ -79.15%
- Current HPI
- 245.2841
- Rent YoY
- —
- Metro
- Toledo, OH
- State GDP YoY
- ▲ 1.98%
- F500 in state
- 48
Industry mix (Fortune 500 HQ in OH)
| Industry | F500 HQs | Revenue |
|---|---|---|
| Insurance | 3 | $145B |
|
||
| Industrial Machinery | 3 | $49B |
|
||
| Financial Services | 3 | $24B |
|
||
| Consumer Goods | 2 | $93B |
|
||
| Aerospace / Defense | 2 | $47B |
|
||
| Utilities | 2 | $33B |
|
||
Price history
+243.8% since first listed15 events — show timeline
- 2026-06-08 Listed $55,000 NORIS
- 2026-01-06 Sold (Public Records) $45,000 Public Records
- 2025-12-18 Sold (MLS) $45,000 NORIS
- 2025-12-13 Pending — NORIS
- 2025-11-16 Listed $49,900 NORIS
- 2025-11-15 Listing Removed — NORIS
- 2025-11-05 Price Changed $58,900 NORIS
- 2025-10-18 Listed $59,900 NORIS
- 2003-11-28 Listing Removed — NORIS
- 2003-09-11 Listed $35,000 NORIS
- 2003-07-23 Listing Removed — NORIS
- 2003-05-20 Listed $35,000 NORIS
- 2003-04-21 Listing Removed — NORIS
- 2002-10-21 Listed $35,000 NORIS
- 1987-09-24 Sold (Public Records) $16,000 Public Records
Property tax history
+1.8%/yrLatest (2025): $594 · +5.2% YoY. Source: county tax records.
Cash-flow waterfall
monthlySold comps — $/sqft
last 12 mo · ≤1 miLoading sold comps…